HAL Id: hal-02626430
https://hal.inrae.fr/hal-02626430
Submitted on 26 May 2020
HAL is a multi-disciplinary open access archive for the deposit and dissemination of sci-entific research documents, whether they are pub-lished or not. The documents may come from teaching and research institutions in France or abroad, or from public or private research centers.
L’archive ouverte pluridisciplinaire HAL, est destinée au dépôt et à la diffusion de documents scientifiques de niveau recherche, publiés ou non, émanant des établissements d’enseignement et de recherche français ou étrangers, des laboratoires publics ou privés.
genome-wide association mapping study highlights
calcium signaling and metabolism genes
Julien Frouin, Antoine Languillaume, Justine Mas, Delphine Mieulet, Arnaud
Boisnard, Axel Labeyrie, Mathilde Bettembourg, Charlotte Bureau, Eve
Lorenzini, Murielle Portefaix, et al.
To cite this version:
Julien Frouin, Antoine Languillaume, Justine Mas, Delphine Mieulet, Arnaud Boisnard, et al.. Tol-erance to mild salinity stress in japonica rice: A genome-wide association mapping study high-lights calcium signaling and metabolism genes. PLoS ONE, Public Library of Science, 2018, 13 (1), �10.1371/journal.pone.0190964�. �hal-02626430�
Tolerance to mild salinity stress in japonica
rice: A genome-wide association mapping
study highlights calcium signaling and
metabolism genes
Julien Frouin1, Antoine Languillaume1, Justine Mas1, Delphine Mieulet1, Arnaud Boisnard2, Axel Labeyrie1, Mathilde Bettembourg1, Charlotte Bureau1,
Eve Lorenzini1, Muriel Portefaix3, Patricia Turquay1, Aurore Vernet1, Christophe Pe´rin1, Nourollah Ahmadi1, Brigitte Courtois1
*
1 Centre de coope´ration internationale en recherche agronomique pour le de´veloppement, Unite´ mixte de
recherche Ame´lioration ge´ne´tique et adaptation des plantes me´diterrane´ennes et tropicales, Montpellier, France, 2 Centre Franc¸ais du Riz, Arles, France, 3 Institut National de la Recherche Agronomique, Unite´ mixte de recherche Ame´lioration ge´ne´tique et adaptation des plantes me´diterrane´ennes et tropicales, Montpellier, France
*brigitte.courtois@cirad.fr
Abstract
Salinity tolerance is an important quality for European rice grown in river deltas. We evalu-ated the salinity tolerance of a panel of 235 temperate japonica rice accessions genotyped with 30,000 SNP markers. The panel was exposed to mild salt stress (50 mM NaCl; conduc-tivity of 6 dS m-1) at the seedling stage. Eight different root and shoot growth parameters
were measured for both the control and stressed treatments. The Na+and K+mass fractions
of the stressed plants were measured using atomic absorption spectroscopy. The salt treat-ment affected plant growth, particularly the shoot parameters. The panel showed a wide range of Na+/K+ratio and the temperate accessions were distributed over an increasing axis, from the most resistant to the most susceptible checks. We conducted a genome-wide association study on indices of stress response and ion mass fractions in the leaves using a classical mixed model controlling structure and kinship. A total of 27 QTLs validated by sub-sampling were identified. For indices of stress responses, we also used another model that
focused on marker×treatment interactions and detected 50 QTLs, three of which were also
identified using the classical method. We compared the positions of the significant QTLs to those of approximately 300 genes that play a role in rice salt tolerance. The positions of sev-eral QTLs were close to those of genes involved in calcium signaling and metabolism, while other QTLs were close to those of kinases. These results reveal the salinity tolerance of accessions with a temperate japonica background. Although the detected QTLs must be confirmed by other approaches, the number of associations linked to candidate genes involved in calcium-mediated ion homeostasis highlights pathways to explore in priority to understand the salinity tolerance of temperate rice.
a1111111111 a1111111111 a1111111111 a1111111111 a1111111111 OPEN ACCESS
Citation: Frouin J, Languillaume A, Mas J, Mieulet
D, Boisnard A, Labeyrie A, et al. (2018) Tolerance to mild salinity stress in japonica rice: A genome-wide association mapping study highlights calcium signaling and metabolism genes. PLoS ONE 13(1): e0190964.https://doi.org/10.1371/journal. pone.0190964
Editor: Niranjan Baisakh, Louisiana State
University, UNITED STATES
Received: July 10, 2017 Accepted: December 22, 2017 Published: January 17, 2018
Copyright:© 2018 Frouin et al. This is an open access article distributed under the terms of the
Creative Commons Attribution License, which permits unrestricted use, distribution, and reproduction in any medium, provided the original author and source are credited.
Data Availability Statement: The phenotypic data
and the list of genes with known functions and candidate genes are available in the paper and its Supporting Information files. The genotypic data can be downloaded in HapMap format from the Tropgene database:http://tropgenedb.cirad.fr/ tropgene/JSP/interface.jsp?module=RICEstudy “Genotypes”, study type
Introduction
In Europe, rice is grown on approximately 437,000 ha [1]. Italy (220,000 ha) and Spain (110,000 ha) are the main producers, while Greece, Portugal and France are smaller producers (each under 30,000 ha). European rice is grown under permanently flooded conditions. The irrigation water comes from rivers, such as the Poˆ in Italy, the Ebro in Spain and the Rhoˆne in France. European rice is partly grown in river flood plains, as in Italy, and partly in river deltas. In river deltas, particularly in areas below sea level, rice soils are prone to high salinity levels. The risk of soil salinization is increasing with observed decreases in river flow due to climate change [2–4] and with the potential development of cropping systems without permanent flooding such as the alternate wetting and drying system aimed at economizing water [5–7]. Although soil salinity can be maintained at manageable levels using water management tech-niques to leach salt from topsoil [8–9], the use of rice varieties that are tolerant to salinity has been considered as a protective option.
Relative to other cereals, such as barley and wheat, rice is not a crop that is very tolerant to salinity. Maas and Hoffman [10] classified rice as a sensitive species. A reduction in yield is anticipated when the soil electrical conductivity reaches 2–3 dS m-1[11], and a 12% reduction in yield occurs per each dS m-1beyond this threshold [12]. Although there are known tolerant rice accessions, such as Nona Bokra, Pokkali and Hasawi, these accessions are in limited num-ber amongO. sativa rice genetic resources [13–14]. Tolerant accessions are found in all varietal groups but most of these accessions, which often originate from tidal wetlands and mangrove areas, belong to the indica subspecies and, to a significant extent, to the aromatic group [14]. Tolerance to salinity is required at the seedling and reproductive stages, which are the two stages of maximum plant susceptibility [15]. Nona Bokra and Pokkali exhibit tolerance at the seedling stage, while Hasawi is tolerant at the reproductive stage (RK Singh, International Rice Research Institute (IRRI), personal communication). Apparently, the tolerance mechanisms and the genetic control of tolerance are different at the two stages [16].
The mechanisms involved in the response to salinity in rice have been well described [13,
15,17]. Two stress phases are generally differentiated: an early brief osmotic stress phase, and a subsequent longer-lasting ionic stress phase. In response to exposure to salinity, the Na+ sensing and signaling process from roots to shoot rapidly induces a decrease in water uptake, plant growth and transpiration rate. The decrease in water uptake is mediated by abscisic acid (ABA) but whether this decrease is also due to differences in osmotic pressure is unclear [18]. After this first shoot-ion independent response, if the stress persists, Na+ ions migrate to the roots, either passively through an apoplastic pathway in which Na+ ions directly enter the transpiration stream by leakage [19,20] or actively through a symplastic pathway mediated by cation channels/transporters, such as the high-affinity K+transporter (HKT) gene family. The
apoplastic pathway is predominant in rice [13,19]. The influx of salt into the roots activates perception and signaling, which limits further uptake of Na+through the activation of discrim-inating ion transport systems with high affinities for K+and/or Ca2+but low affinities for Na+. The preferential K+and/or Ca2+uptake reduces the transport of Na+from roots to shoots. A low Na+/K+ratio is therefore generally considered as a relevant indicator of salinity tolerance, although a recent study questioned its importance [18]. A high Na+concentration in the apo-plastic solution activates protection mechanisms that maintain cell turgor under hyperosmotic conditions, particularly by the accumulation of compatible solutes in the cytoplasm, such as proline [13] or trehalose [21] in rice. However, this mitigating response is metabolically costly.
The accumulation of Na+at toxic levels in the leaves induces chlorosis, senescence, necrosis, and ultimately premature death. Potential mitigation mechanisms that enable a reduction of Na+in the shoots while maintaining high cellular K+levels have been described [13]. One of
Funding: This research was conducted in the
framework of the FACCE-JPI project GreenRice (Sustainable and environmental friendly rice cultivation systems in Europe) and was funded by French Agence Nationale de la Recherche (ANR-14-JFAC-0005-01). The funders had no role in study design, data collection and analysis, decision to publish, or preparation of the manuscript.
Competing interests: The authors have declared
these mechanisms is vigorous growth to dilute salt concentrations in the tissues [22]. This tol-erance mechanism is possibly present in Nona Bokra, which develops a huge biomass. Another mechanism to avoid rapid Na+accumulation is sodium exclusion from the transpiration stream, which occurs by sequestrating Na+into the older leaves [23]. Another mitigation mechanism is ion compartmentation into cell vacuoles, which is mediated by Na+/H+ antipor-ters, such as those from the vacuolar Na+/H+ antiporter (OsNHX) family [24]. A final mecha-nism is scavenging of phytotoxic reactive oxygen species (ROS) produced under stress by the activation of antioxidant enzymes, such as ascorbate peroxidase or peroxide dismutase, which limits membrane injuries and protects chloroplast function [13]. Although some authors have indicated that none of these mechanisms are preferentially used in rice [18], other authors have suggested that tissue tolerance mechanisms play secondary roles [14].
When the traits that may be affected by the salinity stress are assessed irrespective of the involved mechanisms (i.e., in the whole-plant perspective), vegetative growth is reduced. Shoots are more affected than roots [13], which in turn increases the root-to-shoot ratio. Cell expansion in young leaves is affected, decreasing the specific leaf area [25]. The thickening of leaf cell walls is sometimes considered adaptive because this process provides a greater volume in which salt can be sequestered [26]. Specific leaf area linearly increases with increasing rela-tive growth rate [25]. In addition, at a later stage, salt stress induces delayed panicle initiation and flowering. Yield components, notably spikelet fertility, are affected by Na+accumulation in flag leaves and developing panicles [26,27].
The genetic control of salt tolerance is only partially understood. Because of the diversity of the involved mechanisms, the genetic architecture of salt tolerance is complex. Numerous quantitative trait loci (QTLs) have been identified using bi-parental mapping populations (reviewed by Negrao et al. [13] for studies conducted prior to 2011, [28–29]), and, more recently, association mapping panels [12,30–33]. Lists of genes involved in salinity tolerance based on the study of mutants or transgenic plants have been established [13,34]. The gene
OsHKT1;5, also called SKC1, which encodes a Na+-selective transporter, has been implicated in the tolerance of Nona Bokra [35]. A major QTL from Pokkali, named Saltol, which is involved in Na/K homeostasis, has been fine mapped in the same area of chromosome 1, but genes from this segment other thanOsHKT1;5 may be implicated as well [36–37]. Pokkali car-ries the same haplotype as Nona Bokra atHKT1;5 [38]. The tolerance allele ofHKT1;5 may
originate from the aromatic groups [14]. Pokkali and Nona Bokra have been largely used as donors in breeding programs for the marker-assisted selection of salinity tolerance and varie-ties as tolerant as the donor parent, such as BRRI Dhan 47, have been released [39]. Although excellent results were obtained by introgressing the Saltol QTL into mega-varieties [36,39–
41], this QTL alone is not sufficient to obtain a high degree of salt tolerance under all condi-tions and stages. A pyramiding approach was proposed several decades ago [22] and Ahmadi et al. [30] showed that even for tolerance at the vegetative stage, the crossing design might involve a large number of accessions that carry different tolerance mechanisms. The question as to which QTLs should be combined must be resolved within each genetic background.
In Europe, because of the risk of low temperatures during the cropping season and the need for accessions to flower during the long days of European summers, almost all rice varieties belong to the temperate japonica group [42]. Thus far, few studies have focused on these acces-sions, although some studies have evaluated temperate japonicas from other areas [12,29,43]. An association study targeted to specific regions of the genome that carry known tolerance genes was performed [30] but no genome-wide association studies (GWASs) have been con-ducted thus far. The two objectives of the present study are to evaluate the salinity tolerance at the seedling stage of a panel of 240 temperate japonica rice accessions jointly established by
breeders from France, Italy and Spain, and to identify potential targets and candidate genes for marker-assisted breeding using genome-wide association mapping.
Materials and methods
Plant materials
The panel comprised 240 temperate japonica accessions. The list of all accessions and their countries of origin is provided inS1 Table. The majority of these lines belong to the panel described in Biscarini et al. [44]. The seeds of these accessions were obtained from the Rice Research Unit of the Consiglio per la ricerca in agricoltura e l’analisi dell’economia agraria (Vercelli, Italy). Seeds from additional Spanish and French lines were obtained from the Insti-tuto de Investigacio´n y Tecnologı´a Agroalimentaria (Torre Marimon, Spain) and from the Centre Franc¸ais du Riz (Arles, France), respectively. Several accessions known for their suscep-tibility or resistance to salinity were added to the panel. The indica accessions Nona Bokra, Pokkali, BRRI Dhan 47, FL478, IR64-Saltol, and Hasawi were used as tolerant checks. The recombinant inbred lines BRRI Dhan 47 and FL478 derived from the cross IR29 x Pokkali are recognized for their high salinity tolerance [36]. IR64-Saltol is a version of IR64 developed by the International Rice Research Institute (IRRI) in which the Saltol QTL from Pokkali on chro-mosome 1 was introgressed by marker-aided selection. IR29 (indica), Giano and Aychade (temperate japonica) were used as susceptible checks. All indica lines were obtained from IRRI.
Genotyping of the panel
The genotyping-by-sequencing (GBS) data used in the present study were derived from pool-ing the sequences from two batches of accessions (batch 1 and batch 2) obtained from separate libraries. DNA extraction for batch 1 and batch 2 was performed as described in Biscarini et al. [44] and Courtois et al. [45], respectively. Library production and sequencing were conducted in 2013 for batch 1 and in 2016 for batch 2; however, in both cases, the procedures were per-formed at the Genomic Diversity Facility of Cornell University according to the method of Elshire et al. [46]. The libraries were built using ApeKI for genome digestion. The libraries were sequenced with an Illumina Genome Analyzer II (San Diego, California, USA). The fastq sequences from the two batches were pooled together and aligned to the rice reference genome (Os-Nipponbare-Reference-IRGSP-1.0 [47]). Single nucleotide polymorphism (SNP) calling was performed using the Tassel GBS pipeline v5.2.29 [48]. Five accessions with a rate of miss-ing data above 30% were discarded. Subsequently, markers with a call rate below 80%, a het-erozygosity rate above 10% or a minimal number of variant accessions below 5 (corresponding to a minor allele frequency (MAF) < 2.0% in this panel) were discarded. The remaining het-erozygotes were converted to missing data. The missing data were imputed using Beagle v4.0 [49]. The final resulting matrix involves 235 individuals and 30 314 markers and can be down-loaded in HapMap format fromhttp://tropgenedb.cirad.fr/tropgene/JSP/interface.jsp? module=RICEstudy “Genotypes”, study type “GreenRice_panel_GBS_data”.
Phenotyping the panel for salinity tolerance
Experimental design. The experimental design of the trial was a split-plot with three rep-licates staggered over time. The whole plot main factor was salinity treatment (control (CTRL) versus salt (SALT)) while the secondary split-plot factor was genotype. In each replicate, the plants were distributed into 12 tanks (6 control and 6 salted). The tanks were considered
sub-plots. Two resistant checks (Nona Bokra and Pokkali) and three susceptible checks (IR29, Aychade and Giano) were replicated in each tank.
Plant growth conditions. The experiment was conducted in a growth chamber with 28– 24˚C day-night temperatures, an 11–13 h day-night photoperiod and a relative humidity of 65%. Tanks of 80 l capacity were used. The tanks were filled with Hoagland and Arnon solu-tion (50 l per tank) [50], pH 5.5, modified as indicated by Courtois et al. [45]. The solution was continuously and gently stirred-aerated using small aquarium pumps (one per tank). The solu-tion was changed every week. The pH was measured every day and adjusted if necessary. Each tank contained a 55.5 cm x 36.6 cm x 3.0 cm foam polystyrene plate with 48 holes drilled at a diameter of 2.5 cm. One hole was left empty and was used for the manipulation of the probe for pH control. Four seeds per accession were sown in the holes of the polystyrene plate. For the first week, a mosquito net with a small mesh was fixed to the bottom of the plate to main-tain the seeds. One week after sowing, the polystyrene plates were changed. The most devel-oped seedling of each hole was wrapped in a small 2.5 cm x 2.5 cm x 2.5 cm polyethylene terephthalate fiber cube (Hail mini cubes, Sure to Grow, Ohio, USA) that was cut diagonally through the center. The seed and its attached roots were set below the cube. The wrapped plant was transferred to a new plate without a plastic grid (one plant per hole). Salt treatment was initiated at two weeks after sowing. To limit the osmotic stress, half of the target salt quan-tity was added to the stressed tanks on day 14. The other half of the target salt quanquan-tity was added on day 15. The final concentration was 50 mM NaCl (3 g/l), corresponding to an electri-cal conductivity of 6.0 dS m-1. The salt concentration was selected based on the results of Ahmadi et al. [30] to limit lethality while strongly decreasing the growth of the most suscepti-ble accessions. The plants were grown for two weeks under these conditions. The conductivity was adjusted as needed by adding osmosed water. The mortality percentage was assessed at each change of the solution. Four weeks after sowing, the plants were harvested.
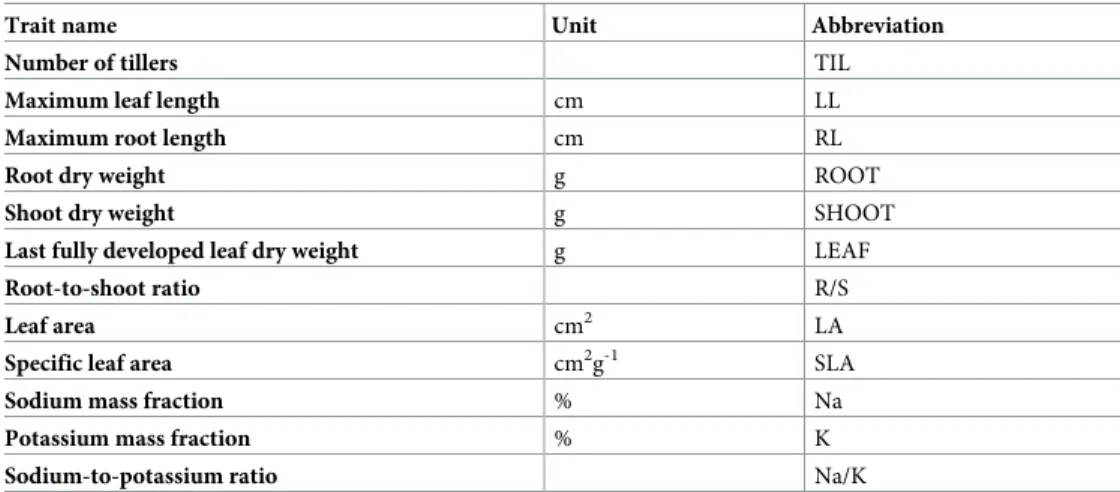
Traits evaluated. The effect of the stress on the plant growth rate was measured (Table 1). For each plant, the number of tillers (TIL) was counted. The lengths of the longest leaf (LL) and the longest root (RL) were measured. The blade of the last fully developed leaf was col-lected, and its length (LGTH) and width (WDTH) were measured. The area of the blade of the last fully developed leaf (LA) was determined as LGTH x WIDTH x 0.75 based on Yoshida’s formula [51]. The shoots and roots of each plant were separated and the shoots, roots and last fully developed leaves were oven dried at 72˚C for 4 days, after which the dry matter was weighed (SHOOT, ROOT and LEAF). The specific leaf area (SLA) was calculated by dividing LA by LEAF. The root-to-shoot ratio (R/S) was calculated by dividing ROOT by SHOOT.
Table 1. Recorded traits with their abbreviations.
Trait name Unit Abbreviation
Number of tillers TIL
Maximum leaf length cm LL
Maximum root length cm RL
Root dry weight g ROOT
Shoot dry weight g SHOOT
Last fully developed leaf dry weight g LEAF
Root-to-shoot ratio R/S
Leaf area cm2 LA
Specific leaf area cm2g-1 SLA
Sodium mass fraction % Na
Potassium mass fraction % K
Sodium-to-potassium ratio Na/K
The whole shoot dry mass of the stressed set of accessions was cut into small pieces and sub-sequently ground to a powder using a mechanical grinder (one 5 mm-diameter bead per tube; 2 times for 1 min at 1400 rpm). Then, the Na and K mass fractions (Na and K), expressed as a percent of dry matter, were measured for each sample by atomic emission spectroscopy (ICP-AES). The analyses were conducted at the UR59 laboratory in Cirad Montpellier, France (ISO 9001). The Na/K ratio was calculated by division. In addition, several check plants from the unsalted treatment (3 plants of Nona Bokra and 3 plants of IR29 for each replicate) were treated in the same manner. The data are available inS1 Table.
Statistical analyses
Analysis of variance was conducted on the growth parameters using a mixed model with treat-ment and genotype as fixed effects, and replicate and tank as random effects. The significance of genotype, treatment and genotype x treatment interaction effects were tested. The least square (LS) mean values were calculated and adjusted from the tank effect. For each measured growth trait, considering intrinsic differences in growth rate between accessions, indices of response to stress were calculated based on the LS mean values as iTRAIT = (SALT—CTRL) x 100 / CTRL. Such indices can be strongly affected by the poor growth of some control plants. A Grubbs’ test (P < 0.05) was therefore conducted to remove the outliers using XLStat [52]. For the ions measured only under stressed conditions, the analysis of variance was conducted without treatment effects. Broad-sense heritabilities at the genotypic mean level were calcu-lated for each condition and trait by running a separate analysis of variance without treatment effects with h2=σ2G/(σ2G+σ2e/n), whereσ2G andσ2e are the estimates of genetic and residual variances, respectively, derived from the expected mean squares of the analysis of variance and n is the number of replicates. The heritabilities of the indices were obtained in the same man-ner after computing the indices for each replicate. Since some of the measured traits were cor-related, a principal component analysis (PCA) was conducted on all traits using XLStat.
Genome-wide association study
A GWAS was conducted on the 231 japonica accessions in the panel having both phenotypic and genotypic data using two different methods, termed the “classical method” and the “inter-action method”. For the classical method, the GWAS analyses were conducted using a mixed linear model (MLM) with control of panel sub-structure (fixed effect) and kinship among accessions (random effect) using Tassel v5 [53]. The coordinates of the accessions in the two first axes of a PCA conducted on the genotyping data were used to control the population structure. The number of axes was set to two because previous results from an analysis of pop-ulation structure showed that the main differentiation among European accessions was observed between temperate and tropical-derived accessions [42]. The kinship matrix was cal-culated using the centered identity by state method, which provides a matrix equivalent to the VanRaden matrix. As described by Courtois et al. [45], a comparison was first conducted between models with kinship alone and kinship and structure using the Akaike information criterion (AIC). The AIC was calculated as -2 ln(L) + 2k, where ln is the natural logarithm, L is the maximized value of the likelihood function for the estimate model and k is the number of estimated parameters [54]. This comparison showed that the second model best fit the data (S2 TableandS3 Fig) and this model was adopted for further analyses. To determine signifi-cance and ensure the robustness of the detected associations, a sub-sampling procedure was conducted, according to Tian et al. [55] (maize), and Lafarge et al. [56] and Bettembourg et al [57] (rice). A set of 200 accessions (approximately 80% of the panel size) was selected at ran-dom without replacement and a GWAS was conducted on this set. The ranran-dom sub-sampling
and GWAS analysis were repeated 100 times. The number of times an association was detected at P < 0.001 in the 100 sub-samples was counted to obtain a sub-sampling posterior probabil-ity for each marker. Based on the distribution of the results, a threshold that had a 95% chance not to be overtaken was selected separately for each trait. The significances reported in the result table for a given marker are those from the GWAS analysis conducted on the entire panel. Markers that were significant within an interval of less than 100 kb were considered to belong to the same QTL. This window size was selected because it was intermediate between the average marker distance (approximately 12 kb in the GBS dataset) and the distance at which the linkage disequilibrium (LD) decayed to half its initial level (estimated at 400 kb in the panel on average across all chromosomes but much more variable in short-range seg-ments). Quantile-quantile (QQ) plots and Manhattan plots were obtained from Tassel or drawn using the qqman R package.
For traits measured both under control and salt conditions, the interaction method, described in detail in Al-Tamimi et al. [33], was also used. The interaction MLM model includes the main effects of the marker and treatment (control and salt, respectively) and marker x treatment interaction, using the same PCA coordinates and kinship matrix obtained from Tassel. This approach enables the identification of SNPs significant for the marker x treatment term and therefore, the identification of loci that respond to salinity treatment. The scripts from Al-Tamini et al. [33] required ASReml-R [58], a proprietary package for the R environment [59]. In this second case, sub-sampling was not attempted because of the time necessary for analyses with ASReml. A false discovery rate (FDR) of 0.05 was used for deter-mining the significance for all traits [60].
In both cases, once a first list of significant markers was established, an LD matrix among these markers was calculated using Tassel, and pairs of close markers with an r2value above 0.8 and similar MAFs were pooled in the same interval.
Candidate genes
A list of genes shown to play a role in salt tolerance in rice, referred to as salt tolerance genes, with their identifiers in the two rice gene nomenclatures, physical, position, annotation, func-tion relative to salt stress (when known) and digital object identifier (DOI) of the reference paper(s) was established based on an update of previous lists established by Negrao et al. [13], Kumar et al. [34] and the OGRO database (http://qtaro.abr.affrc.go.jp/ogro). The gene posi-tions and annotaposi-tions were obtained from Michigan State University (http://rice.plantbiology. msu.edu/), release 7. This list of approximately 300 genes (S2 Table) was used to assess whether the association positions were close to known genes. In addition, all genes with an annotated function in a window of +/-100 kb around the significant markers, or in the interval between two positions when its size was above 200 kb, were extracted using OrygenesDB tools (http:// orygenesdb.cirad.fr/), and their annotations were also explored using key words to assess whether these genes had a plausible relationship with salinity tolerance. The geneHKT1;5
(Os01g20160), located in the center of the Saltol QTL, has a recognized importance in salinity
tolerance in rice [14]. To assess the diversity of this gene among temperate accessions, a haplo-type analysis of the gene was conducted using the sequences ofHKT1;5 from accessions of the
3,000 rice genomes project [61]. The analyzed set comprised the 57 European accessions com-mon to both our panel and the 3,000 genomes project (18 classified as "japx", 30 as "temp" and 9 as "trop" in the IRIC database (http://oryzasnp.org/iric-portal/), with the term "GERVEX" included in their IRGC-ID; listed inS1 Table), 536 random accessions from the 3,000 genomes project, and seven accessions mentioned by Platten et al. [14] as references for the various hap-lotypes (IR64, Pusa basmati, Pokkali, Nona Bokra, FL478, Nipponbare and Azucena) with
known salinity tolerance levels. For these 600 accessions, the sequences involving 76 polymor-phic SNPs were extracted from the IRIC database. An unweighted neighbor-joining tree was built using a simple matching index.
Results
Response to salinity
After 28 days of growth with two weeks of salinity stress at a conductivity of 6.0 dS.m-1, the hydroponic experiment was harvested. Lethality affected 4.8% of the control plants and 8.0% of the stressed plants with similar proportions in all replicates, indicating a slight increase in mortality due to salt treatment. However, approximately two-thirds of the plants that died were recorded as having poor germination or were scored as being weak prior to treatment (63.4% for the control plants and 64.7% for the stressed plants).
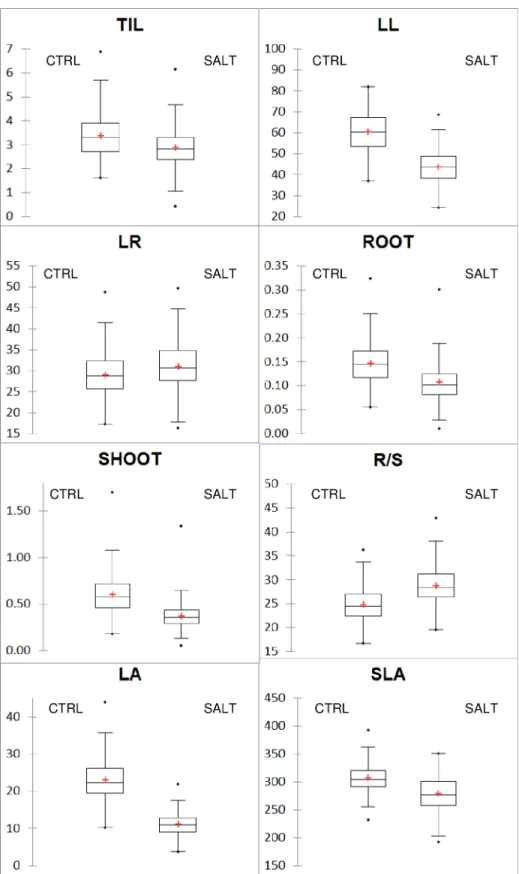
The ANOVA results showed highly significant treatment and genotype effects and highly significant genotype x treatment interactions for all growth traits except TIL (Table 2). The sig-nificant interactions indicated that the accessions responded differently to the salinity treat-ment and that variability in tolerance levels existed among the tested accessions. On average, the salinity treatment negatively affected all growth traits, except RL and R/S, which were positively affected (Table 3;Fig 1). LA (-51.2%) and SHOOT (-36.5%) were the traits most impacted by salinity stress, followed by LL (-27.0%) and ROOT (-25.7%). Significant differ-ences between accessions were also observed for Na+and K+leaf mass fractions and the Na/K ratio (Table 2). Based on the results of the two extreme checks (Nona Bokra and IR29) in which the ion mass fractions were measured under both control and stressed conditions, the mean increase in Na+leaf content varied from 400% (Nona Bokra) to 2000% (IR29), while the mean decrease in K+leaf content varied only from 35% (Nona Bokra) to 56% (IR29). As shown inFig 2, which is based on the Na/K ratio, the temperate accessions were regularly dis-tributed over an increasing axis from Nona Bokra, Pokkali and BRRI Dhan 47, the most resis-tant checks with the lowest Na/K ratio (in orange inFig 2), to Aychade, Giano and IR29, the most susceptible checks with the highest Na/K ratio (in green inFig 2). No accession was more tolerant than Nona Bokra under the selected stress conditions, but certain accessions, such as Victoria or Rotundus, were close. A few accessions, such as Santerno or YRM6-2, were more susceptible than IR29. When the checks were excluded, the range of variation in the panel was
Table 2. Probabilities of the effects tested by ANOVA for the different traits.
Trait TT Genotype TT x Genotype
TIL 0.0002 < 0.0001 0.1195 LL < 0.0001 < 0.0001 < 0.0001 RL < 0.0001 < 0.0001 < 0.0001 ROOT < 0.0001 < 0.0001 0.0010 SHOOT < 0.0001 < 0.0001 < 0.0001 R/S < 0.0001 < 0.0001 < 0.0001 LA < 0.0001 < 0.0001 < 0.0001 SLA < 0.0001 < 0.0001 0.0043 Na < 0.0001 K < 0.0001 Na/K < 0.0001 TT: treatment https://doi.org/10.1371/journal.pone.0190964.t002
from 0.240% to 1.387% (6-fold difference) for Na, 1.461% to 3.111% for K (2-fold difference) and 0.095 to 0.819 (9-fold difference) for Na/K.
The heritabilities of the different traits were moderate to high (0.49 to 0.92) when calculated for each treatment, and for a given trait, the heritabilities were of the same magnitude for both treatments (Table 4). However, the response indices registered much lower heritabilities (0.12 to 0.55). This characteristic translated to the lowest reliability of indices due to propagation of uncertainty in functions involving several variables, and this effect occurred even after remov-ing potential outliers with abnormal growth patterns usremov-ing a Grubbs’ test.
The correlations among indices of growth response to stress were generally high and posi-tive (0.24 to 0.91), except for correlations with iSLA (all negaposi-tive) and iR/S. The correlation between Na and K was intermediate and negative (-0.39). The correlations between indices of growth response and the Na/K ratio were low and negative; these correlations were significant (-0.23< r <-0.14) for iLL, iROOT, iSHOOT, and iLA, and not significant for iTIL, iR/S and iSLA (S1 Fig), indicating that the phenomena involved in growth response and ion accumula-tion may be somewhat different. To assess whether the diluaccumula-tion factor played a role in the salinity tolerance of the panel, the correlations between ion-related traits and shoot biomass of the control treatment were calculated; however, the correlations were close to 0 and were not significant. These trends were confirmed by the results of a PCA conducted on the 11 vari-ables. The first two axes explained 57.6% of the variation. The indices of stress response were the main contributors to axis 1, while the ion mass fractions were the main contributors to axis 2 (S2 Fig).
Genome-wide associations
The indica checks were excluded from further analyses, and GWAS analyses were conducted on the 231 accessions that had genotypic data. The eight stress response indices and the three ion parameters were analyzed. The results of the analyses are presented inTable 5for the clas-sical method andTable 6for the interaction method. In this narrow genetic base-panel, LD slowly decays. To assess whether the markers, consecutive or not, corresponded to different QTLs, the LD between significant markers was calculated for both methods (S3 Table). No long range or cross-chromosome correlations between significant markers were observed. However, in a few cases, close markers with similar MAFs were found in strong LD (r2above
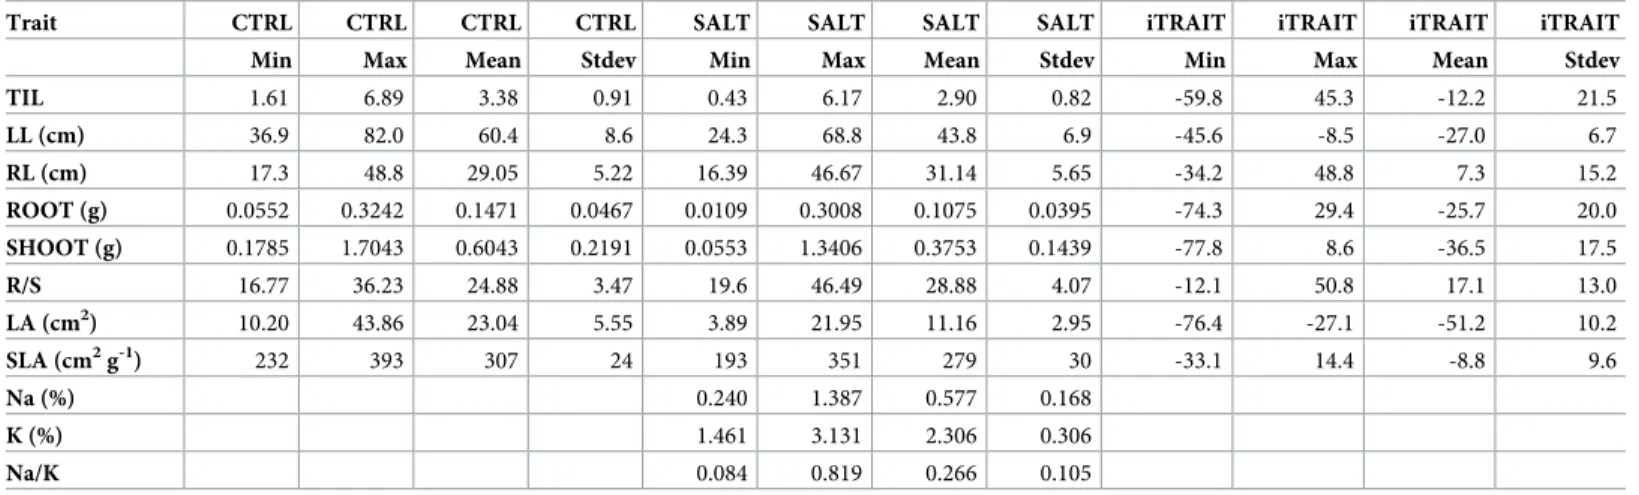
Table 3. Statistical parameters for all traits in the control (CTRL) and salinity (SALT) treatments and for the indices of stress response.
Trait CTRL CTRL CTRL CTRL SALT SALT SALT SALT iTRAIT iTRAIT iTRAIT iTRAIT Min Max Mean Stdev Min Max Mean Stdev Min Max Mean Stdev
TIL 1.61 6.89 3.38 0.91 0.43 6.17 2.90 0.82 -59.8 45.3 -12.2 21.5 LL (cm) 36.9 82.0 60.4 8.6 24.3 68.8 43.8 6.9 -45.6 -8.5 -27.0 6.7 RL (cm) 17.3 48.8 29.05 5.22 16.39 46.67 31.14 5.65 -34.2 48.8 7.3 15.2 ROOT (g) 0.0552 0.3242 0.1471 0.0467 0.0109 0.3008 0.1075 0.0395 -74.3 29.4 -25.7 20.0 SHOOT (g) 0.1785 1.7043 0.6043 0.2191 0.0553 1.3406 0.3753 0.1439 -77.8 8.6 -36.5 17.5 R/S 16.77 36.23 24.88 3.47 19.6 46.49 28.88 4.07 -12.1 50.8 17.1 13.0 LA (cm2) 10.20 43.86 23.04 5.55 3.89 21.95 11.16 2.95 -76.4 -27.1 -51.2 10.2 SLA (cm2g-1) 232 393 307 24 193 351 279 30 -33.1 14.4 -8.8 9.6 Na (%) 0.240 1.387 0.577 0.168 K (%) 1.461 3.131 2.306 0.306 Na/K 0.084 0.819 0.266 0.105
Min: minimum; Max: maximum; Stdev: standard deviation; iTRAIT = (SALT-CTRL) x 100 / CTRL
Fig 1. Box-plots of the two treatments for the nine growth traits. CTRL: control treatment; SALT: salt treatment;
TIL: number of tillers; LL: maximum leaf length; RL: maximum root length, ROOT: root biomass; SHOOT: shoot biomass; R/S: root-to-shoot ratio; LA: leaf area; and SLA: specific leaf area.
0.8) and grouped in the same interval. The limits of these intervals, which exceptionally exceeded 500 kb, are indicated in Tables5and6.
Fig 2. Distribution of the Na/K ratio among the tested accessions. In orange, tolerant checks; in green, susceptible
checks; and in blue, temperate japonica accessions.
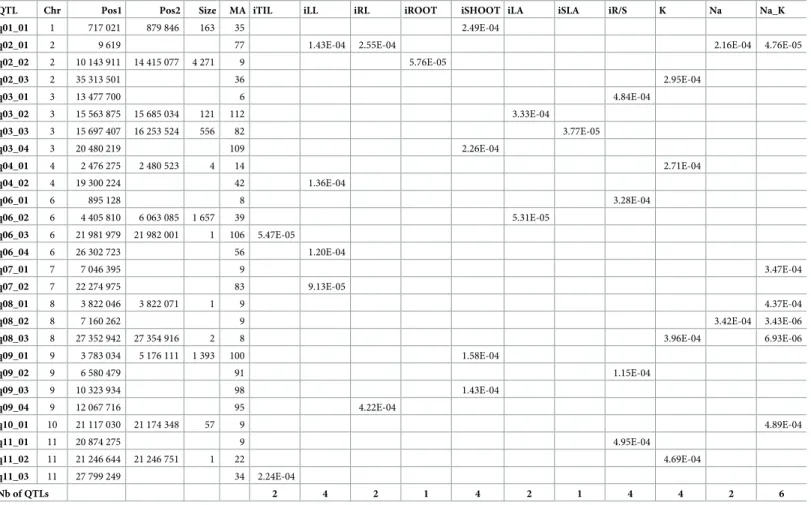
For the classical method, a total of 27 independent significant associations validated by sub-sampling were identified, with the number per trait varying from 1 to 6. Fewer associations were generally detected for the indices of stress response than for the ion concentrations, which is likely due to the lower heritability of the indices than that of the directly measured parameters. The significance was generally moderate (P > 1.0E-06). One association was com-mon between four traits (iLL, iRL, Na and Na/K), and two others associations were comcom-mon between two traits (Na and Na/K and K and Na/K). The Manhattan plots corresponding to the ions traits are presented inFig 3and those for the indices of response are presented inS4 Fig.
For the interaction method (Fig 4), a total of 50 significant associations corresponding to qvalues below 0.05 were identified with the number per trait varying from 0 (no QTL detected for LL and R/S) to 15; this range is larger than the range described for the classical method. The significance was also much higher (up to P = 1E-09). More associations were common between traits (four between two traits and five between three traits). These common associa-tions were primarily found between highly correlated traits. Three associaassocia-tions (q01_01, q06_02, and q06_03,) were detected using both methods, among which two associations were detected for the same traits in both methods (q06_02 and q06_03).
The positions of all significant markers were compared to those of the salt tolerance genes listed inS2 Table(Fig 5for chromosomes 1 to 6 andFig 6for chromosomes 7 to 12). A salt tol-erance gene was found in the vicinity (< 100 kb) of 23 of the significant markers (13 markers for the classical method and 10 markers for the interaction method). The list includes several ion transporters, notably a sodium transporter (OsHKT1;2), and several genes involved in
Ca2+signaling or metabolism, including several protein kinases (Table 7). Based on a key word search, the exploration of 1676 genes with tentative functions found in the same intervals (S4 Table) enabled the identification of 84 additional candidates (highlighted in blue inS3 Table). These candidates included 14 antioxidants, 31 transporters, 15 phosphatases, 5 cal-cium/calmodulin binding proteins, 3 LEA and 3 aquaporins. The remaining candidates were the sole representatives in their broad functional classes.
No associations near the Saltol QTL, located between 10.8 and 11.8 Mb on chromosome 1 and centered on theHKT1;5 gene [36], were significant. The analysis ofHKT1;5
polymor-phisms of the 57 European temperate accessions in the present panel that were also included in the 3,000 genomes project database showed that the temperate accessions carried haplotypes belonging to closely related branches of the tree. All haplotypes belonged to clusters in which the reference accession did not carry tolerance alleles for this gene (S5 Fig). It is therefore likely
Table 4. Broad-sense heritabilities for the different traits in the different treatments.
Trait CTRL SALT Index
TIL 0.73 0.75 0.12 LL 0.89 0.92 0.55 RL 0.79 0.81 0.37 ROOT 0.79 0.87 0.38 SHOOT 0.83 0.91 0.36 R/S 0.82 0.85 0.52 LA 0.79 0.81 0.38 SLA 0.50 0.49 0.26 Na 0.53 K 0.72 Na/K 0.61 https://doi.org/10.1371/journal.pone.0190964.t004
that there is no significant association in this zone because no temperate accession carries
HKT1;5 tolerant haplotypes.
Discussion
We conducted hydroponic experiments to determine the response of a panel of temperate japonica accessions to mild salinity stress. A mild level of stress (6 dS m-1) was selected because of its relevance to observed field conditions in Europe. This mild stress decreased plant growth without inducing lethality, consistent with the results of Ahmadi et al. [30]. The results showed the expected range of variation among the checks; the well-known tolerant lines had the lowest Na/K ratios and the susceptible checks had the highest ratios. The diversity of the panel was evenly distributed between the extreme checks, indicating that some European accessions car-ried alleles of salinity tolerance that were efficient in situations of mild stress. Although only a mild stress and a single late time point were used, this ranking is useful information for breed-ers. As shown by Campbell et al. [31] and Al-Tamimi et al. [33], high-throughput image-based phenomics platforms enabling longitudinal assessment might offer a more comprehensive view of the evolution of the response of rice to salt stress over time in further experiments.
Table 5. Significant markers in the GWAS using the classical method.
QTL Chr Pos1 Pos2 Size MA iTIL iLL iRL iROOT iSHOOT iLA iSLA iR/S K Na Na_K
q01_01 1 717 021 879 846 163 35 2.49E-04
q02_01 2 9 619 77 1.43E-04 2.55E-04 2.16E-04 4.76E-05
q02_02 2 10 143 911 14 415 077 4 271 9 5.76E-05 q02_03 2 35 313 501 36 2.95E-04 q03_01 3 13 477 700 6 4.84E-04 q03_02 3 15 563 875 15 685 034 121 112 3.33E-04 q03_03 3 15 697 407 16 253 524 556 82 3.77E-05 q03_04 3 20 480 219 109 2.26E-04 q04_01 4 2 476 275 2 480 523 4 14 2.71E-04 q04_02 4 19 300 224 42 1.36E-04 q06_01 6 895 128 8 3.28E-04 q06_02 6 4 405 810 6 063 085 1 657 39 5.31E-05 q06_03 6 21 981 979 21 982 001 1 106 5.47E-05 q06_04 6 26 302 723 56 1.20E-04 q07_01 7 7 046 395 9 3.47E-04 q07_02 7 22 274 975 83 9.13E-05 q08_01 8 3 822 046 3 822 071 1 9 4.37E-04 q08_02 8 7 160 262 9 3.42E-04 3.43E-06 q08_03 8 27 352 942 27 354 916 2 8 3.96E-04 6.93E-06 q09_01 9 3 783 034 5 176 111 1 393 100 1.58E-04 q09_02 9 6 580 479 91 1.15E-04 q09_03 9 10 323 934 98 1.43E-04 q09_04 9 12 067 716 95 4.22E-04 q10_01 10 21 117 030 21 174 348 57 9 4.89E-04 q11_01 11 20 874 275 9 4.95E-04 q11_02 11 21 246 644 21 246 751 1 22 4.69E-04 q11_03 11 27 799 249 34 2.24E-04 Nb of QTLs 2 4 2 1 4 2 1 4 4 2 6
Chr: chromosome; Pos1-Pos2: limits (bp) of the interval with a LD>0.8; Size: size of the interval in kb; MA: number of accessions carrying the minor allele; iTIL: relative number of tillers; iLL: relative maximum leaf length; iRL: relative maximum root length, iROOT: relative root biomass; iSHOOT: relative shoot biomass; iLA: relative leaf area; iSLA: relative specific leaf area; and iR/S: relative root-to-shoot ratio.
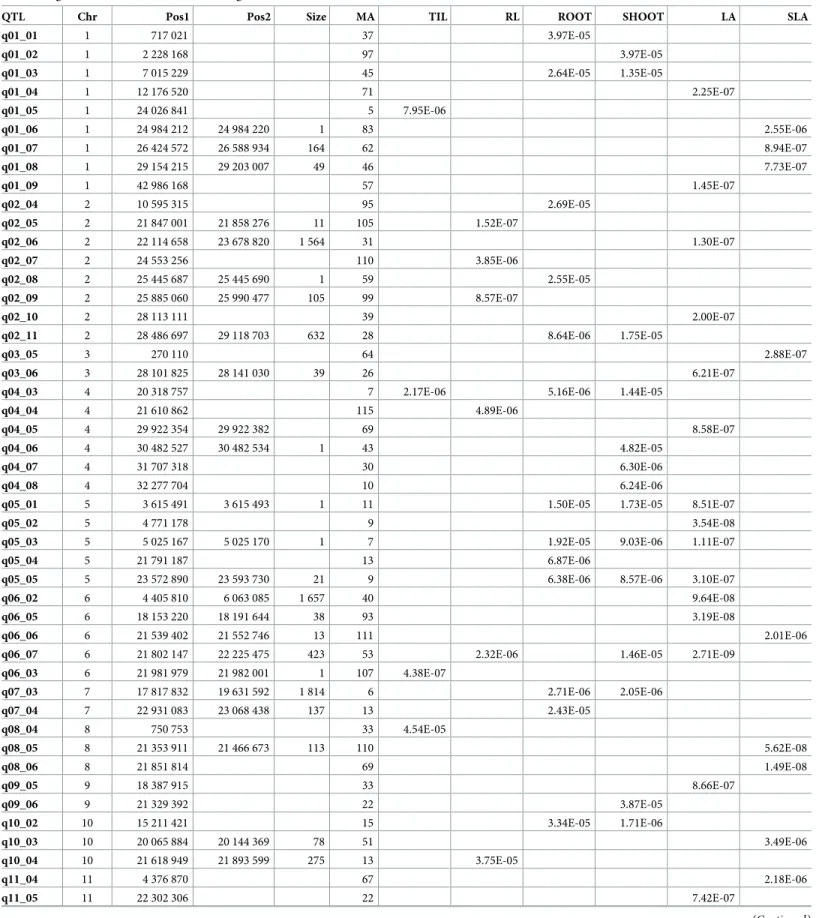
Table 6. Significant markers in the GWAS using the interaction method.
QTL Chr Pos1 Pos2 Size MA TIL RL ROOT SHOOT LA SLA
q01_01 1 717 021 37 3.97E-05 q01_02 1 2 228 168 97 3.97E-05 q01_03 1 7 015 229 45 2.64E-05 1.35E-05 q01_04 1 12 176 520 71 2.25E-07 q01_05 1 24 026 841 5 7.95E-06 q01_06 1 24 984 212 24 984 220 1 83 2.55E-06 q01_07 1 26 424 572 26 588 934 164 62 8.94E-07 q01_08 1 29 154 215 29 203 007 49 46 7.73E-07 q01_09 1 42 986 168 57 1.45E-07 q02_04 2 10 595 315 95 2.69E-05 q02_05 2 21 847 001 21 858 276 11 105 1.52E-07 q02_06 2 22 114 658 23 678 820 1 564 31 1.30E-07 q02_07 2 24 553 256 110 3.85E-06 q02_08 2 25 445 687 25 445 690 1 59 2.55E-05 q02_09 2 25 885 060 25 990 477 105 99 8.57E-07 q02_10 2 28 113 111 39 2.00E-07 q02_11 2 28 486 697 29 118 703 632 28 8.64E-06 1.75E-05 q03_05 3 270 110 64 2.88E-07 q03_06 3 28 101 825 28 141 030 39 26 6.21E-07
q04_03 4 20 318 757 7 2.17E-06 5.16E-06 1.44E-05
q04_04 4 21 610 862 115 4.89E-06
q04_05 4 29 922 354 29 922 382 69 8.58E-07
q04_06 4 30 482 527 30 482 534 1 43 4.82E-05
q04_07 4 31 707 318 30 6.30E-06
q04_08 4 32 277 704 10 6.24E-06
q05_01 5 3 615 491 3 615 493 1 11 1.50E-05 1.73E-05 8.51E-07
q05_02 5 4 771 178 9 3.54E-08
q05_03 5 5 025 167 5 025 170 1 7 1.92E-05 9.03E-06 1.11E-07
q05_04 5 21 791 187 13 6.87E-06
q05_05 5 23 572 890 23 593 730 21 9 6.38E-06 8.57E-06 3.10E-07
q06_02 6 4 405 810 6 063 085 1 657 40 9.64E-08
q06_05 6 18 153 220 18 191 644 38 93 3.19E-08
q06_06 6 21 539 402 21 552 746 13 111 2.01E-06
q06_07 6 21 802 147 22 225 475 423 53 2.32E-06 1.46E-05 2.71E-09
q06_03 6 21 981 979 21 982 001 1 107 4.38E-07 q07_03 7 17 817 832 19 631 592 1 814 6 2.71E-06 2.05E-06 q07_04 7 22 931 083 23 068 438 137 13 2.43E-05 q08_04 8 750 753 33 4.54E-05 q08_05 8 21 353 911 21 466 673 113 110 5.62E-08 q08_06 8 21 851 814 69 1.49E-08 q09_05 9 18 387 915 33 8.66E-07 q09_06 9 21 329 392 22 3.87E-05 q10_02 10 15 211 421 15 3.34E-05 1.71E-06 q10_03 10 20 065 884 20 144 369 78 51 3.49E-06 q10_04 10 21 618 949 21 893 599 275 13 3.75E-05 q11_04 11 4 376 870 67 2.18E-06 q11_05 11 22 302 306 22 7.42E-07 (Continued )
The GWAS enabled the detection of a set of distinct loci significantly associated with either salinity response indices or Na+or K+mass fractions. Based on our experience in comparing different GWAS approaches in previous datasets, GWASs appear sensitive to small variations in the model (e.g., differences in the number of PCA axes to control the population structure) or in the proposed analysis method for improving the computation speed (e.g., the exact method versus a method that does not involve re-estimating variances for each marker). Small methodological changes translate into different significant associations, although certain asso-ciations are generally common between analyses, as observed in maize [62]. The best compro-mise between computational speed, statistical power and the number of false positives is often challenging to determine for data that are not simulated. Therefore, to best explore the present dataset, we used two different approaches to GWAS analyses, a classical mixed model control-ling population structure and kinship [63], and an interaction model advocated by Al-Tamimi et al. [33] for situations, such as in the present study, in which two treatments (stress and con-trol) are compared. For the classical method, which is much less computationally intensive than the interaction method, we attempted a sub-sampling method to explore the robustness of the associations as performed by Tian et al. [55] on maize and Lafarge et al. [56] on rice. Sub-sam-pling was preferred over bootstrapping because of the existence of a panel structure and the sim-plicity of file preparation, as a given accession was not repeated several times. Sub-sampling was used to assess the effect of minor variations in MAF in the different samples and, to a lesser extent, examine the effect of population structure. Subsampling enabled us to discard associa-tions that were detected in only in a few samples and occasionally detected in a single sample and had a high probability of being artifacts. Although sub-sampling is a satisfactory method to test the robustness of the detected associations, the time necessary for such computations and subsequent exploitation of the results did not allow the use of more than 100 sub-samples. With the development of appropriate tools, a higher number of samples (500 to 1000) might become manageable, leading to even stronger confidence in the sub-sampling outcome.
We compared the results of the classical method to those of the interaction method that was designed to manage split-plot experiments. The interaction method identified associations with much lower P values than the classical method and a higher number of markers generally supported each peak, as also observed by Al- Tamini et al. [33]. However, although the interac-tion model involved the control of populainterac-tion structure and kinship using the same matrices as the classical model, the control of false positives was not as good with the interaction method as that observed with the classical method, indicating that part of the increased power is likely obtained at the cost of an inflated rate of false discovery. In addition, the QTLs identi-fied by the interaction method were generally different from those identiidenti-fied using the classical method. Only three QTLs were in common, and these QTLs were not having the lowest P val-ues. This lack of consistency across methods may be partly due to the architecture of the traits
Table 6. (Continued)
QTL Chr Pos1 Pos2 Size MA TIL RL ROOT SHOOT LA SLA
q12_01 12 17 940 089 106 2.88E-05
q12_02 12 20 014 218 20 789 916 776 104 3.10E-07
q12_03 12 21 834 586 34 3.11E-07
Nb of QTLs 5 8 13 14 15 9
Chr: chromosome; Pos1-Pos2: limits (bp) of the interval with LD > 0.8; Size: size of the interval in kb; MA: number of accessions carrying the minor allele; TIL: number of tillers; LL: maximum leaf length; RL: maximum root length, ROOT: root biomass; SHOOT: shoot biomass; R/S: root-to-shoot ratio; LA: leaf area; and SLA: specific leaf area.
Fig 3. Manhattan plots for Na, K and Na/K using the classical GWAS method.
involving a large number of QTLs with small effects, which are borderline in terms of signifi-cance. Bian et al. [62] suggested this explanation for the poor correspondence among GWAS results in maize. The lack of consistency can also result from a lack of power in the present study design, although the panel size (230 individuals) is reasonably large for plants and the phenotypic variation within the panel is extensive.
Variations in the associations detected by different methods in the discovery phase imply a need to validate the detected associations, e.g., by replicating experiments with independent panels. However, in addition to the unavoidable GxE interactions in replicating any pheno-typic experiment, such replications with independent samples might be particularly difficult in a GWAS context because of the differences in structure, LD, MAF values and marker density
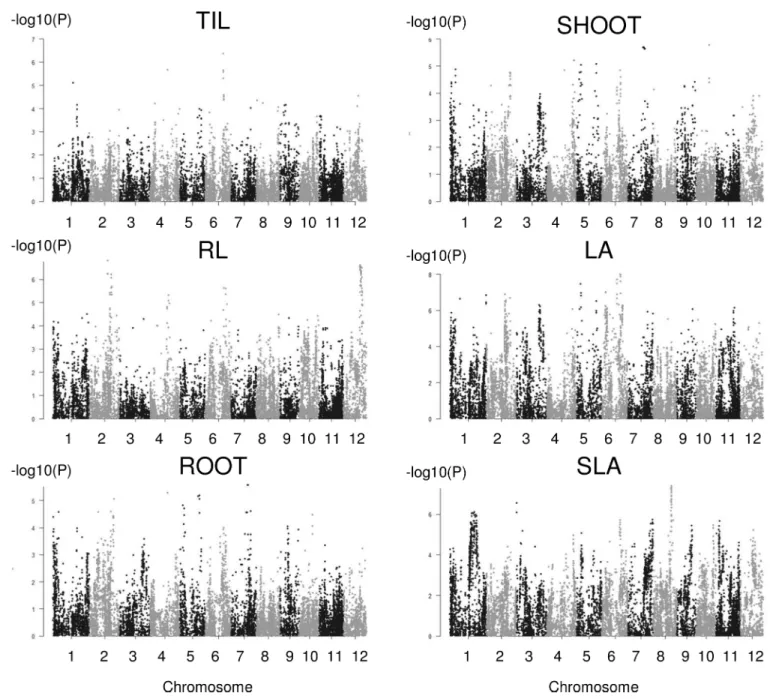
Fig 4. Manhattan plots for the six traits analyzed with the interaction method for which significant associations were detected.
between panels [64–65]. These differences can explain why it is challenging to obtain similar results in different GWAS. To strengthen the original evidence, other genetic methods based on gene-based haplotype analyses followed by genetic transformation [66] or on the develop-ment of bi-parental mapping populations from panel accessions with compledevelop-mentary haplo-types at significant clusters of markers as proposed by Phung et al. [67] might be better validation choices. However, because of the time and effort that these approaches require, they should be attempted only for the most promising cases. Functional genomic studies, notably
Fig 5. Map of the detected associations compared to the positions of genes involved in salinity tolerance in rice. Chromosomes 1 to 6.
gene expression studies, have also been used to provide evidence corroborating or invalidating the results of GWASs [68–69].
Some of the identified associations correspond to or are close to genes involved in salinity tolerance in rice (Table 7). More genes were involved in the response to ionic stress rather than osmotic stress, likely because the measured traits involve only late plant responses. Two genes (OsCBL7 and OsCBL8) belonged to the ionic stress signaling pathway involving calcium.
The signaling of ionic stress acts through the Ca2+/phospholipase C, salt overly sensitive and calmodulin pathways [34,70]. Genes related to signaling and the signal transduction of the same families were also detected by Al-Tamimi et al. [33] as an early stress response in a GWAS conducted on a panel with different genetic backgrounds (aus and indica). Salt stress induces cytosolic Ca2+spiking, which in turn activates Ca2+binding proteins, such as calmod-ulins (e.g.,OsCPK1 inTable 7). Two other kinases (e.g.,OsSAPK1 and Os07g44330) could also
play a role in ionic stress responses.
Seven genes inTable 7are ion transporters or transcription factors (TFs) that directly acti-vate such genes.HKT1;2 on chromosome 4 (a pseudogene in Nipponbare [71]), is a Na+/K+ symporter belonging to theHKT transporter family; the members of this family protect leaves Fig 6. Map of the detected associations compared to the positions of genes involved in salinity tolerance in rice. Chromosomes 7 to 12.
from Na+accumulation by removing Na+from the xylem sap [35]. Several genes were vacuolar antiporter exchange proteins, such as high-capacity cation/H+exchangers (OsCAX1 and OsCAX2), a Mg2+/H+exchanger (OsMXH2) or a high-affinity Ca2+-ATPase (OsACA6), that
play a role in intracellular Ca2+-mediated sodium ion homeostasis [72–73]. These genes indi-cate a preferential mechanism of salt tolerance through Ca2+selective accumulation in a tem-perate background. Zeng et al. [74] demonstrated that Na+-Ca2+selectivity was highly
correlated with yield under stress and suggested using this parameter as a selection criterion in screening. It may be worthwhile to quantify the Ca mass fraction in future studies involving temperate accessions.OsKAT1 is a highly selective inward-rectifying K+channel protein of the Shaker family, which also plays a role in cellular homeostasis [75]. TheOsKAT1 gene was
pres-ent in a highly significant cluster of SNPs detected in another GWAS conducted in a temperate japonica sub-panel [31]. One gene,OsPCF2, is a TF that binds to the promoter of OsNHX1,
which is itself a vacuolar K+-Na+/H+antiporter that plays role in Na+compartmentalization into vacuoles [70].
Four genes (OsNAC1, OsNTL6 (or ONAC070), OsNAC3, and OsNAC5) belong to the large
family of NAC (NAM, ATAF and CUC) or NAC-like TFs. Most of these genes are induced by salt stress and regulate salt-responsive genes through an ABA-dependent manner [76]. The role ofOsNTL6 and other membrane-bound TFs has been clarified [77]. Environmental changes trigger the release of the TF from the membrane to which it is anchored and, after
Table 7. List of salt tolerance genes located less than 100 kb from the significant markers. QTL Trait Chr. Start End Gene Symbol Distance Gene function
qi01_03 ROOT 1 6.922 6.923 Os01g12580 OsLEA5 92 kb Late embryogenesis abundant protein.
qi01_06 SLA 1 24.839 24.844 OsCPK1 95 kb Serine/threonine protein kinase with calmodulin-like domain. Calcium sensor.
qc02_02 iROOT 2 10.897 10.902 Os02g18690 OsBURP04 In Unknown function.
qc02_02 iROOT 2 11.018 11.016 Os02g18880 OsCBL7 In Calcium sensor interacting with CIPK serine-threonine protein kinases.
qc02_02 iROOT 2 11.060 11.058 Os02g18930 OsCBL8 In Calcium sensor interacting with CIPK serine-threonine protein kinases.
qc02_02 iROOT 2 12.432 12.449 Os02g21009 OsCAX1c In Sodium/calcium exchanger protein playing a role in intracellular Ca2+ion homeostasis.
qi02_06 LA 2 22.259 22.261 Os02g36880 OsNAC1 In NAC-type DNA-binding protein.
qi02_06 LA 2 22.333 22.338 Os02g36974 GF14E In Regulator of cellular signal transduction.
qi02_08 ROOT 2 25.431 25.433 Os02g42290 OsCLP3 12 kb ATP-dependent clp protease with established stress protective role.
qi02_09 RL 2 25.959 25.957 Os02g43110 OsMHX2 8 kb Role in intracellular Ca2+ion homeostasis.
qc02_03 K 2 35.303 35.307 Os02g57650 OsNTL6 10 kb Membrane bound NAC-type TF. Role in adaptation to osmotic stress.
qc03_02 iLA 3 15.632 15.628 Os03g27280 SAPK1 In Response to hyperosmotic stress.
qc03_03 iSLA 3 16.061 16.065 Os03g27960 OsCAX2 In Role in intracellular Ca2+ion homeostasis.
qc03_03 iSLA 3 16.167 16.164 Os03g28120 OsKAT1 In Potassium channel protein. Maintenance of cytosolic cation homeostasis.
qi04_06 SHOOT 4 30.548 30.546 Pseudogene OsHKT1;2 63 kb Na+transporter. Pseudogene in Nipponbare.
qi04_06 SHOOT 4 30.584 30.572 Os04g51610 OsACA6 90 kb Calcium-transporting ATPase, plasma membrane-type. Antioxidant.
qc06_02 iLA 6 5.677 5.682 Os06g10880 OsABF2 In Transcriptional regulator modulating expression of salt stress-responsive genes through an ABA-dependent pathway
qc07_01 Na//K 7 6.968 6.969 Os07g12340 OsNAC3 78 kb NAC-type TF.
qc07_02 iLL 7 22.223 22.222 Os07g37090 OSRIP18 51 kb Potential superoxide dismutase activity.
qc08_03 K, Na/K 8 27.298 27.296 Os08g43160 OsPCF2 55 kb TF regulating OsNHX1 expression.
qc08_03 K, Na/K 8 27.390 27.381 Os08g43334 OsHsfB2b 28 kb Heat shock factor.
qi09_05 LA 9 18.457 18.459 Os09g30320 OsBURP15 69 kb Unknown function.
qi11_04 SLA 11 4.302 4.299 Os11g08210 OsNAC5 75 kb NAC-type DNA-binding protein.
Chr.: chromosome; Start-End: Position of the gene in Mb; Distance: distance from the nearest significant marker. Gene symbols and functions refer to the gene list and functions shown inS2 Table.
translocating to the nucleus, this TF regulates the expression of genes involved in stress signal-ing and stress responses.
At least one gene is involved in the scavenging of oxygen reactive species (OsRIP18 with
superoxide dismutase activity).OsLEA5 is a late embryogenesis abundant protein. The LEA
genes accumulate during water stress, playing a protective role in cellular structures [17]. Two genes belong to theBURP family. Although BURP genes respond to salt stresses, their precise
function is unknown [13].GF14E, OsABF2, and OsHsfB2b, which are isolated members of
other families, either regulate or are regulated by salt stress but there is too little information to formulate hypotheses on the precise role of these genes. Among these genes,OsABF2 was
found near a QTL for survival days of seedlings in another GWAS with a japonica panel [12]. Although the list inS2 Tableincludes more than 300 genes, this list is certainly not exhaus-tive. Therefore, we also examined genes underlying the significant associations/intervals using keywords (S4 Table). Additional potentially interesting genes were observed, but functional evidence of their involvement in salinity response is lacking. Among the transporters,
Os06g36590 (a monovalent cation/proton antiporter-2 family), Os03g01330 (a
sodium/potas-sium/calcium exchanger-1),Os07g32530 (a potassium transporter) and Os01g50860 (a chloride
transporter), may be relevant. Several genes with antioxidant capacities were identified, and these genes could play a role in the protection of cellular components [13]. Several protein phosphatases, including a large cluster of serine/threonine phosphatases 2C were on the list. Protein phosphatases constitute a large family in rice, and are known to reverse the activity of protein kinases and play a functional role in ABA-mediated signaling pathways and stress responses [78]. Moreover, more than 70 receptor kinases and 80 other kinases were also on the list. Three aquaporins,OsNIP14;1, OsPIP2;7 and OsPIP1;3, were recorded. Aquaporins mediate
water transport across cellular membranes and play an important role in maintaining water homeostasis during salinity/osmotic stress [17]. ThreeLEA proteins were found in addition to OsLEA5 (see above).
The search for candidate genes was fruitful but should not be overvalued. The first limita-tion of this approach is that, in this panel, full LD (r2= 1.0) is often observed between remote points on the chromosomes (e.g., q02_2 or q09_01); therefore, the number of genes underlying these intervals is large, which increases the chances of finding candidates among the salt toler-ance genes. Second, regarding the larger list of genes (S4 Table), although some of the candi-date genes may be interesting, the functions attributed to these genes are often sufficiently vague that a plausible ex-post rationalization for their association with a trait is generally likely, which is particularly true for TFs and kinases because of their high frequency in the rice genome and large range of putative functions.
The Saltol QTL and the HKT1;5 gene that it carries affect the leaf Na+/K+ratio at the seed-ling stage while they are not among the segments/genes identified as significant in the present panel. The use of the 3,000 genomes project and the data from Platten et al. [14] enabled us to show that it is likely that none or only a few of the temperate accessions carry a favorable allele at the QTL. Since the panel accessions show a large range of salinity tolerance, it is therefore likely that different mechanisms/genes were selected among the temperate accessions. This result also indicates that some progress in the salinity tolerance of the temperate accessions might be obtained by introgressing Saltol into the temperate background, as attempted in the Neurice project (http://neurice.eu/).
Conclusion
The present study provides information on the salinity tolerance of commonly used accessions in European breeding programs. Through comparisons between GWAS models, the present
study provides an idea of the variations in the associations detected by different models and highlights the interest of re-sampling methods in this context. These results emphasize the need to validate putative QTLs and candidate genes by other approaches. However, because of the importance of the associations linked to calcium-mediated ion homeostasis-related genes, the present study also gives interesting clues on which pathways are a priority to explore to obtain a better understanding of the mechanisms of salinity tolerance of temperate rice.
Supporting information
S1 Table. List of accessions in the panel and their phenotypic data registered in the hydro-ponic experiment.
(XLSX)
S2 Table. Comparison of models with kinship alone (MLM1) and kinship and structure (MLM2) using the AIC.
(DOCX)
S3 Table. List of genes involved in salinity tolerance in rice. (XLSX)
S4 Table. Matrices of LD (r2) among significant markers using classical/interaction meth-ods.
(XLSX)
S5 Table. List of all genes with annotated functions surrounding the significant markers/ intervals (100 kb).
(XLSX)
S1 Fig. Phenotypic correlation among indices of stress response. iTIL: relative number of til-lers; iLL: relative maximum leaf length; iRL: relative maximum root length, iROOT: relative root dry weight; iSHOOT: relative shoot dry weight; iR/S: relative root-to-shoot ratio; iLA: rel-ative leaf area; and iSLA: relrel-ative specific leaf area.
(PDF)
S2 Fig. PCA on the indices of stress response and ion parameters. (PDF)
S3 Fig. QQ plots for the two tested models. A. Model with kinship alone. B. Model with structure and kinship.
(PPTX)
S4 Fig. Manhattan plots for the 8 growth traits analyzed with the conventional method. iTIL: relative number of tillers; iLL: relative maximum leaf length; iRL: relative maximum root length, iROOT: relative root dry weight; iSHOOT: relative shoot dry weight; iR/S: relative root-to-shoot ratio; iLA: relative leaf area; and iSLA: relative specific leaf area.
(PPTX)
S5 Fig. NJ tree based on the sequences of theHKT1;5 gene.
(PDF)
Acknowledgments
Author Contributions
Conceptualization: Julien Frouin, Antoine Languillaume, Justine Mas, Delphine Mieulet, Bri-gitte Courtois.
Data curation: Julien Frouin, Brigitte Courtois. Formal analysis: Nourollah Ahmadi, Brigitte Courtois. Funding acquisition: Nourollah Ahmadi, Brigitte Courtois.
Investigation: Antoine Languillaume, Justine Mas, Mathilde Bettembourg, Charlotte Bureau, Eve Lorenzini, Muriel Portefaix, Patricia Turquay, Aurore Vernet, Christophe Pe´rin, Bri-gitte Courtois.
Methodology: Julien Frouin, Antoine Languillaume, Justine Mas, Delphine Mieulet, Brigitte Courtois.
Project administration: Brigitte Courtois.
Resources: Arnaud Boisnard, Axel Labeyrie, Brigitte Courtois. Software: Julien Frouin.
Supervision: Christophe Pe´rin, Nourollah Ahmadi, Brigitte Courtois. Visualization: Delphine Mieulet, Brigitte Courtois.
Writing – original draft: Julien Frouin, Brigitte Courtois.
Writing – review & editing: Julien Frouin, Antoine Languillaume, Justine Mas, Delphine Mieulet, Arnaud Boisnard, Axel Labeyrie, Mathilde Bettembourg, Charlotte Bureau, Eve Lorenzini, Muriel Portefaix, Patricia Turquay, Aurore Vernet, Christophe Pe´rin, Nourollah Ahmadi, Brigitte Courtois.
References
1. FAOSTAT [Accessed 30/01/2017]. Available from:http://www.fao.org/faostat/en/#data
2. Ciais P, Reichstein M, Viovy N, Granier A, Oge´e J, Allard V, et al. Europe-wide reduction in primary pro-ductivity caused by the heat and drought in 2003. Nature. 2005; 437: 529–533.https://doi.org/10.1038/ nature03972PMID:16177786
3. Olesen JE, Trnka M, Kersebaum KC, Skjelvag AO, Seguin B, Peltonen-Saino P, et al. Impacts and adaptation of European crop production systems to climate change. Europ J Agronomy. 2012; 34: 96– 112.
4. Daliakopoulos IN, Tsanis IK, Koutroulis A, Kourgialas NN, Varouchakis AE, Karatzas GP, et al. The threat of soil salinity: A European scale review. Science of the Total Environment. 2016; 573: 727–739.
https://doi.org/10.1016/j.scitotenv.2016.08.177PMID:27591523
5. Price AH, Norton GJ, Salt DE, Ebenhoeh O, Meharg AA, Meharg C, et al. Alternate wetting and drying irrigation for rice in Bangladesh: is it sustainable and has plant breeding something to offer? Food and Energy Security. 2013; 2(2): 120–129.
6. Linquist BA, Anders MM, Adviento-Borbe MAA, Chaney RL, Nalley LL, Da Rosa EFF et al. Reducing greenhouse gas emissions, water use and grain arsenic levels in rice -systems. Global Change Biology. 2014; 21(1): 407–417.https://doi.org/10.1111/gcb.12701PMID:25099317
7. Lampayan RM, Rejesu RM, Singleton GR, Buman BAM. Adoption and economics of alternate wetting and drying water management for irrigated lowland rice. Field Crop Research. 2015; 170: 95–108.
8. Lekakis E, Aschonitis V, Pavlatou-Ve A, Papadopoulos A, Antonopoulos V. Analysis of temporal varia-tion of soil salinity during the growing season in a flooded rice field of Thessaloniki plain, Greece. Agron-omy. 2015; 5: 35–54.
9. Panagea IS, Daliakopoulos IN, Tsanis IK, Schwilch G. The application of three promising technologies for soil salinity amelioration in Timpaki (Crete): a participatory approach. Solid Earth. 2016; 7: 177–190.
10. Maas EV, Hoffman GJ. Crop salt tolerance. Current assessment. J Irrigation Drainage Division. 1977; 103(2): 115–134.
11. Grattan SR, Zeng L, Shannon MC, Roberts SR. Rice is more sensitive to salinity than previously thought. California Agriculture. 2002; 56(6): 189–195.
12. Zheng H, Wang J, Zhao H, Liu H, Sun J, Guo L, Zou D. Genetic structure, linkage disequilibrium and association mapping of salt tolerance in japonica rice germplasm at the seedling stage. Mol Breeding. 2015; 35: 152–168.
13. Negrao S, Courtois B, Ahmadi N, Abreu I, Saibo N, Oliveira MM. Recent updates on salinity stress in rice: from physiological to molecular responses. Critical Review in Plant Science. 2011; 30: 329–377.
14. Platten JD, Edgane JA, Ismail AM. Salinity tolerance, Na+ exclusion and allele mining of HKT1;5 in
Oryza sativa and Oryza glaberrima: many sources, many genes, one mechanism? BMC Plant Biology.
2013; 13: 32.https://doi.org/10.1186/1471-2229-13-32PMID:23445750
15. Ismail A, Heuer S, Thompson MJ, Wissuva M. Genetic and genomic approaches to develop rice germ-plasm for problem soils. Plant Mol Biol. 2007; 65(4): 547–570. https://doi.org/10.1007/s11103-007-9215-2PMID:17703278
16. Moradi F, Ismail AM, Gregorio GB, Egdane JA. Salinity tolerance of rice during reproductive develop-ment and association with tolerance at the seedling stage. Ind J Plant Physiol. 2003; 8: 105–116.
17. Horie T, Karahara I, Katsuhara M. Salinity tolerance mechanisms in glycophytes: an overview with the central focus on rice plants. Rice. 2012; 5: 11.https://doi.org/10.1186/1939-8433-5-11PMID:
27234237
18. Pires IS, Negrao S, Oliveira MM, Purugganan MD. Comprehensive phenotypic analysis of rice response to salinity stress. Physiol Plant. 2015; 155: 43–54.https://doi.org/10.1111/ppl.12356PMID:
26082319
19. Ranathunge K, Steudle E, Lafitte R. Control of water uptake by rice: role of the outer part of the root. Planta. 2003; 217: 193–205https://doi.org/10.1007/s00425-003-0984-9PMID:12783327
20. Garcia A, Rizzo CA, Ud-Din J, Bartos SL, Senadhira D, Flowers TJ, Yeo AR. Sodium and potassium transport to xylem are inherited independently in rice and the mechanisms of sodium:potassium selec-tivity differs between rice and wheat. Plant Cell and Environment. 1997; 20: 1167–1174.
21. Garcia AB, Engler JD, Iyer S, Gerats T, van Montagu M, Caplan A.B. Effects of osmoprotectants upon NaCl in rice. Plant Physiol. 1997; 115: 159–169. PMID:12223797
22. Yeo AR, Flowers TJ. Salinity resistance in rice and a pyramiding approach to breeding varieties for saline soils. Aus J Plant Physiol. 1986; 13: 161–173.
23. Roy SJ, Negrao S, Tester M. Salt resistant crop plants. Curr Opin Biotechno. 2014; 26:115–124.
24. Fukuda A, Nakamura A, Hara N, Toki S, Tanaka Y. Molecular and functional analysis of rice NHX-type Na+/K+ antiporter genes. Planta. 2011; 233: 175–188https://doi.org/10.1007/s00425-010-1289-4
PMID:20963607
25. Poorter H, Niinemets U, Poorter L, Wright IJ, Villar R. Causes and consequences of variation in leaf mass area: a meta-analysis. New Phytologist. 2009; 182: 565–588. PMID:19434804
26. Negrao S, Schmo¨ckel SM, Tester M. Evaluating physiological responses of plants to salinity stress. Annals of Botany. 2016; 119(1): 1–11.https://doi.org/10.1093/aob/mcw191PMID:27707746
27. Abdullah Khan MA, Flowers TJ. Causes of sterility in seed set of rice under salinity stress. J Agron Crop Sci. 2001; 187: 25–32
28. Gimhani DR, Gregorio GB, Kottearachchi NS, Smarasinghe WLG. SNP-based discovery of salinity-tol-erant QTLs in a bi-parental population of rice. Mol Genet Genomics. 2016; 291(6): 2081–2099.https:// doi.org/10.1007/s00438-016-1241-9PMID:27535768
29. De Leon TB, Linscombe S, Gregorio G, Subudhi PK. Genetic variation in Southern USA rice genotypes for seedling salinity tolerance. Frontiers in Plant Science. 2015; 6: 374.https://doi.org/10.3389/fpls. 2015.00374PMID:26074937
30. Ahmadi N, Negrao S, Katsantonis D, Frouin J, Ploux J, Letourmy P, et al. Targeted association analysis identified japonica rice varieties achieving Na+/K+ homeostasis without the allelic make-up of the salt tolerant indica variety Nona Bokra. Theor Appl Genet. 2011; 123(6): 881–895.https://doi.org/10.1007/ s00122-011-1634-4PMID:21713536
31. Campbell MT, Knecht AC, Berger B, Brien CJ, Wang D, Walia H. Integrating image-based phenomics and association analysis to dissect the genetic architecture of temporal salinity responses in rice. Plant Physiol. 2015; 168: 1476–1489.https://doi.org/10.1104/pp.15.00450PMID:26111541
32. Kumar V, Singh A, Mithra SVA, Krishnamurthy SL, Parida SK, Jain S, et al. Genome-wide association mapping of salinity tolerance in rice. DNA Research. 2015; 22(2): 1–13.