ANALYSIS OF ABDOMINAL SLOW POTENTIALS
DURING MOTION SICKNESS
by
Brian W. Rague
S.B., Massachusetts Institute of Technology (1984)
SUBMITTED IN PARTIAL FULFILLMENT OF THE REQUIREMENTS OF THE
DEGREE OF
MASTER OF SCIENCE IN
AERONAUTICS AND ASTRONAUTICS
at the
MASSACHUSETTS INSTITUTE OF TECHNOLOGY May 1987
@ Massachusetts Institute of Technology 1987
Signature of Author
Derartment of Aeronautics and Astronautics May 8, 1987 Certified by
Accepted by
Dr. Charles M. Oman Thesis Supervisor, Department of Aeronautics and Astronautics Prof. Harold Y. Wachman Chairman, Department Graduate Committee
M
nITLibraries
Document Services
Room 14-0551 77 Massachusetts Avenue Cambridge, MA 02139 Ph: 617.253.2800 Email: docs@mit.edu http://libraries.mitedu/docsDISCLAIMER OF QUALITY
Due to the condition of the original material, there are unavoidable
flaws in this reproduction, We have made every effort possible to
provide you with the best copy available. If you are dissatisfied with
this product and find it unusable, please contact Document Services as
soon as possible.
Thank you.
Some pages in the original document contain pictures,
graphics, or text that is illegible.
-ANALYSIS OF ABDOMINAL SLOW POTENTIALS DURING MOTION SICKNESS
by
BRIAN WILLIAM RAGUE
Submitted to the Department of Aeronautics and Astronautics on May 8, 1987 in partial fulfillment of the
requirements for the Degree of Master of Science in Aeronautics and Astronautics
ABSTRACT
The purpose of this investigation was to quantitatively characterize changes in gastric my-oelectical activity in subjects experiencing motion sickness. Gastric electrical activity can be recorded cutaneously via surface electrodes placed on the abdomen, a method called electrogastrography (EGG).
Six healthy volunteers each participated in four repetitions of a standard motion sickness experiment. To induc motion sickness, subjects executed head movements in pitch and roll while rotating about an earth-vertical axis, thus producing a provocative Coriolis cross-coupled stimulus to the semicircular canals. A velocity staircase rotation profile was used. Subjects evaluated their sickness intensity using magnitude estimation of overall discom-fort. Symptom endpoint was "halfway to vomiting." Symptoms were simultaneously scored
according to the Pensacola Diagnostic method.
The stimulus successfully elicited moderate to severe symptoms in all test sessions. The EGG signal, sampled at 1 hz, was obtained during the entire stimulus period and for at least 15 minutes prior to chair rotation. Running spectrum analysis of the recorded EGG's from all trials show a consistent loss in power of the 3 cycle/minute Basic Electrical Rhythm (BER) component by an average of 85% during motion sickness periods.
A dimensionless Spectrum Peak Index was proposed to detect EGG rhythm changes. A running average of the Spectrum Peak Index was calculated to obtain a measure of the duration and stability of decreases in BER magnitude. Parameters associated with this running average method were optimized to predict sickness. Using this method, running average EGG changes occurred more than one minute before the experimental endpoint was reached in 22 of 24 sessions. False positives occurred -10% of the time in resting subjects. False negatives for subjects experiencing moderate or severe nausea occurred ~17% of the
time.
Although BER amplitude decrease was thus a reasonably consistent feature of sickness onsetj it is not pathogmonic. Unequivocal tachygastric activity occi'rred in only 7 of the 24 trials, in contrast to a recent study by Stern, et.al. in which tachygastrias and motion sickness appeared more strongly correlated.
Thesis Supervisor: Dr. Charles M. Oman
Contents
1 Introduction 6
2 Background Issues 16
2.1 Electrical and Mechanical Activity of the Stomach . . . . 16
2.1.1 Anatomy of the stomach . . . . 16
2.1.2 Gastric action potentials . . . . 17
2.1.3 Propagation of action potentials . . . . 19
2.1.4 The interdigestive migrating complex . . . . 21
2.1.5 The cutaneous waveform. . . . . 22
2.2 Motion Sickness . . . . 25
2.2.1 Organs for transducing motion . . . ... . . . . 25
2.2.2 Etiology of motion sickness . . . . 26
2.2.3 Coriolis cross-coupled stimulation . . . . 30
2.2.4 Symptom scoring and magnitude estimation . . . . 34
2.3 EGG Processing and Analysis . . . . 43
2.3.1 Electrodes and electrode placement . . . . 43
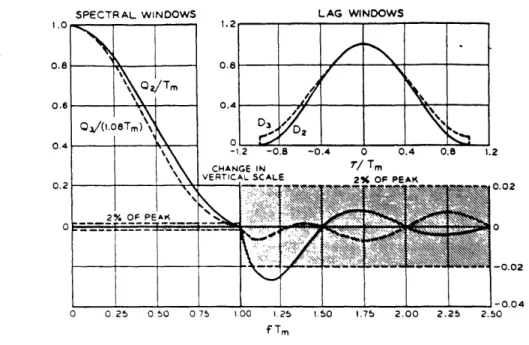
2.3.2 Fourier Analysis and windowing . . . . 48
2.3.3 Power spectrum estimation . . . . 56
2.3.4 Running spectrum analysis . . . . 58
3 Materials and Methods 64 3.1 Subjects . . . . 64
3.2 EGG Recording . . . . 65
3.3 Signal Analysis and System Overview . . . .. . . . . 67
3.4 Procedure . . . .. . . . . 73
4 Results 75
CONTENTS
5 Analysis and Discussion 84
5.1 Spectrum Peak Index . . . . 84
5.2 Running Average Method Applied to the Spectrum Peak Index . . . . 88
5.3 The Usefulness of Tachygastrias in Motion Sickness Diagnosis . . . . 100
5.4 EGG Recording and Processing Methods . . . . 102
5.5 Sum m ary . . . . 109 A Motion Sickness Questionnaire, Pre-Session Questionnaire, Magnitude
Estimation Instructions, and Informed Consent Statement 112
B Symptom Scoring Definitions 120
C Lattice-C Programs used for EGG Real-Time Analysis 129
D Data 151
Bibliography 176
Acknowledgements
5
Chapter
1
Introduction
Gastric smooth muscle fibers generate electrical activity which can be recorded with sur-face electrodes placed on the abdomen. The signal from the stomach tissue that is measured is called the electrogastrogram, and the recording procedure is termed electrogastrography. The purpose of this investigation was to study cutaneous electrogastrogram recordings, using running spectrum analysis, in order to quantitatively characterize changes in gastric myoelectrical activity in subjects experiencing motion sickness. The consistency of the elec-trogastrogram response during periods of motion sickness stress is analyzed for the purpose of developing statistical criteria for diagnosis. The engineering objective of this research was to develop a microcomputer (PC/AT) based system capable of data acquisition and real-time signal processing of the electrogastrogram. Because PC/AT compatible systems are increasingly common in both research and clinical environments, the analysis software written for this investigation may be easily transported to computers in other laboratories doing electrogastrography. Throughout the following report, both electrogastrography and the electrogastrogram will be referred to as EGG.
The investigation of the EGG essentially began in 1922, when Walter Alvarez recorded the first electrogastrogram in a thin, elderly woman with a large cicatricial hernia[3]. The woman's abdominal wall was so thin that Alvarez was able to observe the rhythmic
CHAPTER 1. INTRODUCTION
7
B
*/
~
*.Figure 1.1: First EGG (from Alvarez,1922).
staltic movements associated with stomach contractions. During the recording session, he found a consistent correlation between the periodicity of the signal detected via the surface electrodes and the regular visible movements of the stomach. Figure 1.1 shows a sketch of this first EGG record as well as a diagram of electrode positions. As shown in the figure, the period of the EGG is about 20 seconds. This translates to a frequency of 0.05 hz or 3 cycle/minute (3 cpm). Subsequent EGG experiments verified the existence of this baseline gastric rhythm in normal, resting humans[11,12,54,66]. The 3 cpm frequency has been des-ignated as Electrical Control Activity (ECA), Basic Electrical Rhythm (BER), slow wave activity, etc. In this paper, the baseline rhythm will usually be referred to as BER.
In 1975, Brown, et.al. analyzed EGG's of sixteen healthy volunteers[8]. The stomach's mechanical activity was simultaneously monitored by measuring intragastric pressure. The investigators found that 3 cpm activity occurs during periods of motor quiescence, i.e., no stomach contractions. Other observations from this study include a periodic component of
CHAPTER 1. INTRODUCTION
higher frequency (10 to 12 cpm) in 9 out of 32 recordings that was ascribed to the electrical activity of the small intestine. Also, after consumption of a meal the amplitude of the gastric component increased by about 150%. This increase was assumed to be due to a decreased distance of the electrodes to the distended stomach.
The amplitude of the raw EGG is typically 100-300pV. The size of the BER varies with subject, electrode position with respect to the gastric antrum, gastric contractile activity, extent of fasting, and other factors. Because of this small amplitude and the ultra-low frequency range of interest (0-0.5 hz), EGG records are hampered by electrode motion artifact, usually respiratory in origin. Successful recordings usually require that the subject remains relatively still. Also, various bandpass filtering protocols have been utilized to produce better quality recordings for visual inspection[56,70].
Recently, the most comprehensive research of EGG origin, measurement, and analysis has been conducted by a clinical group at Erasmus University in Rotterdam, The Nether-lands. The objectives of their work in electrogastrography are geared toward clinical appli-cations, with an emphasis on the diagnostic and noninvasive value of the EGG recording technique. Smout's introductory paper on EGG, "What is measured in Electrogastrogra-phy?" details the evidence that gastric myoelectrical activity is, indeed, being reflected in the surface recordings of the EGG[52]. Other human experiments have verified that the BER obtained from cutaneous electrodes is similar in character to the signal recorded di-rectly from the stomach mucosa using mucosal electrodes[1,2,18,21]. In the latter portion of his paper, Smout proposes a dipole model to explain the postprandial amplitude increase of the EGG. Figure 1.2 summarizes the basic idea. Smout also characterized a 'second potential' which is phase-locked to the ECA and indicative of contractile activity in the stomach. This has been designated electrical response activity (ERA). ERA is frequently characterized by spiking activity in the intracellular recordings of stomach tissue. However, Smout warns that "...in the canine stomach ERA does not always consist of spikes."
CHAPTER 1. INTRODUCTION
-- A
9
B
intracellular
schernaric rearesentar ior
d depolarized areas potentials 01 - 1 01 I I-I I I I I I I I I I I I I I I I I gensrated by the individual depolorizati dipoies
su
OF potentialsgoes ratd by the
depelwaition dipaies sum d potentials ated by ?he re dlrization dipoles I I I I\ I sunnatica d depo a i tat ian and
r epolizi o n potent ials
Figre .2lpen: D
Figure 1.2: Dipole model (from Smout,1980).
CHAPTER 1. INTRODUCTION
10
A B
Spectrur display o04. postprandia' recording.
.5e7sn .. Doag 2. A. Pseudo 3-D displau.
Figure 1.3: EGG displays (from Van Der Schee,1982).
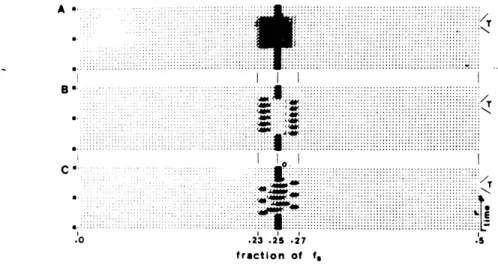
Fourier analysis of EGG time series is widespread[8,32,50,52,53,65]. Other analysis methods include auto-regressive modelling[33, phase-lock techniques[49], and adaptive filtering[30,72]. The use of Fourier transformations to implement running spectrum analy-sis (RSA) was introduced by Van Der Schee, et.al.[70]. In RSA, frequency changes in the input signal over time can be derived by taking Fourier transforms of successive overlapping stretches of input data. The resulting information can be displayed as a grey-scale plot, or waterfall plot, both shown in Figure 1.3. Parameters such as sampling rate, length of win-dow, percentage overlap, windowing function, and electrode configuration are proposed by Van Der Schee. A discussion of the methods and rationale behind their recording procedure is also presented. The final conclusion is that "RSA offers the possibility of extracting both qualitative and quantitative information from the electrogastrogram. It can be considered as a significant improvement in the analysis of the EGG, which brings electrogastrography one step closer to (clinical) application."
CHAPTER 1. INTRODUCTION
11
s0
s-
40-0
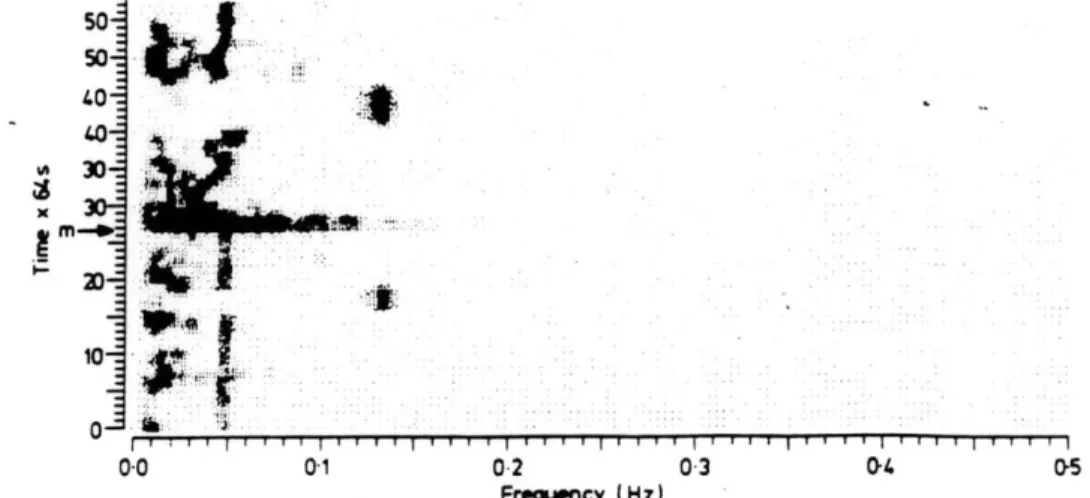
0.0 01 02 03 0- 05 Frequency (Hz)Grey-scale plot of an electrogastrogram from the patient with tachygastrias both in fasting and postprandial states at about 0-13 H:. Coinciding with food intake (start marked with M') the effect of a motion ariefact is visible in the spectrum.
Figure 1.4: Occurrence of tachygastrias (from Geldofet.al.,1986).
Recent clinical studies of certain selected patients with chronic or unexplained nausea and vomiting have suggested that a disturbance of the frequency of the BER can be found intermittently in these patients[17,21,63,78,79]. These disturbances are typically character-ized by abnormal increases in BER frequency, called tachygastrias. Geldof, et.al., report that tachygastria occurred in 8 of their 48 patients, and that these episodes lasted be-tween 3 and 14 minutes[17]. Figure 1.4 shows evidence of tachygastrias in a grey-scale plot. Hamilton observed in one normal subject a period of 2.5 minutes in which the BER rate "exceeded five per minute." However, the intermittent occurence of tachygastrias in normal, resting subjects has yet to be validated.
Geldof, et.al., utilized EGG techniques in assessing gastic myoelectrical activity in pa-tients with unexplained nausea and vomiting[17]. They state that their "study shows that with electrogastrography...abnormal myoelectrical behaviour can be discerned." Based on their observations, 48% of the patients exhibited anamolous myoelectrical activity which
CHAPTER 1. INTRODUCTION
was characterized by instability of the BER, tachygastrias in both the fasting and post-prandial states, and the absence of the normal amplitude increase in the postpost-prandial elec-trogastrogram. Thus, Geldof was successful in defining a subgroup of patients exhibiting abnormal myoelectrical activity as indicated by the EGG.
The correlation between clinical nausea and changes in the EGG frequency has, not sur-prisingly, prompted investigations into the effect of motion sickness on gastric myoelectrical activity. Early investigators reported decreased gastric contractions and tone in subjects experiencing motion sickness[34,771. In related work, it was demonstrated that labyrinthine stimulation caused decreased antral contractions and delayed gastric emptying of a stan-dard meal[64]. Also, there are anecdotal accounts that abdominal sounds are absent during periods of space sickness stress(Thornton & Linder, personal communication). Most re-cently, Stern, et.al., have presented evidence of a disappearance of the 3 cpm BER, and increased tachygastric activity in the 4-9 cpm frequency range[56,57].
Initially, Stern and his colleagues visually inspected the EGG time series records of 21 healthy volunteers, 14 of whom exhibited signs of motion sickness. Figure 1.5 shows a record of tachygastria in one of Stern's subjects who reported symptoms. Stern states that for each of the 14 motion sick subjects, "the EGG frequency shifted from the normal 3 cpm to 5-8 cpm, tachygastria, an abnormal pattern." Only one of the seven asymptomatic subjects showed any alteration in normal gastric rhythm. Stern concludes that his findings "clearly link tachygastria and symptoms of motion sickness induced by vection." Two years later, Stern published a similar paper which utilized running spectrum analysis to indicate and display frequency changes in the EGG. Figure 1.6 shows the results of one of his experiments. Again, Stern claims a "very strong temporal correspondence between onset and resolution of tachygastria and increasing and decreasing symptoms." In this set of experiments, 10 of 15 subjects reported symptoms related to motion sickness induced by their circular vection stimulus. All 10 subjects "showed a shift of their dominant gastric 12
CHAPTER 1. INTRODUCTION
A 200 v El A E2 I\ E3 Respifation Minute B Elt E2 I A I. A E3 Resooration MuruleA. EGG activity recorded from upper, middle and lower
electrodes (El-E3) prior to drum rotation (Subject No. 10). The
EGG frequency is 3 cpm. B) EGG from the same subject after the
start of drum rotation. Note the presence of tachygastria (6 cpm). Tachygastria began at minute 4. The subject reported nausea at minute 6 and requested that drum rotation be stopped at minute
11.
Figure 1.5: Tachygastric event (from Stern,et.al.,1985).
13
CHAPTER 1. INTRODUCTION
14
Symptoms
volun-teered by subject:
"Hot, queasy, diz-zy. > 5 Drum I Time In 0 64 second Intervals 1 3 7 9 11 13 15
FREQUENCY
IN
CYCLES PER MINUTERunning spectral analysis of the EGG of subject 8 who reported that during rotation he was sweating. dizzy. and had a queasy stomach. Whereas 3- and 1-cycles/min activity dominate the spectral analysis be-fore drum rotation. 6 min after the onset of rotation spectral density showed a peak at 6 cycles/mmn with additional activity in the tachygastria range (5-9 cyclesimini At approximately this same point in time the subject reported his first symptoms of motion sickness.
CHAPTER 1. INTRODUCTION
15
frequency from 3 cpm to 4-9 cpm." The five subjects who reported no symptoms of motion sickness "showed a continuation of normal 3 cpm activity during drum rotation."
Results from the test sessions presented in this report are compared with those of Stern to verify his findings. Initial comparisons indicate that differences in electrode position, recording procedure, and stimulus protocol may lead to varying conclusions about the behaviour of the EGG during motion sickness. Clearly, the efforts of several investigators will be required to determine the true value and efficacy of the EGG in detection of motion sickness onset.
Chapter 2
Background Issues
This chapter will provide information about the physiological mechanisms responsible for the generation of the EGG, the time course and development of motion sickness signs and symptoms, and the signal processing theory involved in the measurement and analysis of abdominal biopotentials. These explanations are an attempt to elucidate the motivation behind EGG investigations and to present the problems and trade-offs associated with the experimental design. The topics to be described are important in understanding the procedures and results of the test sessions.
2.1
Electrical and Mechanical Activity of the Stomach
Smout[51] and Van Der Schee[69] both give a clear, detailed account of stomach mor-phology and physiology in their respective theses. A concise summary of the main points of their work provides the basic information about gastric terminology and function needed to conduct investigations of stomach motility.
2.1.1 Anatomy of the stomach
Figure 2.1 is a schematic diagram of stomach anatomy. The cardiac portion or cardia
(1) is that part of the stomach that surrounds the gastroesophageal orifice. The fundus(2)
CHAPTER 2. BACKGROUND ISSUES
3
5
8
: ':::;s :-~z:~erssee tex:;.
Figure 2.1: Stomach anatomy (from Smout,1980).
is the part oral to the gastroesophageal junction. The concave right border of the stomach is called the lesser curvature(3), and the left border, which is five times as long, is the greater curvature(4). In the lesser curvature a notch is present, the angular incisure(5). The plane through the angular incisure and perpendicular to the longitudinal axis of the stomach separates corpus(6) and pyloric portion(7+8). The pyloric portion is divided into a proximal part, the pyloric antrum(7), and a distal part, the pyloric canal(8). The boundary between these parts is sometimes indicated by a shallow indentation of the larger curvature, the sulcus intermedius(9). In the pyloric canal (length 2 to 3 cm) the circular muscle layer thickens to what has been called an intermediate sphincter.
The junction between stomach and duodenum(11), the pyloric sphincter or pylorus(10), is also characterized by a thickening of the circular muscle layer. The term 'antrum' is often used as a synonym for pyloric portion. 'Terminal antrum' is often used as a synonym for pyloric canal. Both these definitions will apply in this thesis as well.
2.1.2
Gastric action potentials
Intracellular electrode measurements reveal the shape of a typical action potential gen-erated by the smooth muscle tissue of the stomach. Figure 2.2 shows the characteristic
CHAPTER
2. BACKGROUND ISSUES
18
0 bc d - - -50mV 5.Con.igration of the actvon potential generated by gastric smooth
muscle cells.
Figure 2.2: Gastric action potential (from Smout,1980).
waveform as it appears during a gastric contraction. The resting membrane potential (phase a) found in circular muscle cells of the canine stomach is about -70 mv. The ampli-tude of depolarization (phase b) increases from the corpus to the pyloric sphincter(28.5 my to 73.8 mv). Depolarization rate increases in this anatomical direction as well(.54 V/s to 2.15 V/s)[15]. It should be noted that the proximal third portion of the stomach does not generate these action potentials.
Phase c is typically called a plateau phase, which may or may not bear spikes. Con-tractile activiy has been closely linked to the size and duration of the plateau as shown in Figure 2.3[62]. Stronger contractions are associated with plateaus of higher amplitude and longer duration. Although slower in time, the shape of a gastric action potential during contraction is similar to that generated by cardiac smooth muscle tissue. The likeness is most evident in the contractile related plateau phase. Spiking activity, superimposed on the plateau phase, may or may not occur. As mentioned in Chapter 1, contractions may occur
CHAPTER 2. BACKGROUND ISSUES 19 0 3 contractile 2 force 10 s
Figure 2.3: Relationship between contractile force and gastric action potential (from Van Der Schee,1984).
in the absence of these spikes. Phase d is the repolarization phase. A high repolarization rate is directly correlated with a high plateau amplitude. Smout utilizes this fact in his discussion of increased EGG amplitude during gastric contractions shown in Figure 1.2. 2.1.3 Propagation of action potentials
In order to understand the direction of propagation of gastric action potentials, a brief description of stomach smooth muscle orientation is necessary. Figure 2.4 shows the three basic muscle layers that line the outside surface of the stomach.
The longitudinal layer is the most superficial muscle layer, situated directly under the serosal surface. A group of fibers is continuous with the longitudinal layer of the esophagus; these fibers run along the curvatures and end in the corpus. A second group of longitudinal fibers originates in the corpus at the greater curvature. Transection experiments of the gastric muscle layers have demonstrated that the BER is generated in this region[29,75]. Thus, like the heart, the stomach may be considered to possess a pacemaker node. However, histological investigations have yet to verify the existence of a group of gastric pacemaker cells. These longitudinal fibers originating in the corpus radiate in all directions, but in p..ticular toward the pylorus. Examination of BER propagation direction has revealed that
CHAPTER 2. BACKGROUND ISSUES
20
Figure 2.4: Smooth muscle layers in the stomach (from Smout,1980).
it sweeps distally, from its point of origin, along these longitudinal fibers to the pylorus,
where it vanishes[29]. Morphologically, a part of the longitudinal fibers passes over the
pylorus into the longitudinal muscle layer of the duodenum. Propagation velocity increases
towards the pylorus: from 0.1-0.2 cm/sec in the corpus to 1.54.0 cm/sec in the distal
antrum[10].
The circular
layer,
the middle of the three layers, is continuous with the circular layer
of the esophagus. The gastric circular fibers are primarily responsible for the mechanical
contractions resulting in gastric emptying. Indeed, the thickness of the circular layer
in-creases in the antrum and especially in the pyloric canal, where gastric emptying occurs.
Circular fibers are absent over the fundus and are alleged not to be continuous with the
circular fibers of the duodenum.
The oblique layer, the innermost layer, has the shape of a horse-shoe hanging over the
fundus. On the right side (near the lesser curvature) the borders of this layer are sharply
defined. On the the left side and towards the antrum the oblique fibers disappear gradually.
The physiological purpose of the oblique fibers has not been determined.
CHAPTER 2. BACKGROUND ISSUES
21
U Ye cm electrodes from pylorus 2 26. ii. 19706-*-
CG1 0 , -'MU , -~~-7
0 0J68 J, -110 , -2 -.. -152 d - 194 AL 236 278 E_ 320 C- -6.00 p.m.- 7.00 - 8.00-9 00---000-+- -11.00--Midnit TimeFigure 2.5: Interdigestive migrating complexes (from Code and Martlett,1975).
2.1.4 The interdigestive migrating complex
BER fronts propagate aborally and at regular intervals during motor quiescent periods. In the interdigestive state, the stomach is mechanically inactive most of the time. In fasting dogs, recurring fronts of intense spike activity have been found to migrate slowly down the entire small intestine (approx. 90 minute period) [61]. This so-called interdigestive migrating complex (IMC) has also been found to occur in the canine stomach[9]. Figure 2.5 shows three separate IMC's and their rate of propagation from the gastric region to the terminal ileum.
The quantity measured (%ECA followed by ERA) is directly proportional to the level of contractile activity, which is defined as groups of strong contractions irregularly spaced in time. Code and Marlett have divided the interdigestive pattern into four phases. During phase I there is no ERA('second potential') or spike activity. Phases II and IV are transition phases. Phase III represents the activity front, which lasts for about 12 minutes in the stomach. Phase III is characterized by groups of strong contractions being alternated by short periods with weak or absent contractions(27. As shown in Figure 2.5, the propagation rate of the IMC decreases as it moves distally along the lower alimentary canal. When an
CHAPTER 2. BACKGROUND ISSUES
Van Der Schee, et.al., have studied interdigestive gastric contraction-related phenomena in four dogs using running spectrum analysis of EGG's[71]. Their study demonstrated that the presence of frequencies lower than the normal gastric one, in running spectrum representations of EGG's recorded in fasting dogs, is indicative of strong antral contractions and that the mechanism through which this is brought about involves prolongation of
contraction-related BER intervals. Contractile activity was monitored via strain-gauge
force transducers sutured to the serosal surface of the stomach.
Invasive studies with pressure transducers have revealed that IMC patterns in man are less regular with regard to periodicity and to the point of origin than those found in dogs[73]. Not all IMC complexes start in the stomach{16]. Instead, the duodenum was found to be the point of origin, with phase III activity lasting for about 3 to 6 minutes. Results using RSA analysis of EGGs recorded from resting, fasted subjects reveal much variability in the running spectrum during the interdigestive period[69]. In some recordings, a consistent
gastric frequency remained during phase III activity. In other running spectra, phase III activity was not accompanied by the 3 cpm rhythm. In another instance, an increase in gastric frequency correlated with the occurence of phase III activity in the duodenum. Un-like in the dog, the occurrence of low-frequency components in the running spectrum could not be proven to be indicative of an activity front in the human because such frequencies were often observed in cases when there was no contractile activity measured. As a conse-quence of the above observations, Van Der Schee concluded that "electrogastrography does
not enable us to detect with certainty that gastric motor activity exists during the IMC in
man."
2.1.5 The cutaneous waveform
In Chapter 1, several investigations were cited which verified that surface EGG record-ings contained information about gastric electrical activity. The relationship between the 22
CHAPTER 2. BACKGROUND ISSUES
23
A
B
ft B - - - 0.25N ft a 0 25N EGG - EGG . * (A-L) - SOOMV R -L. 1500jjVFigure 2.6: Serosal and EGG recordings of gastric activity (from Smout,1980). biopotentials recorded by serosal electrodes and the cutaneously recorded EGG in the dog is depicted in Figure 2.6. Part A shows a postprandial record and part B was mea-sured during an interdigestive period. Also shown are pressure recordings acquired from a force transducer situated in the antrum. The plots confirm Smout's report of increased EGG amplitude during gastric contractions, as indicated by the existence of the 'second potential'[52.
Beyond amplitude variations, analysis of the EGG waveform is seriously hampered by the generally poor quality and weak amplitude of the gastric signal. Bandpass filtering procedures are typically used to essentially 'clean up' the EGG, but this approach introduces phase distortions of the signal. Van Der Schee, et.al., employed a modified adaptive filtering technique but found that cutaneous signals obtained during the activity front of the IMC "are not suitable for detailed waveform analysis." Another complication is the existence of two or more BER fronts on the stomach at any instant of time. This precludes the identification of an EGG 'epoch' in the raw signal. Compare this to the unequivocal P wave, QRS complex, and T wave that compose the ECG waveform. Also, unlike the ECG, phases of the EGG cycle cannot be directly related to specific gastric physiological activity, mostly because of possible EGG contamination by electrical potentials generated in the small or large intestine. In contrast, the QRS complex of the ECG essentially indicates ventricular depolarization.
CHAPTER 2. BACKGROUND ISSUES 24
Because time domain analysis of the EGG has limited diagnostic value, a more profitable approach is to study the frequency characteristics of the EGG. This leads to the topic of running spectrum analysis, which is treated in more detail in Section 2.3.4.
CHAPTER 2. BACKGROUND ISSUES
2.2
Motion Sickness
The advent of new and faster types of transport vehicles has iinposed novel stresses on man's physiological motion detection mechanisms that maintain posture and balance in both static and dynamic environments. An unfortunate consequence of these stimuli is the subsequent development of motion sickness, as evidenced by its characteristic signs and symptoms. Since the US Space Shuttle missions commenced in 1981, approximately half the crew members have experienced symptoms during their first 3-5 days in weightlessness which qualitatively resemble those of motion sickness[26]. Results from MIT/Canadian vestibular experiments on Spacelab-1 support the view that space sickness is a motion sickness[41}. In space, information about body position, locomotion, and orientation is initially misinterpreted by the brain because the inertial environment produces radically different sensory inputs than those experienced on the earth. The following discussion presents an overview of the salient topics of motion sickness research to provide a rationale for quantitative assessment of abdominal biopotentials.
2.2.1 Organs for transducing motion
Three semicircular canals, each roughly aligned in three orthogonal planes, are primarily responsible for detecting accelerations induced by head movements. The canals are mem-branous circular ducts, located in the inner ear, and filled with a fluid called endolymph. Due to inertia of this fluid, rotation of the head produces motion of the endolymph with respect to the membranous wall of the canal. Movement of endolymph in the duct produces distortion of a gelatinous structure called the cupula, which occludes the lumen of the canal in a segment called the ampulla. Essentially, the properties of the endolymph cause it to act like an integrator so that cupula distortion is proportional to head velocity. Hair cells located beneath the cupula are the mechano-electrical transducers serving as the interface between the external stimuli and its neural encoding. The dominant time constant of the
CHAPTER 2. BACKGROUND ISSUES
entire system is dictated by cupula return (on the order of 12 seconds) [431.
Also located in the labyrinth of the inner ear are fibro-gelatinous otolithic membranes. These structures contain calcium carbonate crystals denser than surrounding endolymph. The membranes overlay hair cells embedded in utricular and saccular maculae. The utricle is roughly aligned in the horizontal plane; the saccule is oriented in the vertical plane. Thus, gravito-inertial accelerations of the head (and, presumably, the body), are transduced by the movement of the otoliths across the maculae. The steady state component of unit response most likely encodes acceleration magnitude, although details of membrane mechanics are not yet known[68].
Other sensory modalities used for motion detection are visual and proprioceptive. A false sensation of motion can be achieved in a stationary subject by exposure to a visual scene moving at a constant velocity and direction. This sensation is commonly referred to as vection. Pressure stimuli on specific parts of the body may be indicative of movements and are detected by receptors in the musculature. A familiar proprioceptive sensation is the "seat of the pants" input one gets during initial take-off of a commercial aircraft. There may be more subtle and refined motion transduction processes employed by highly trained pilots and other persons typically exposed to a moving environment, but the ones described above are the primary channels used to interpret a novel inertial input.
2.2.2 Etiology of motion sickness
Some of the symptoms elicited by motion sickness are typically stomach discomfort, nausea, vomiting or retching, pallor, cold sweating, salivation, drowsiness, and warmth[47j. Although our physiological understanding of motion sickness is incomplete, behavioral evi-dence has led to the development of various "sensory conflict" hypotheses[38,47]. Sickness has been noted to occur in situations where man is passively exposed to certain real or apparent motion stimuli, or to conditions of "sensory rearrangement." Reason states the
CHAPTER 2. BACKGROUND ISSUES
sensory rearrangement theory in the form of two premises[48]. "The first is that all sit-uations which provoke motion sickness are characterized by a condition of sensory rear-rangement in which the motion signals transmitted by the eyes, the vestibular system and the nonvestibular proprioceptors are at variance one with another, and hence with what is
expected on the basis of previous transactions with the spatial environment. The second.. .is
that irrespective of what other spatial senses are part to these conflicts, the vestibular system must be implicated, either directly or indirectly (as in visually-induced sickness), for motion sickness reactions to ensue." An important point is that the idea of "sensory conflict" does not refer to an inter-modality conflict, but to a disparity between present sensory information and that retained from past experiences.
The issue of how the central nervous system might actually "compute" the conflict be-tween previous sensory-motor experience and the present environment has led to the "neural mismatch model", proposed initially by Held[25]. Reason, extrapolating from Held's work, argued that as motor actions are commanded, the CNS probably continuously predicts the corresponding sensory inputs to be expected, based on a "neural store" of sensory/motor experience. The "sensory conflict" signal would result from a continuing comparison be-tween actual and expected sensory inputs. Oman explains rearrangement adaptation as sensory/motor learning which would make predicted sensory inputs more concordant with those actually experienced, thereby reducing sensory conflict[42].
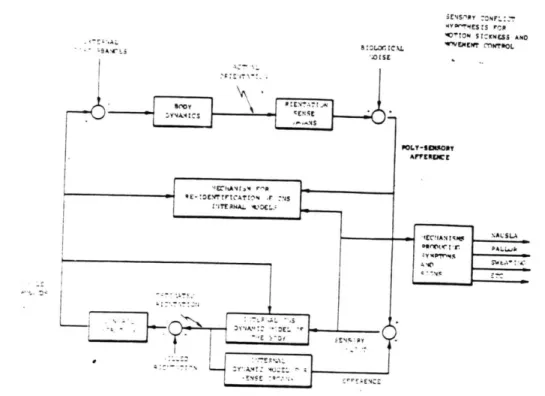
Oman identified some significant shortcomings in the "neural mismatch" model[40]. Specifically, the model is only qualitative, with structural elements like "neural store" and "memory traces(engrams)" being intuitively defined. No conflict neuron has been identified. Oman states that "the model accounts for many known facts concerning motion sickness, but its predictive value is very limited." Oman's "sensory-motor conflict" model[38] is shown in Figure 2.7. It was developed from a formal control theory consideration of the information processing task faced by the central nervous system as it actively controls
28
CHAPTER 2. BACKGROUND ISSUES
i~4S.'PY :ONFL::T 0'1TN SIZKNESS ANO .-a. B:L. L "CLMEW MNOL * -NA'ENALSLAS -M IA .. 3 OW L -- ESOR AFEZ NSE
Sensory-Motor Conflict Model for Motion Sickness and Movement Control.
Internal models consist of differential equations describing body and
sense organ dynamics. Based on current muscle commands, equations
provide "estimated orientation" state vector, used to determine new
muscle commands. Simultaneously,
"estimated orientation" drives
differential equations for sense organs to compute "efference copy"
vector. If internal models are correct, and there are no system external
disturbances, efference copy vector nearly
cancels poly-sensory
afference. If not, the difference
- a "sensory conflict" vector
-can be
used to steer the model predictions towards reality, trigger
corrective
muscle commands, and indicate a need for re-identification of the
internal model differential equations and steering factors. Conflict
vector couples also to symptom production mechanisms. Adaptation via
re-identification takes place by analysis of the new relationship between
muscle commands and poly-sensory afference, and model updating.
CHAPTER
2. BACKGROUND ISSUES
29
Mathematical
formulation ofmodel
shown in Fig.1.
Left side representsbody
movement
controlloop.
A,B, andS
arematrices
of differentialequation coefficients describing body and sense organ dynamic
characteristics, expressed in
state variable
notation. A,B,
andS
represent CNS internal
model
estimates of thesematrices,
and correspondto the "Neural Store"
of
Reason's (1978)model, Right
side offigure
shows conflict coupling and preliminary dynamic model for symptom
response,
aspects
not specifically represented in earliermodels.
Figure 2.8: Mathematical formulation of Oman model (from Oman,1982).
body movement using a limited set of noisy sensory signals. The mathematical version of the model is shown in Figure 2.8. Note in the figure the coupling of conflict signals to the autonomic/emetic pathways. The linkage shown here implies that conflict signals are continuouely functionally "averaged" by mechanisms which determine the intrinsic dynamics (latency, avalanching tendency, recovery time, etc.) of symptoms and signs.
Although the sensory conflict theory is now the generally accepted explanation for motion sickness in its many forms on earth, it does not provide a comprehensive scientific definition of motion sickness in physiological terms. A more precise identification of the neural-humoral mechanisms responsible for the onset of motion sickness symptoms is clearly a priority.
CHAPTER 2. BACKGROUND ISSUES
2.2.3
Coriolis cross-coupled stimulation
Various stimuli can be used to elicit sensory conflict, and at sufficiently high levels to provoke motion sickness. Seasickness is brought on by the visual-vestibular rearrangement of watching waves over the side of the vessel. Making head movements while wearing prism goggles (optical devices which reverse left-right vision) has a strong disorienting and nauseogenic response. A commonly used stimulus utilized by motion sickness researchers equipped with a rotating chair is the Coriolis cross-coupling effect. This refers to the vestibular effect of tilting the head during whole-body rotation.
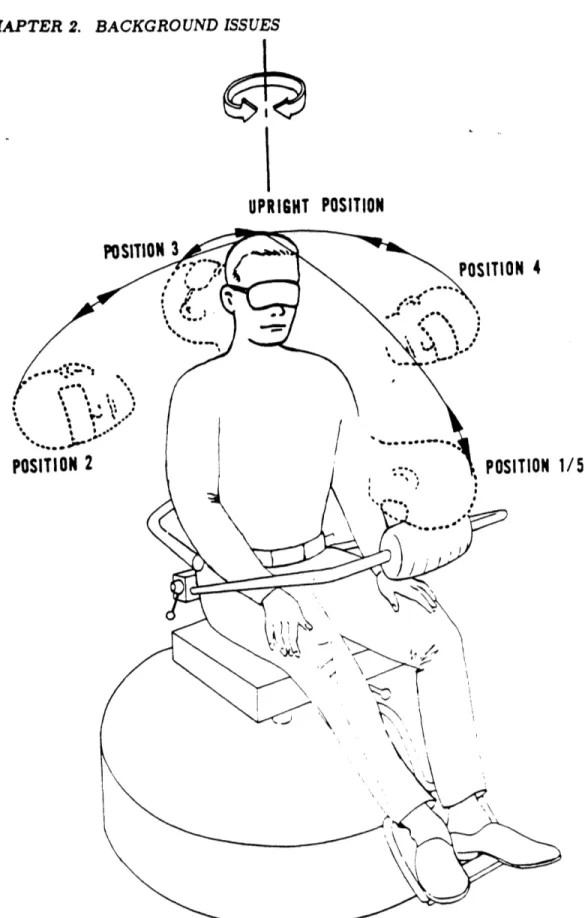
The disorienting sensation felt by the subject experiencing Coriolis stimulation is best described using an example. A subject is seated in a rotating chair apparatus as in
Fig-ure 2.9. The subject is rotated for a few minutes in a counter-clockwise direction at a constant velocity. The subject then makes a rolling head movement to the right, which is accompanied by a sensation of pitching forward and accelerating slightly to the right. This provocative sensation conflicts with the otolith signal, which, because of the head movement, registers a change in the direction of gravity relative to the head. The net effect is a disorienting and potentially nauseogenic stimulus based on the incompatible signals detected by the canals and otolith.
As implied in the above description, rotating one's head in one axis, the W2 axis, while rotating about another axis, the w1 axis, produces an instantaneous stimulus about at third
axis. The term "cross-coupled" is therefore used to describe this effect because the resulting stimulus can be calculated from vector algebra as the vector cross product of the w, and
w2 velocity vectors.
Guedry and Benson present a study which distinguishes conditions in which Coriolis cross-coupling effects are disorienting and nauseogenic from conditions in which they are neither[20]. The basic purpose was to present angular accelerations or decelerations of whole body rotation immediately preceding the head movement. The result was that
CHAPTER 2. BACKGROUND ISSUES
UPRIGHT POSITION
POSITION 3
POSITION 4
POSITION 2
POSITION 1/5
Figure 2.9: Rotating apparatus with diagrammed head movements (from Miller and Gray. biel,1969).
CHAPTER 2. BACKGROUND ISSUES
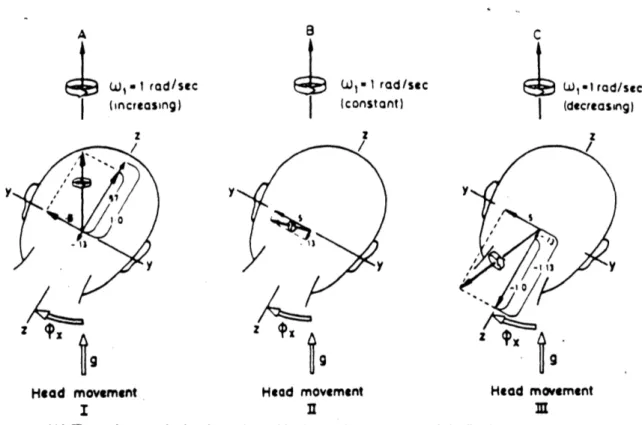
orienting or disturbing effects reported by the 12 subjects tested were either cancelled, as when accelerating from rest, or exacerbated, as when decelerating from a constant velocity. The three situations are illustrated in Figure 2.10. Note in the figure the different align-ments of the resultant angular impulse of the semicircular canals. These resultant vectors are compared with the inputs from the otoliths (g-vector) to produce either agreeable or disorienting sensations.
A key point in Guedry's analysis was that "the temporal characteristics of the angular acceleration and deceleration in starting and stopping the quick head rotation in roll about the X-axis of the head are well within the dynamic response of the canals transducing the motion so that there is no erroneous signal from an idealized roll-axis 'canal' on termination of the head tilt." In other words, cupula dynamics are such that a rapid head roll to the right yields essentially no input sensation from the roll axis canals. Thus, the cross-coupling occurs in the Y-plane and Z-plane only, as shown in Figure 2.10.
Also, Guedry explains that the stimulus intensity does not depend on the angular
ve-locity of the head movement in the roll axis (as implied by the cross-coupling formula), but
on the amplitude of the head angular displacement. With this rightward head movement in the roll axis, the pitch canal is being rotated into the plane of chair rotation and the yaw canal is being rotated out of the plane of chair rotation. As a result, angular velocity steps, whose magnitudes depend directly on the angle of displacement, are being input to the canals. These angular velocity steps are depicted as vectors along the Y and Z axes in Figure 2.10. More generally, the velocity change (Awl) which occurs when a canal is moved from an initial postion (0i) to a final position (of) is w, (sin
#f
- sin#,),
wherew, is the angular velocity of the rotating chair, and 0 is referenced to the positive z-axis.
Under the situation of a rightward head roll in a counter-clockwise rotating environment at constant velocity, the pitch canals would receive a positive angular velocity step input while the yaw canals would receive a negative step input. This is depicted in Head Movement
CHAPTER 2.
BACKGROUND ISSUES
33 W, - I rod/sec (increasing) z /7 A9t
Head movement I wl -1 rad /sec (constant) z/ yy9
Head movement C SW,.lIrad/sec (decreasing) z -ti V3 9 Head movement M(A) The resultant angular impulse to the semicircular canals at completion of the first head movement. considering both the effects of angular acceleration of the turntable and the Coriolis cross-coupling effects. The resultant vector would be located
rela-tive to the skull by inputs from all six semicircular canals so that it remains aligned with the axis of the rotation device which. in
turn. is aligned with gravity. (9) The resultant angular impulse to the semicircular canals at completion of the second head move-ment. This resultant Coriolls crosa-coupled stimulus is the same as that which occurred in the first head movement, but absence of
effects of angular acceleration of the rotation device leaves the resultant vector displaced by about 75' from gravity. (C) The resultant angular impulse to the semicircular canals at completion of the third head movement. The Coriolis cross-coupled stimulus resolved with the effects of angular deceleration of the device yields a stimulus vector of 1.24 dw,. This is much greater than the 0.52 Aa stimulus vector from the second head movement, but it is displsoed from gravity by about 54*, less than the angular displace.
ment of the stimulus vector in the second head movement.
Figure 2.10: Effects of whole-body accelerations preceding head movements during Coriolis cross-coupled stimulation (from Guedry and Benson,1978).
CHAPTER 2. BACKGROUND ISSUES
II of Figure 2.10 in which a 30 degree rightward head movement was made from resting position. As stressed in Guedry's paper, a detailed analysis of the Coriolis cross-coupling effect-on the vestibular system is required to determine the true nauseogenic or disorienting impact on a rotated subject.
2.2.4 Symptom scoring and magnitude estimation
As stated above, some of the more common symptoms of motion sickness are stomach discomfort, nausea, vomiting or retching, pallor, sweating, and salivation. Other observ-able signs include belching, and yawning. Tests of motion sickness susceptibility, beyond a simple pass-fail criteria, would require a standardization and quantitative definition of symptoms that are reliably diagnostic of a specific level of motion sickness. Another prereq-uisite is a stimulus that is effective for the majority of normal subjects and can be generated
by conventional apparatus. The Coriolis cross-coupled sensations induced by making head
movements during whole body rotation is generally accepted to be a quantifiable, control-lable, easily executed, and effective stimulus. The major problem is devising a symptom or discomfort rating scale that would permit comparison of individual susceptibilities to motion sickness.
In 1968, Graybiel, et.al., proposed a rating scale that essentially translated the subject's symptom reports into a numerical score that is believed to provide a measure of relative sickness severity[19. In this procedure commonly known as the Pensacola Diagnostic Rat-ing Scale, the presence and/or strength of epigastric awareness and discomfort, nausea, drowsiness, salivation, headache, dizziness, and warmth are subjectively assessed by the subject, working with a trained observer who also subjectively evaluates the extent of pal-lor and cold sweating. A weighted sum of individual symptom reports yields a score which formally classifies the tested subject as being at a specific level of severity, indicated by the lower section of Figure 2.11. Graybiel claims that one of the advantages of this rating 34
CHAPTER 2. BACKGROUND ISSUES
Diognostic Categorization of Different Levels of Severity of Acute Motion Sickness
'Pathognomonic Major Minor Minimal AQS*
Coteuory 16 points 8 points 4 points 2 points I point
Nausea syndrome Vomiting or retching Nousao'll, IlIl Nausea I Epigastric discomfort Epigastric awareness Skin Pallor Il Pallor I Pallor I FlushingSubjective warmth Il
Cold sweating IlIl
Increased salivation IlI II
Drowsiness IlIl I
Pain Headache > II
Central nervous Dizziness
system Eyes closed > 11
Eyes open Il Levels of Severity Identified by Total Points Scored
Frank Sickness Severe Malaise Moderate Malaise A Moderate Malaise 8 Slight Malaise
(S) (M ll) (M IIA) (M li8) (M I)
>16 points 8 -15 point 5 - 7 poists 3 - 4 points I - 2 points
*AQS - Additional qualifying symptoms. + IlIl -severe or marked, I - moderate, I - slight.
Figure 2.11: Pensacola rating scale as proposed by Graybiel (from Graybiel,1969).
CHAPTER 2. BACKGROUND ISSUES
scale is that test session endpoints can be based on symptomatology manifested prior to the more severe signs of nausea or vomiting. Graybiel's evaluation of his proposed rating scale uses a Malaise III (M III) endpoint[35].
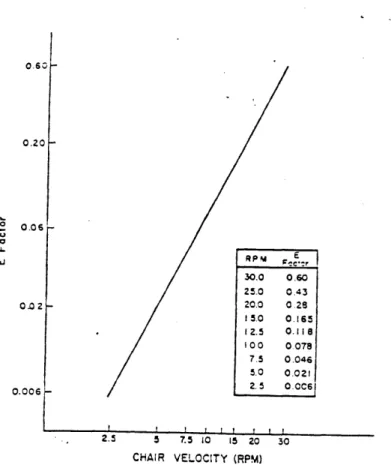
In that study, Graybiel was able to evoke the M III endpoint in 98.8% of 250 normal subjects. His subjects were rotated in a chair at a constant velocity subjectively prede-termined using information given in a motion sickness questionnaire. While rotating, the subject would execute a standardized sequence of 90* head movements, inducing the Corio-lis cross-coupled accelerations: front,up; right,up; back,up; left,up; front,up. Each set of 10 head movements would require 10 seconds, leaving 20 seconds for symptom reports. Thus, a set of 5 down-up head movements was performed every 30 seconds. Graybiel proposed a quantitative susceptibility score scaled by the magnitude of the stressor effect (E factor), defined as the vestibular stress experienced by the subject when making a head movement at a given chair angular velocity. This definition presupposes that the subject is being spun at a rate fast enough to evoke the M III endpoint, and Graybiel cautions that head move-ments in the four specified directions are not equally stressful. Graybiel and Miller have shown that "the E factor.. .varies directly and, in log-log terms, is linear with rotational velocity." This means that head movements at successively higher rotational velocities are exponentially more stressful(Figure 2.12).
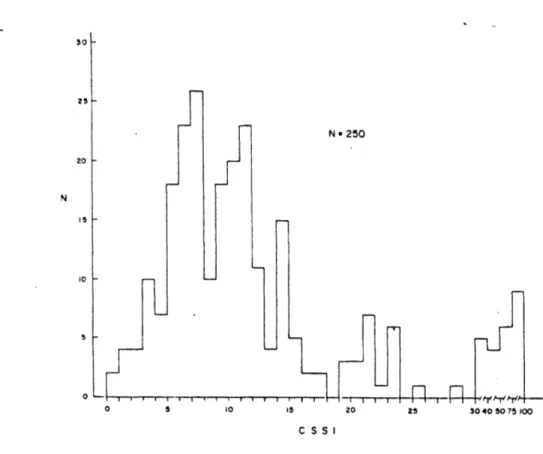
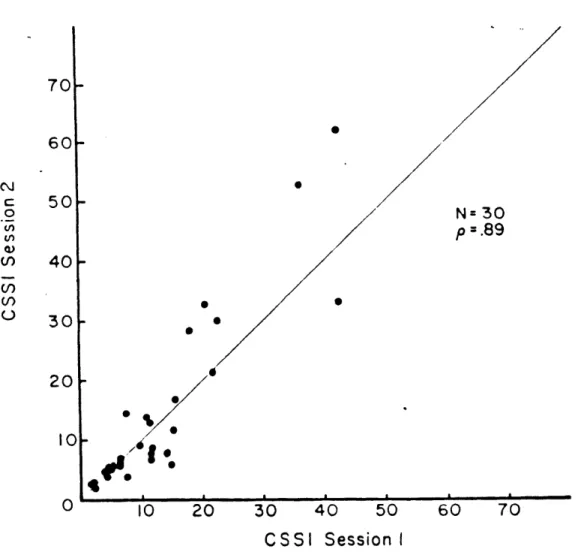
The susceptibility score, called the Coriolis Sickness Susceptibility Index (CSSI) was calculated simply by multiplying the approprite E factor for the RPM used in the test by the number of down-up head movements required to elicit M III. CSSI values of the normal subjects were markedly right skewed on an arbitrary scale of 0 to 100 points as shown in Figure 2.13. High test-retest reliability was found for both CSSI scores and pattern of symptomology. The correlation coefficient, as shown in Figure 2.14, was p=0.89.
Kohl extended CSSI score evaluations to include step increases in chair velocity during the test session, a procedure called the Staircase Profile Test[31]. By approximating the
37
CHAPTER 2. BACKGROUND ISSUES
0.o6,-0.20 LJ 0.06 0.02 -0.006 -RPM E 30.0 0.60 25.0 0.43 20.0 0 28 15.0 0.165 12.5 0.118 100 0.078 7.5 0.046 5.0 0.021 2.5 0.006 2.5 5 7.5 10 15 20 30 CHAIR VELOCITY (RPM)
Figure 2.12: Relationship between E factor of a single head movement and rotational velocity (from Graybiel,1969).
CHAPTER 2. BACKGROUND ISSUES 30 25 -N 20 is 10 5 0
Figure 2.13: Distribution of CSSI score among 250 normal subjects (from Graybiel,1969).
38
N a 250
0 5 10 .5 20 25 30 40 50 75 100
CHAPTER 2. BACKGROUND ISSUES 39
70- 60-C 50-. N= 30
W
p=.89
M> 40-U)30
020
% 10- /4*10
0
10
20
30
40
50
60
70
CSSI
Session I
CHAPTER 2. BACKGROUND ISSUES 40
8 log CS = 1,&S326 ioq H -5 36675
.. 6
4 ERROR ERROR <
CSSI
0 0 100 300 500 700
KM
Figure 2.15: Exponential function depicting relationship between coriolis stress (E factor) and angular velocity (from Kohl,1987).
cumulative stress endured by making 40 head movements at each odd RPM, Kohl calculated CSSI scores for two separate endpoints, M III and frank sickness. The M III endpoint calculations are shown in Figure 2.15. To standardize CSSI scores across different endpoints, the E factor must be appropriately scaled upward for less severe endpoints since it should take fewer head movements to achieve a smaller number and degree of symptoms. Generally it may be concluded from past and present research that stimulus intensity or conflict increases approximately as the square of chair rotation velocity (expressed in RPM).
The Pensacola Diagnostic Scale is useful in determining a standardized motion sickness endpoint based on subjective reports of signs and symptoms. However, it's usefulness in assessing the magnitude of the subject's overall discomfort level is suspect. For example, there is no reason to believe that the sensation reported as nausea level II is twice as great as nausea level I, or that an overall score of 12 points (M III) is subjectively twice as uncomfortable as a 6 point score (M IIa). Also, symptom definition is not yet standardized
CHAPTER 2. BACKGROUND ISSUES
between laboratories and research groups. Further complicating the interpretation of the Pensacola score is that subjective reports originate not only from the subject but also from the observer, making symptom evaluation highly dependent on the previous experience of two individuals. This approach countermands the basic tenets of magnitude estimation, in which only the subject's judgement of a stimulus should be involved.
Stevens and co-workers demonstrated that observers can reliably make numerical esti-mates of subjective sensations resulting from a wide variety of sensory stimuli (e.g. loudness, vibration, electric shock) using "ratio scaling" techniques[58,59,60]. Essentially, magnitude estimation is a form of ratio scaling in which the subject is required to assign numbers to a series of stimuli under the instruction to make the numbers proportional to the apparent magnitudes of the sensation produced. Reason and Graybiel proposed an ordinal "well be-ing" scale, but the instructions given to the subjects did not indicate that a doubling of the score should correspond to a doubling of subjective sensation[46. In magnitude estimation, the experimenter may prescribe a standard sensation ("modulus") by presenting a control stimulus and instructing the subject to call the resulting sensation some particular value, or the subject may be free to choose his own modulus. Using cross-modality testing and sensation matching techniques, Stevens argued that subjects were actually able to make consistent, veridical estimates of the relative strength of their sensations.
Bock and Oman developed a simple technique for reporting overall subjective discom-fort (or, alternatively, nausea) based on Stevens' magnitude estimation rules[7]. Subjects are instructed to choose a sensation magnitude of overall discomfort in the middle of the "moderate range" and to rate all subsequent sensations with respect to it. This complies with Steven's request that only one reference point near the center of the range of mag-nitudes to be estimated should anchor the scale. After a practice period to establish a consistent modulus, a subject's reports appear internally consistent. However, the discom-fort experienced at the reference level most likely varies between subjects, so the numerical 41
CHAPTER 2. BACKGROUND ISSUES 42
scores of different subjects cannot be equated. This method is well suited to studies in which time course of symptoms must be quickly assessed. Bock and Oman, using results from magnitude estimation reports by subjects wearing prism goggles, found that subjec-tive discomfort exhibits a profile characterized by both fast and slow response components. Magnitude estimation serves as a useful complement to the Pensacola Diagnostic Scale.
CHAPTER 2. BACKGROUND ISSUES
2.3
EGG Processing and Analysis
In- electrogastrography, as in any other 'EXG' technique, surfacb electrodes must be attached to the skin. The signal generated from the gastric smooth muscle tissue is small (100-500V) and typically contaminated by various kinds of noise (electrode-to-skin inter-face potentials; electrical contributions from the heart, respiration muscles, and duodenum; motion artifacts). Therefore, the EGG signal picked up by the electrodes must be appropri-ately amplified and filtered. Straightforward waveform analysis of the cutaneously recorded signal is complicated by the existence of two or more BER fronts on the stomach at any instant of time. The roughly sinusoidal shape of the EGG, coupled with its characteristic periodicity (3 cpm) in a normal resting subject, makes frequency analysis a viable alter-native to -time series investigation. This section provides the theoretical framework and practical limitations of the EGG recording and analysis procedure.
2.3.1 Electrodes and electrode placement
In order to measure and record potentials and, hence, currents in the body, it is neces-sary to provide some interface between the body and the electronic measuring apparatus. Biopotential electrodes serve this purpose mainly as electrochemical transducers between the closed-line action currents generated by specific body organs and the electrical currents required by the recording set-up. A half-cell potential is generated when putting a metal in contact with a solution (electrolyte) containing ions of that metal. This potential is de-termined by the metal involved, the concentration of its ions in solution, the temperature and other second order factors. Essentially, neutrality of charge is not maintained at the electrode-electrolyte interface producing the half-cell potential. A double layer of charge evolves at the interface as well.
In electrode circuit models, this half-cell potential is represented as a battery, and the characteristics of the double layer of charge are lumped together as a capacitor. A resistor