AN ALTERNATIVE EMPLOYMENT STRATEGY FOR RURAL YOUTH
by
GERTRUDE ANN JAMISON-HODGES
B.S., Columbus College (1974)
SUBMITTED IN PARTIAL FULFILLMENT OF THE REQUIREMENTS OF THE
DEGREE OF
MASTER OF CITY PLANNING
at the
MASSACHUSETTS INSTITUTE OF TECHNOLOGY
Gertrude Ann Jamison-Hodges 1979
The author hereby grants to M.I.T. permission to reproduce and to distribute copies of this thesis document in whole or in part.
Signature of Autho'7
Department r n Studie ind Planning
iB'~cember 18, 1979 Certified by Accepted by Karen Polenske Thesis Supervisor Langley Keyes
Chairman, Departmental Graduate Committee
MASSACHUSETTS INSTITUTE
OF TECHNOLOGY
MAR 19 1931
TABLE OF CONTENTS ABSTRACT ACKNOWLEDGEMENTS LIST OF FIGURcS LIST OF TABLES CHAPTER INTRODUCTION
I. PART I - ural Development in the United States 4
Population 6
Income and Employment 7
Health 16
Housing 17
Education 18
Conclusion 21
PART II - Past Employment Training Policy 23 Manpower Development and Training Act of 1962 24
Employment Opportunity Act of 1964 26
Neighborhood Youth Corps 28
Job Corps 28
Emergency Employment Act of 1971 31
Comprehensive Employment Act of 1973 32
Summary 35
II. PART I - The Youth Employment and Development Centers 40
Target Group 44
Program Design 45
Program Administration 58
Program Munagement 59
PART II - Justification of Design 62
Conclusion 68
FOOTNOTES 69
AN ALTERNATIVE EMPLOYMENT STRATEGY FOR RURAL YOUTH
by
Gertrude Ann Jamison-Hodges
Submitted to the Department of Urban Studies and Planning on December 20, 1979 in partial fulfillment of
the requirements for the Degree of Master of City Planning
ABSTRACT
This thesis proposes an alternative employment strategy that was designed by and for rural youth. The strategy is couched in what is being called Youth Employment and Develop-ment Centers (YEDCs). The strategy takes the form of an
employment training program, but, in fact, is much more. Em-ployment and training are both provided in the program design. However, the unique feature is that they are provided in an environment that was constructed by rural youth in Mississippi. Furthermore, employment and training are only a portion of the array of services provided by YEDCs. The YEDCs are to be, basically, a youth-operated project providing supportive
services to youth. The YEDC concept contends that, if rural youth are to be integrated into the labor economy, their
whole environment must be impacted to include their families, their schools, and their communities.
The YEDCs proposes, as part of its operational concept, to increase the employability of rural youth by providing intervention mechanisms for altering existing systems as well as increasing youth employability through the provision of employment development services.
Thesis Supervisor: Karen Polenske
TItle: Associate Professor or Urban and Regional Studies
ACKNOWLEDGEMENTS
I am grateful, first, for the blessing of the divine spirit that made this thesis a reality. My sincere appreciation is extended to my
thesis committee-- Mary Anderson, Karen Polenske, and Lisa Peattie --for their support, direction and encouragement. I'm indebted to my
daughter, Keneisha, for the opportunity cost she paid while I worked us through this whole experience, I'm grateful to her for the strength
she exhibited and the love she gave me along the way. May we share
endless days of joy for our sacrifices. My gratitude is extended to my family who always beleive in me.
List of Tables and Figures
Table 1 Mississippi Population
Table 2 Median Family Income by Race and Ratio of Black to White Income, 1970
Table 3 Mississippi Youth Labor Force Participation Rates
Table 4 Mississippi Labor Force by Age, Race and Sex FY 1979
Table 5 Mississippi Youth Unemployment FY 1979
Table 6 Median Years of School Completed for Persons 25 or Older, By Race, 1960 - 1970
Table 7 Enrollment and Expenditures, Federal Manpower Program, Fiscal Years 1963 - 1974 Figure Figure Figure Figure Figure
1 Location of Black Managed Towns by Planning and Development Districts
2 Program Phase-In
3 Program Component Client Service Design 4 Administrative Structure 5 Organizational Chart
Pages
8 10 12 14 15 19 36 42 47. 48 60 61 iiiINTRODUCTION
This thesis is about an alternative employment strategy designed by
and for rural youth. The strategy is couched in what is being called
Youth Employment and Development Centers (YEDCs). The strategy takes the
form of an employment training program, but, in fact, is much more.
Employment and training are both provided in the program design. However,
the unique feature is that they are provided in an environment that was
constructed by rural youth in Mississippi. Furthermore, employment and
training are only a portion of the array of services provided by the
YEDCs. The YEDCs are to be, basically, a youth-operated project providing
supportive services to youth. The YEDC concept contends that, if rural
youth are to be integrated into the labor economy, their whole
environ-ment must be impacted to include their families, their schools, and
their communities.
The thesis is presented in two main chapters. Each chapter has
two parts providing a full perspective on the chapter's focus. Chapter
I, Part I, provides the rural context for looking at the YEDCs. A scenario
of rural life is presented by contrasting and comparing rural life from a general perspective in the United States to rural life in Mississippi,
in particular, the areas the YEDCs seek to operate in. Chapter II, Part
II, follows up with the employment and training programs that have attempted
in this examination of employment and training policy is an analysis that speaks to their success and failure.
The objective of Chapter II is to provide a detailed description of the YEDC program. Chapter II, Part I reveals how the YEDC concept
came about and the activities that led to its inception. Included is
a description of the YEDC component activities. Chaper II, Part II,
questions the YEDC approach and presents a justification of the program design. The exemplary features of the YEDC design are noted and a framework for analyzing the effectiveness of the program design is
given.
The YEDC approach is not entirely a new concept. It borrows from
the employment training models established under the Manpower Development and Training Act of 1962 (MDTA) as expounded in Chapter I, Part II. The YEDC approach takes the process one step farther than prior models. It
seeks to alter and to intervene into youth lives to effectuate a change--a chchange--ange in youth change--and the environment they live in.
CHAPTER I
Chapter I presents the contextual background for looking at the
YEDC concept. Presented is the rural environment that the YEDC will find
its place in. Additionally, the programs that have sought to address
CHAPTER I PART I
Rural Development in the United States
James L. Walker in "The Current Structure and Dimensions of
Rural Poverty in the South" maintains that poverty is a disproportionately
Southern phenomenon based on the incidence of poverty being 50 percent
higher in the -outh than for the nation in 1970. In short, the South's rate was twice that of the non-South at the time of the 1970 census.1
Part of this can be attributed to the South's continued reliance on
agri-culture in a large rural society. In the wake of accelerating inflation
and rising unemployment, the plight of the Southern poor darkens. So we
see that to talk about poverty in rural America is a discussion of poverty
in the South.
In recent years the South has undergone more socio-economic changes
than any other region of the United States. This contention was supported
by a study conducted by the Southern Regional Council in 1975. The long process of conversion from a traditionally low-wage agricultural society
to one which participates increasingly in the moderate wage manufacture
of goods and services, together with the effort to eradicate longstanding
discriminatory practices, has indented the poverty stronghold.
Despite the recent strides the South remains profoundly poor.
The 1970 Census showed that the South (Alabama, Arkansas, Florida, Georgia,
Kentucky, Louisiana, Maryland, Mississippi, North Carolina, Oklahoma,
45 percent of the nation's poverty population though it contains roughly
30 percent of the nation's population.2
Within the South, there is a discrepancy between states and their level of well being. Of particular interest is Mississippi, the location of the proposed Youth Employment and Development Centers (YEDC's).
Miss-issippi is predominantly a rural state. The state, however, is not governed by the rural dwellers who are in a majority, rather life is governed by the urban centers. Depending upon how you define urban, there are roughly
four urban centers in the state, including Jackson, the capital of
Mississippi. These centers serve as life lines to the rural areas. It is in the urban centers where the major economic activities take place. While the urban centers serve as umbilical cords for the pocket communities, they
also serve as a funnel that draws the labor resources from the pocket
com-munities. Additionally, the urban centers monopolize federal and state attention in terms of funding allocations. State economic development
efforts are 'targeted' to "best bet" areas. "Best bet" areas are those
areas that show good potential of similating urban life in the short run. Rural life in Mississippi is different than rural life in the Northwest or East of the U.S. or developing countries' rural areas.
Rural Mississippians are caught in static poverty. Static poverty that began with the technical transformations in the agricultural economy
but has been stagnated by 'benign neglect' imposed by urban bias and racial discrimination. Another feature of rural Mississippi that places Mississippi in a class of its own is its proportion of black population to white,
There are primarily two races--black and white. A few American
Indians and Asians spot the state but not in significant numbers.
Mississippi is roughly 50:50 in black-to-white population. Mississippi
has a higher percentage of blacks than any other state. The black
popu-lation is concentrated in the Delta part of the state and in and around
the capital, Jackson. The black population is concentrated in the more
agricultural areas of the state. 1970 Census data reported that 46
percent of the black population were rural nonfarm. This indicates that
there were larc numbers of blacks in rural areas on or off the farmland
who depended on some way of life other than farming to survive. Less
than 5 percent of blacks are farmers and farm managers. From 1960 to
1970 black employment in agriculture dropped 72 percent. 41 percent of the black farmworkers from 1965-1970 were counted as not in the labor
force meaning that they had not found a way to earn a living.
To substantiate the claims of poverty in rural America,
parti-cularly the rural south with attention given to Mississippi, an
examina-tion of rural life and its implicaexamina-tions for youth is presented. I will
review rural life in terms of Population, Income and Employment, Health,
Education, and Housing.
Population
The rural population in the U.S. has remained at about the same
level, 54 million, for the past five decades. In 1973, 40 percent of
the nation's poor lived in rural areas a share far greater than the rural
population was composed of farm people in 1920; by 1970, the proportion was
only one-fifth and today even less. Decline in agriculture employment has
accounted for outmigration of the farm population.
The total population in the target area as of 1970 was nearly 22,000.
Census data of 1978 reports that youth between the ages of 14 and 24 totaled
5,100 or 23 percent of the population in the target towns. Youth 16-21 years of age make up 17 percent of the total population, or approximately
3,825 persons. The Black population constitutes 65-99 percent of these communities.
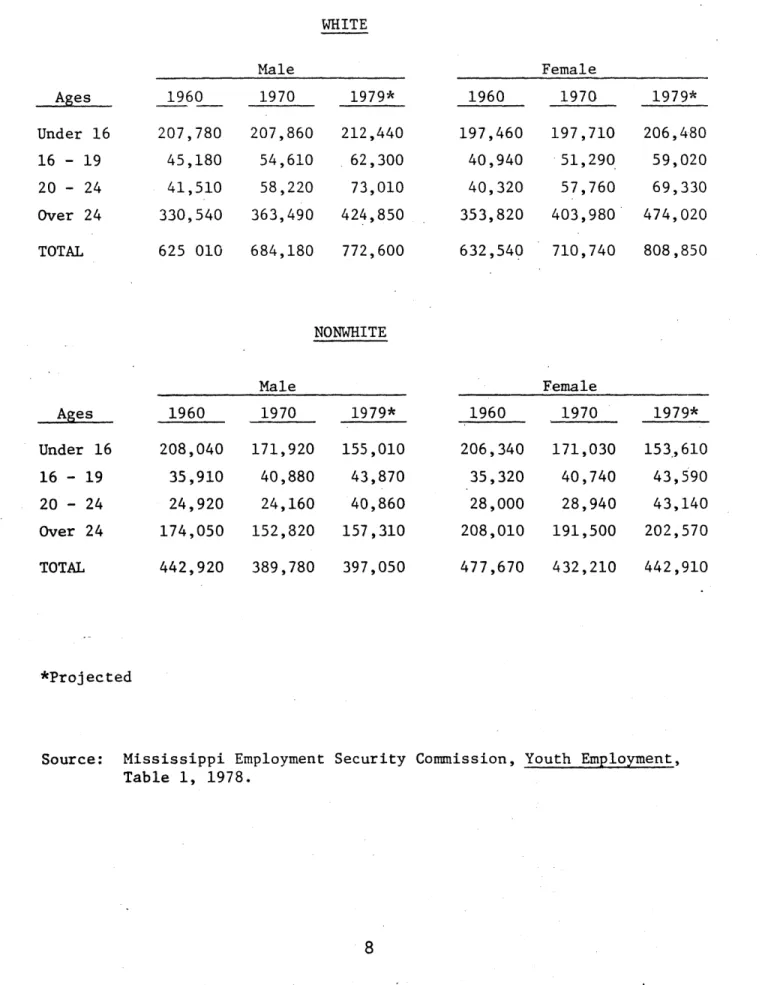
In terms of sheer numbers alone youth are making their presence known
in Mississippi. According to the Mississippi Employment Security Commission,
Mississippi's youth population has risen from less than 300,000 in 1960
to a projected total of over 435,000 for Fiscal Year 1979. (See.Table 1,)
The proportion of youth within the total population of the state hasalso
increased dramatically. Whereas the 16 to 24 age bracket accounted for
only 12.4 percent of the populace in 1960 and 16.1 percent in 1970, it is anticipated that the proportion will reach 18.0 percent for FY 1979.
The increasing number of youth makes it necessary that Mississippi began
to think seriously about how youth can be integrated into the labor economy.
Income and Employment
There is a general lower level of income in rural areas than compared
with urban areas. Even within the rural frame, poverty prevails among
certain groups more than others.
Poverty has been substantially more prevalent among the minority
population than among the total population, and greatest of all among
Table 1 MISSISSIPPI POPULATION WHITE Male 1960 1970 1979* 207,780 207,860 212,440 45,180 54,610 62,300 41,510 58,220 73,010 330,540 363,490 424,850 625 010 684,180 772,600 Female 1960 1970 1979* 197,460 197,710 206,480 40,940 51,290 59,020 40,320 57,760 69,330 353,820 403,980 474,020 632,540 710,740 808,850 NONWHITE Male 1960 1970 1979* 208,040 171,920 155,010 35,910 40,880 43,870 24,920 24,160 40,860 174,050 152,820 157,310 442,920 389,780 397,050 Female 1960 1970 1979* 206,340 171,030 153,610 35,320 40,740 43,590 28,000 28,940 43,140 208,010 191,500 202,570 477,670 432,210 442,910 *Projected
Source: Mississippi Employment Security Commission, Youth Employment, Table 1, 1978. Ages Under 16 16 - 19 20 - 24 Over 24 TOTAL Ages Under 16 16 - 19 20 - 24 Over 24 TOTAL
that almost 60 percent of the minority persons in the most rural county had
incomes below the low-income threshold. 4
The income variation in rural areas is most noticeable in the South.
As previously stated, the rate of southern poverty differs considerably from
the rate of poverty in the rest of the U.S. There is also a great variation
in income distribution among Southern states. In 1970, the national median
family income was $9590. Mississippi and Arkansas had median incomes
appro-ximately 65 percent of the national median and ranked considerably below
the plurality >f Southern states which fell within the range of 75-90
per-cent of the national figure. (See Table 2.)
In 1975 when the country was experiencing a per capita personal income
(in dollars) of $5,852, Mississippi was at $4,044. The participating towns
are in counties that registered a low per capita personal income of $2,598
to a "high" of $4,479. Hinds County, the home of the state capitol, Jackson,
and the spoke of industrial development in the State, experienced a per
capita personal income of $5,622.
The wage earnings of rural Mississippians is indicative of the
employ-ment structure in the area. There are few manufacturing and industrial
job opportunities in and around the Delta region of Mississippi. The Delta is commonly characterized by its desolate, economically deprived condition.
Like many other areas in the South, the Delta for over 200 years relied on
agriculture, an agrarian economy, to serve as its economic base. The
monumental flight from the farm to the city left only those who could not
leave - the young, the old, and the very poor. The flight literally drained the Delta of needed human resources.
Table 2
MEDIAN FAMILY INCOME BY RACE AND RATIO OF BLACK TO WHITE INCOME, 1970
Black as %
Total White Black of White
Alabama $7,266 $8,208 $4,048 49.5% Arkansas 6,273 6,828 3,455 51.0 Florida 8,267 8,818 4,983 56.9 Georgia 8,167 9,179 4,743 51.8 Kentucky 7,441 7,604 5,128 68..0 Louisiana 7,530 8,820 4,004 45.6 Maryland 11,063 11,635 7,701 66.2 Mississippi 6,071 7,578 3,202 42.3 North Carolina 7,774 8,507 4,803 56.6 Oklahoma 7,725 8,003 4,529 61.2 South Carolina 7,621 8,761 4,444 50.8 Tennessee 7,447 7,872 4,839 61.7 Texas 8,490 8,930 5,334 60.4 Virginia 9,049 9,767 5,742 59.1 West Virginia 7,415 7,494 4,851 65.7 United States $9,590 $9,961 $6,067 63.3%
Source: U.S. Bureau of the Census, Census of Population: 1970, GENERAL SOCIAL AND ECONOMIC CHARACTERISTICS, state volumes, PC(I)-C series, Table 57. Taken from the
"Current Structure and Dimensions of Rural Poverty in
The decade of the sixties saw an accelerated movement of
manufactur-ing into the region, and within some states growth in higher-paymanufactur-ing
ser-vice industries (finance, insurance, and real estate; professional and
related services; and public administration) was substantial. However,
employment opportunities in the region are still more concentrated than
those of the more mature economy of the nation as a whole in low-wage
extractive and light manufacturing industries. And, despite the fact
that employment growth and industrial diversification have improved,
labor force utilization in the evolving Southern industrial structure is
still imperfect. Also, despite progressive trends, the South still has
a greater proportion of its labor force employed by the agricultural
industry than does the rest of the nation.
There are limited data available on the employment situation of youth
in the target areas, however, county and state data on youth should
provide some evidence of their situation. According to 1977 employment
data from the Mississippi Employment Security Commission, all the counties
included in the program (with the exception of Hinds) experienced high
unemployment during this period. When the state unemployment rolls were
at 7.4 percent in 1977, the participating town's county unemployment
exceeded 9 percent. The percentages were higher in the individual target
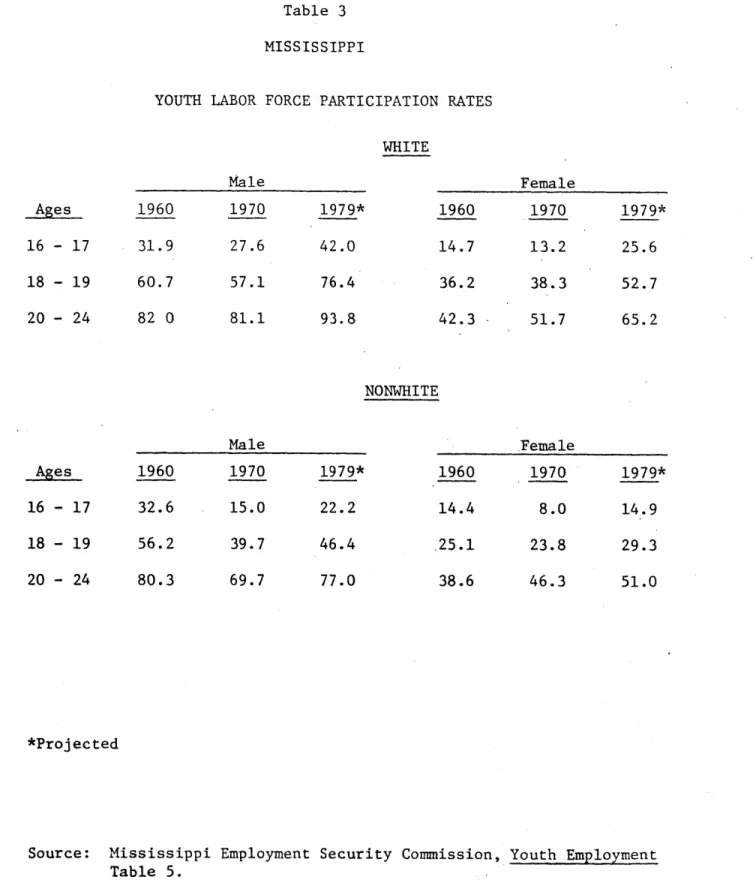
town. Despite the high unemployment, all segments of the youth population
have shown significant increases in the degree of labor-force participation
since 1960 except Black (non-white) males. (See Table 3.)
It is estimated that for FY 1979, nearly one out of every four per-sons in Mississippi's labor force will be between 16 and 24 years of age.
Table 3
MISSISSIPPI
YOUTH LABOR FORCE PARTICIPATION RATES
WHITE Male Ages 16 - 17 18 - 19 20 - 24 1960 31.9 60.7 82 0 1970 27.6 57.1 81.1 Female 1979* 42.0 76.4 93.8 1960 14.7 36.2 42.3 1970 13.2 38.3 51.7 1979* 25.6 52.7 65.2 NONWHITE Male 16 - 17 18 - 19 20 - 24 1960 32.6 56.2 80.3 1970 15.0 39.7 69.7 Female 1979* 22.2 46.4 77.0 1960 14.4 .25.1 38.6 1970 8.0 23.8 46.3 1979* 14.9 29.3 51.0 *Projected
Source: Mississippi Employment Security Commission, Youth Employment Table 5.
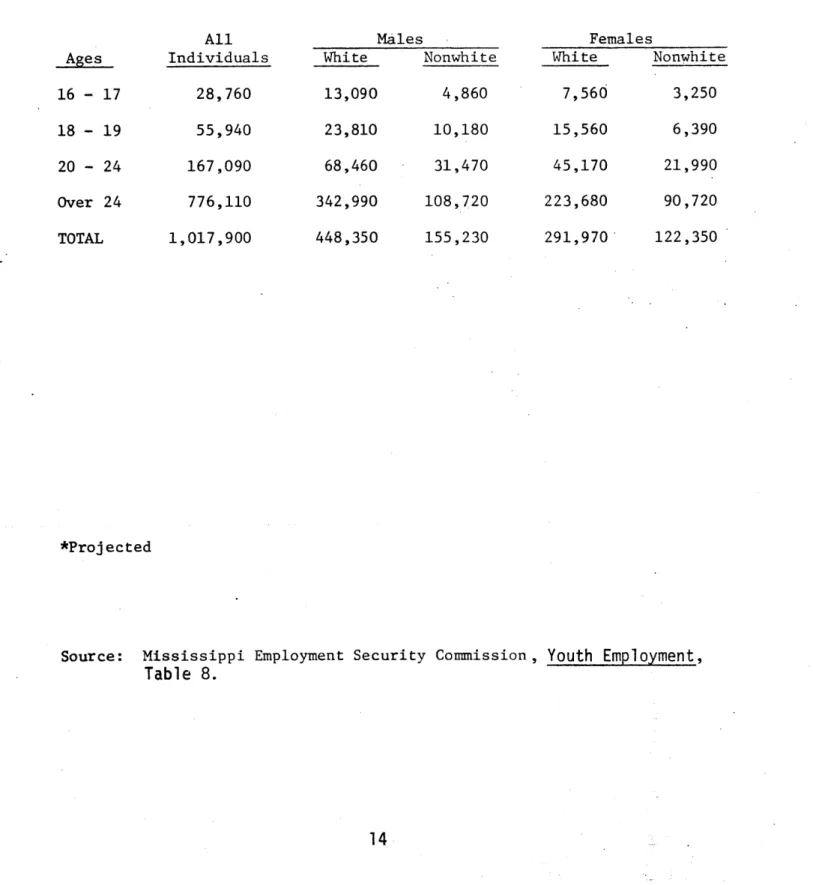
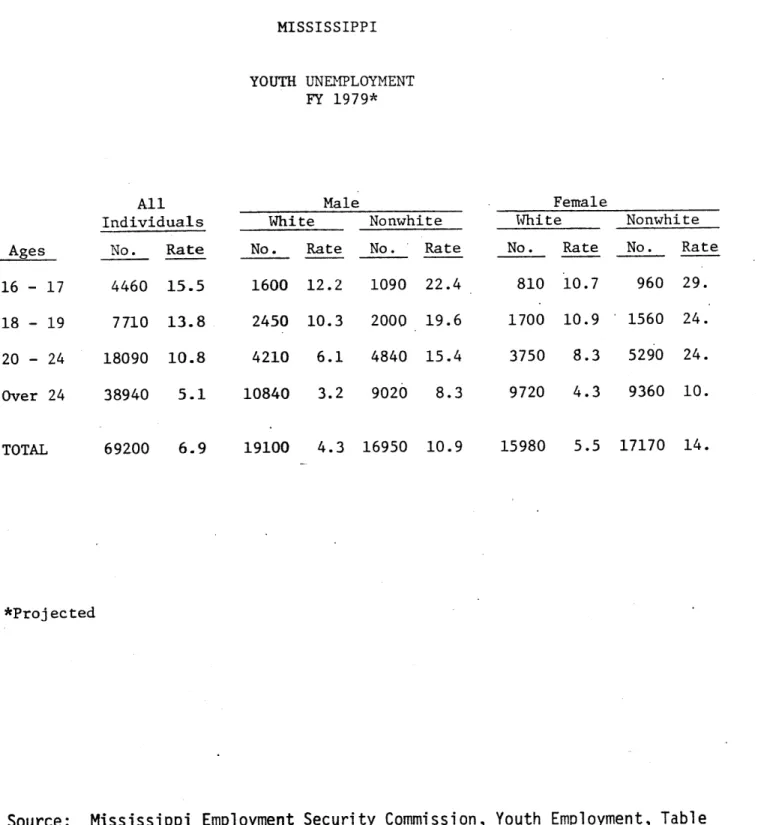
Of these youth over 78,000 will be minority race members while nearly 100,000 will be females. (See Table 4.) It is further estimated that the unemployed segment of the labor force will number some 69,200. Persons
under the age of 25 will account for over 30,000 of the jobless, a highly
disaproportionate 43.7 percent of the total. This can be partially
explained by the fact that the youthful worker generally is less skilled,
less experienced,and has little job seniority. When job layoffs occur,
youths are often among the first to go. For similar reasons they are
among the last to be reemployed. As a result, unemployment rates for
youth are considerably higher than for older workers. The rates are
pro-jected to range from 10.8 percent for 20 to 24 year olds, to 13.8 percent
for 18 to 19 year olds and 15.5 percent for the 16 to 17 year age group.
White youths should have slightly lower unemployment rates while minority
races and females will tend towards even higher rates. (See Table 5.) Youth unemployment rates are also apt to range much higher during summer
months due to the influx of students into the job market. Even when the
economy is healthy, there are simply not enough jobs available to
accom-modate all the young people who want to work while school is out. It
is projected that some 91,510 different youths who want to work will be
out of a job at some time or other during FY 1979. Over half of these
will be minority group members, nearly half will be females.
Based on past trends, it is also anticipated that a solid majority
of youths will not work a full year during FY 1979. Only about 20.0 percent will work for 50 weeks or more. About 15.6 percent will work for
three months or less and two out of five will not work at all during
FY 1979. Smaller proportions of both females and minorities will be fully 6
Table 4
MISSISSIPPI
LABOR FORCE BY AGE, RACE AND SEX FY 1979* All Individuals 28,760 55,940 167,090 776,110 Males White Nonwhite 13,090 4,860 23,810 10,180 68,460 31,470 342,990 108,720 Females White 7,560 15,560 45,170 223,680 1,017,900 448,350 155,230 291,970 122,350 *Projected
Source: Mississippi Employment Security Commission, Youth Employment, Table 8. Ages 16 - 17 18 - 19 20 - 24 Over 24 TOTAL Nonwhite 3,250 6,390 21,990 90,720
Table 5 MISSISSIPPI YOUTH UNEMPLOYMENT FY 1979* All Individuals White Male Nonwhite Female Nonwhite
No. Rate No. Rate No. Rate
4460 15.5 7710 13.8 20 - 24 18090 10.8 1600 12.2 1090 22.4 2450 10.3 2000 19.6 4210 6.1 4840 15.4 Over 24 38940 5.1 10840 3.2 9020 69200 8.3
No. Rate No. Rate 810 10.7 960 29. 1700 10.9 - 1560 24. 3750 8.3 5290 24. 9720 4.3 9360 10. 6.9 19100 4.3 16950 10.9 15980 5.5 17170 14. *Projected
Source: Mississippi Employment Security Commission, Youth Employment, Table 3. Ages 16 - 17 18 - 19 White TOTAL
The income and employment data suggest that there needs to be a
particular focus on black youth if they are to enter the labor force in
Mississippi. It appears that white youth are finding channels into the
labor economy. A channel must be provided for rural black youth in
particular because their situation is compounded by the barriers of rural
poverty.
Health
Rural people, in general, suffer from the lack of health care due
to the inequities in medical provisions in this country. There are fewer
properly equipped facilities in rural areas, making it difficult to attract
physicians to these areas. Furthermore, rural practice does not afford
physicians the glamor of specialization. The bulk of rural health care
needs evolves around preventive and social medicine (nutrition, hygiene,
family planning and so on.) These needs could generally be met by a
com-petent paramedical professional. The fact that health services are located
primarily in urban areas lessens the chance of rural people being served.
Research shows that as a sufferer's distance from the source of medical
health increases, the chance that he/she will seek treatment decreases
at a much faster rate, because transportation is too costly and unpleasant,
especially for the.rural poor and ill.7
The need for health care for youth can be seen when viewing
communi-cable diseases prevalent among them. In Mississippi in 1978, venereal
disease among youth outnumbered all other communicable diseases combined.
This indicates, in part, that youth are not receiving adequate, efficient.
Again, with roughly 30 percent of the nation's population, rural
America has the services of 12 percent of the doctors and 18 percent of
the nurses. For the whole nation, there is a doctor for every 665 persons.
In the cities there are only 500 persons per doctor. In rural America,
there are 24,000 persons per doctor. Since 1963, the number of counties
without a single physician has increased from 98 to 135, and in many
counties the number of doctors has declined. The "no doctor" areas include 4 percent of the nation and one-half million people.
The ineqLitable distribution of medical services and care is evidenced in the infant mortality rate. Infant motality rates are related,
accord-ing to the 92nd Congressional hearaccord-ing on rural life, to both place of residence and level of income, and the rate is highest in the most rural
and poverty stricken areas. Even in the high per capita income States,
the most rural counties have an infant mortality rate nearly 7 percentage
points above the national average for that group of states. For nonwhite
infants in rural counties, even in the high-income States, infant mortality
rates are more than twice as high as for all infants in rural counties.
In addition to the scarcity of health services, medical costs are
be-yond the financial capabilities of rural people. From 1967 to 1971,
medical costs rose an average of 6.6 percent a year, and in 1974 it rose at a rate of 18 percent. 8
Housing
Rural areas contain 60 percent of the total substandard units in America. Much of the housing in rural America is bad. Surveys in 1970
falling down- and about 2 million were classified substandard mostly
because of inadequate plumbing. Compounding the structural problems,
about 30,000 rural communities lacked waste disposal systems. It is
doubtful that conditions have changed much since then because of the
continued low incomes of most people who live in bad housing.
Another serious rural housing problem is the persistently bad
con-dition of rural housing occupied by Black population. In 1971, 75
per-cent of Black housing were substandard compared with 85 perper-cent in 1960.
In rural areas, Black families occupy almost a third of the substandard
units. Most of the units they lived in were rented.
Education
Rural Americans have historically been shortchanged by the educational
system serving them. The dismal failure of State and Federal policy to
affect even minimal standards of education in rural areas is evidenced
by the fact that in 1970, over 2 million rural adults had less than 5 years of schooling. For minorities, comparable figures are even more
appalling - 24 percent of the Black population had left school by the~
fifth grade. The figures for Mexican Americans and American Indians are
much higher. Across all segments of the adult rural population,
illit-eracy rates are nearly twice those found in urban areas. 9
In 1970, the national median number of years of school completed for those 25 years or older was 12.1. In only three Southern states
--Florida, Maryland, and Oklahoma -- was the national median realized. In all other Southern states, average educational attainment was less,
- Table 6
MEDIAN YEARS OF SCHOOL COMPLETED FOR PERSONS
25 OR OLDER, BY RACE, 1960 AND 1970
Alabama Arkansas Florida Georgia Kentucky Louisiana Maryland Mississippi North Carolina Oklahoma Tennessee Texas Virginia West Virginia United States 1960 Total Nonwhites 9.1 6.5 8.9 6.5 10.9 7.0 9.0 6.1 8.7 8.2 8.8 6.0 10.4 8.1 8.9 6.0 8.9 7.0 10.4 8.6 8.8 7.5 10.4 8.1 9.9 7.2. 8.8 8.4 10.6 8.2 1970 Total Blacks 10.9 8.5 10.5 7.9 12.1 8.8 10.8 7.9 9.9 9.3 10.8 7.9 12.1 9.9 10.7 7.5 10.6 8.5 12.1 10.2 10.6 8.7 11.6 9.7 11.7. 8.6 10.6 9.5 12.1 9.8
Source: U.S. Bureau of the Census of Pupulation: 1970, GENERAL
SOCIAL AND ECONOMIC CHARACTERISTICS, U.S. Summary, PC(1)-Cl, Table 88 and state volumes, PC(l)-C series, Table 51;
1960: U.S. Summary, PC(l)-lC, Table 115. From the "Current
Structure and Dimensions of Rural Poverty in the South ," pg. 14.
Many rural children are being denied an equal educational oppor-tunity - 5.3 percent of the school age children living in rural areas
10 were not enrolled in school compared with 3.8 percent in urban areas.
Absenteeism is also very high among rural farm children. This is
attri-buted to several factors. Farming families are often forced to pull
their children out of school at harvest time. Children of migrants are constanitly uprooted and moved from town to town as their parents seek employment. Because of poor health services, children are frequently
absent from school due to poor health car. Poor rural families cannot always afford lunch or adequate clothing, and many schools 'do not pro-vide free lunches. Thus, the rural child is hungry and his/her ability
to learn is hampered.
Exacerbating the employment problem is the literacy level of the
local residents. Mississippi County data in 1970 suggest that the median school years completed ranged between 8.2 years to 12.3 years. The
majority of the counties included in our focus had a median school year
11
completed of 8.2 years to 8.7 years. The literacy level suggests that even if the employment picture were brighter, few of the rural residents would be prepared to accept skilled employment due to the limitations posed by illiteracy alone.
Rural schools suffer from insufficient revenues. This results in
poor curriculums, inadequately trained and overworked teachers, low
salaries, limited facilities and materials, and a lack of counseling and guidance. In fiscal year 1973, $70 million were allocated for
education-ally deprived migrant children from the Department of Health, Education and Welfare (HEW). Ninety-two percent of these dollars went to
is derived from the local property tax in the United States. This form
of support poses great difficulties for rural areas in financing schools.
Rural real estate is often low in aggregate value, and even then, under-12
assessed.
The effects of failure in the education system - illiteracy, lack of marketable skills, lost opportunity, low achievement, and a limited
capacity for self government have had a crippling effect on the society
and on the lives and aspirations or rural children and adults.
Conclusion
The state of rural America is an embarrassing situation for an
economy such as ours that boasts prosperity and ranks high among the
leading industrial nations of the world. Serious questions must be raised
regarding our negligence in confronting the rural dilemma. The politics
of neglect has produced a subculture of poverty-ridden communities. It
behooves urban America to take a more serious look at their rural
counter-part for all Americans have a high stake in rural development or decline.
For the problems which many rural areas are experiencing are directly
connected to those of cities and suburbs. Changing patterns of life in rural America have changed the character of life in all of America.
Rural migrants forced from the farm by technological change flood the
urban areas adding to the weight of already faltering tax structures, for
rural people have to seek state-supported help if they are to survive in
urban areas. In 1971, Senate hearings noted that migrants to urban areas
of rural origin were more likely than nonmigrants or migrants of urban
The question is, what strategy will break this poverty cycle and
improve the condition of rural America. This thesis suggests that the
answer lies in rural youth. We must find ways to develop and retain
youth resources in rural areas. The proposed Youth Employment and
Develop-ment Center prepared for the Mississippi Conference of Black Mayors
pre-sents a scheme that focuses on rural youth and takes into account their
existing situation. The program provides alternatives that assures youth
that they do not have to leave their community to find a place in society.
Furthermore, tLa program increases their potential productivity, making it
possible for youth to contribute to economic development. A review of
past employment-training programs show that there exists a need to
approach rural-youth unemployment from a different policy perspective.
Part II presents a summary of education and training programs that have
CHAPTER I
Part II
There have been several employment and training policies in the past
that sought to address the issue of poverty and unemployment in the
American economy to include rural areas. Rural areas were not the major
focus of concern, however, but received some benefit from these employment
training policies.
Government did not begin to take a role in dealing with employment
problems in the U.S. until 1921. Even then its role was limited to
financing vocational education, and to a limited extent, it monitored
the apprenticeship program in the skilled trades. The Manpower
Develop-ment and Training Act of 1962 was the first major employDevelop-ment training
legislation. There were work-generating employment and training programs
prior to MDTA but their legislation was motivated by different objectives.
For example, the Works Progress Administration-later renamed Work Projects Administration (WPA) - was established in 1935 to administer a "make-work" program in response to the Great Depression. It was a economic
development program designed to stabilize a total economy. The Area
Redevelopment Act of 1961 was designed to stimulate economic growth in
areas that were experiencing high unemployment. The agenda was not
directed toward increasing employment opportunities for subgroups who
were consistently unemployed or underemployed.
MANPOWER DEVELOPMENT AND TRAINING ACT OF 1962
Not until the second round of employment policy, beginning with the
Manpower Development and Training Act (MDTA) of 1962 did the government, in
its original intent, pass policy aimed at retraining and redistributing the
labor force by improving the employability of subgroups. It also provided
some assurance of an adequate labor supply for the economy. Congress
authorized $100,000,000 for the first program year (1963). During its early days MDTJ began to fall short of its objectives. In the beginning,
eligibility for admission to training was restricted to unemployed heads
of households with three years of work experience. MDTA assisted primarily
-those unemployed persons who were the most qualified and most experienced;
initially, it failed to address sufficiently the critical problems of the
long-term unemployed. 13
Early MDTA training was offered in the framework of institutional
training (classroom instruction). Instruction was provided for such
occupations as auto mechanics and repair, general machine operation,
welding, typing, stenography, general office assistance, and cooking--.
occupations already in demand. Little was done to forecast labor demands.
Shortly after MDTA Institutional Training was initiated, the rate
of unemployment lessened and, with it, some of the widespread fear that
advanced technology would prove devastating to the U.S. job market. But
another, larger social change--the civil rights movement--was underway,
disadvantaged. Those concerned with the training programs turned their
attention from the composition of the job market to the components of the job force and recognized that MDTA institional training was reaching only a fraction of those who most required assistance.
One attempt to answer the insufficiency of MDTA Institutional Train-ing came in 1965, durTrain-ing the "war on proverty" era, in the form of MDTA On-the Job Training (OJT). The OJT program was devised to place
enrollees in jobs and to subsidize skill training as the new employees
worked. OJT enlisted the cooperation of private employers and employer associations in an attempt to coordinate the public and private sectors
of the labor market for the purpose of aiding the poor. In terms of
assured employment to enrollees, OJT was, by nature, more successful
than its MDTA Institutional counterpart. But, because persons were hired
at the discretion of employers, those applicants who lacked education, skills, or. familiarity with a working environment were hired last. In a
further effort to encourage private employer involvement in programs for the disadvantaged, OJT funding was transferred in 1968 to the National Alliance of Businessmen (NABS). The NABS-JOBS (Job Opportunities in the Business Sector) program which resulted from that merger appealed to employers for reasons of publicity, profit, and budgeting advances, 1 4a
well as by reason of their interest in aiding the disadvantaged. The number of jobs initially pledged greatly exceeded expectations, just as
the number of pledges also exceeded the number of actual placements. It
became increasingly apparent that more placements must be made and
NABS-JOBS to achieve any real success. While few argue with the concept of NABS-JOBSmany have criticized its operational procedures and the
ultimate practicality of a program dependent upon conditions of labor
shortage in particular work environments. Few employers are able, even
when willing, to hire disadvantaged minority members at the expense of
established employees. Even so, the special efforts under JOBS in 1972
resulted in two-thirds of the placements being persons who were.either
Black or had Spanish surnames. NABS-JOBS has not yet become a program 15 that creates new jobs as the result of expanded productivity. It
re-mains, essentially, a labor redistribution program,which offers some
assistance to a limited number of disadvantaged workers. And so, as it
was, the needs of rural youth was not a priority under the MDTA. The
thrust of MDTA was focused on adult wage earners. Further, MDTA did not
have a community level focus.
EMPLOYMENT OPPORTUNITY ACT (EOA) OF 1964
This act was designed specifically to provide the funds necessary
to develop programs that would help the disadvantaged overcome their
employment problems. Under this Act the youth employment problem in the
U.S. drew attention.
The two main programs for the training and employment of youth were
the Neighborhood Youth Corps and the Job Corps. The engrained
theore-tical concepts in this act approached unemployment for youth from two
perspectives. Primarily, the thought was that youth were unemployed
were unemployable due to their lack of discipline and acceptance of the world of work. What was needed was an arena to "teach" people about
work as well as provide a work environment. The other contention was
that some unemployed persons were job ready in terms of their
understand-ing the world of work but had not had the opportunity to 'practice'
employment. Both of these contentions were approached under the EOA.
The Neighborhood Youth Corps (NYC), and the Job Corps, established
in 1965 by authority of the Economic Opportunity Act, were aimed directly
at disadvantaged young people. NYC was based on the hope that low-income
high school students provided with temporary employment might be enabled
to remain in school. The Job Corps was founded on the premise
that-young people should be given the chance to move from environments so
deprived or so disruptive as to hinder their successful incorporation
into the labor force. Both suppositions have been challenged--the former
because the high school dropout rate has been shown to increase during 16
periods of high employment , and the latter because there are those who support the contention that cultural deprivation does not adversely
affect learning capability. The Job Corps and NYC have been charged with serving more as temporary depositories for troubled, sometimes
trouble-some, youth than as valid labor mechanisms. On the other hand, some
young people have benefited substantially from the programs so that
examination of positive as well as negative aspects of each is appropriate.
NEIGHBORHOOD YOUTH CORPS
The Neighborhood Youth Corps, largest federal training program for
youth, was designed to provide remedial education and work experiences
for poor high school students (in-school and summer programs) and for
high school dropouts aged sixteen or over (out-of-school program). NYC
was conceived as a wage subsidy program and, at the outset, provided
little skill training. Because it was directed toward persons in
adolescence, a growth period of limited duration, employment
opportuni-ties were devised to be temporary and the rate of NYC turnover was
exceedingly high. Short enrollment periods, however, did not appear to 17
adversely affect the employment futures of the trainees, and proponents
of NYC argued that the orientation of disadvantaged youth to working
environments eased their ultimate transition to adult labor force
parti-cipation,while the minimum wages paid to program enrollees eased their
financial burdens. From its inception, NYC successfullytargeted the
disadvantaged, with approximately equal representation of males and
females, blacks and whites. And, since 1965, the NYC program design
developed has increased its focus on skill-training and supportive
services. NYC job training opportunities have been extended to private
industry, and the summer program,which provided little training,
counse-ling or remedial educationhas been discontinued.
JOB CORPS
The Job Corps, as a prgram of intensive residential training and
"war on poverty". It offered to disa:.;ntaged young people, at rural
conservation centers on public lands - at urban centers operated by private or non-profit organizations, a program of work, education, and counseling designed to ready enrollee: For labor-force participation.
Evaluations of the Job Corps show that the program has successfully recruited the disadvantaged (100 percent of 1973 Job Corps participants
18 came from families of proverty status and 59 percent were black ), but
it has failed to retain them. In a program where much of the training can be completed in nine months and where the maximum skill training period is two years, average enrollment has been for a period less than
seven months. Youth were not staying in the program long enough to
com-plete a skill-training phase. High dropout rates have been attributed
to the culture shock suffered by trainees forced into an unfamiliar, un-comfortable working environment. Opponents of the Job Corps design assert that the Job Corps was an attempt to empty streets corners of unemployed juvenile dissidents in an effort to minimize the advent of
rioting. Because the prevailing "theory" was based on the employability
of youth, the centers practiced strict discipline and were often staffed
miliary 19
by the military. "Employability" meant that youth needed to ascribe to
the discipline of the world of work and adhere to the codes of conduct
as well.
There are other fundamental weaknesses to the operational procedure
of the Job Corps. Partially because of the intensive services Job Corps
provides (day care services, drug abuse programs, etc.), cost has been a formidable $8,000 per trainee. Nor has the program incorporated an
equitable proportion of female trainees: in 1973 only 26 percent of Job 20
Corps trainees were women. Despite apparent drawbacks, the Job Corps has succeeded in one area where other programs have not. Since 1968,
when administration was shifted from the Office of Economic Opportunity to the Department of Labor, increasing numbers of rural youth have been incorporated into the program--a circumstance of special importance to
the South.
In a 1968 assessment of the placement of Job Corps centersit was
noted that a relatively low proportion of centers was located in the
South. The share is greater now although several Southern states still
have no centers. Of the 29 national Conservation Corps centers, eleven
are located in the South but concentrated in seven states. Of the 30
residential and urban centers, eleven are located in the South but con-centrated in seven states. Five Southern states, one-third of the
region's states--Alabama, Florida, Louisiana, Mississippi and South
21
Carolina--have no Job Centers of any kind.
During the 1960's Job Corps & the NYC used the federal-state
Employment Service (ES) to carry out referral duties. ES undertook
referral duties for the Job Corps and the NYC out-of-school programs for
youth. In 1966 the ES implemented the Human Resources Development
Program,which assigned ES teams to proverty areas and required program
revisions to improve counseling, testing, and job development for the 22
disadvantaged.
Another job creation program of the 1960's was New Careers. New
1970, placed disadvantaged adults and out-of-school youths in
parapro-fessional jobs with public and private nonprofit agencies which provided human services--health, education, welfare and housing. Three additional
segments of Public Service Careers encouraged federal, state, and local governments to "hire first and train later" the disadvantaged for
full-time public service jobs. The premise upon which PSC was based was that
public agencies could profitably hire the disadvantaged if they
reas-sessed entry requirements, provided job training and upgrading, and, in
the case of New Careers, provided advanced education necessary for the
program participants in order to supply a partial solution to employment shortages in the ten rapidly expanding public sector.
Although PSC trainees and hiring agencies were well pleased with program results, difficulties were encountered. Some agencies made use
of new funds to finance existing training, and some New Careers' sponsors failed to ensure that employee's abilities were developed to a level
that would support them beyond the period of the federal grant. In
addition, the economic slowdown of the early 1970's produced agency
hiring freezes, and budget cuts led to the closedown of PSC programs in 23
some areas.
EMERGENCY EMPLOYMENT ACT of 1971
The Emergency Employment Act of 1971 was the impetus for the Public
Employment Program (PEP). PEP was a two-year terminal mechanism designed to combat a temporarily high incidence of unemployment by
and fill 170,000 jobs. But PEP's success in effecting its secondary goal to "remedy the unmet needs for public services and civil service
reform" and to "upgrade the disadvantaged worker" was modest.
Because program emphasis was on Vietnam era veterans, only 28
per-cent of PEP participants were women. Eighty perper-cent of those women were
relegated to low paying jobs in health, education, and social service
categories. Seventy-three percent of all participants and 60 percent
of the welfare recipients enrolled in the program were high school
graduates. 1 le young and old workers who, in 1972, comprised 38 and 20 percent, respectively, of the unemployed accounted for only 22 and 14
percent of PEP participation. The typical PEP participant was a high
school educated white male of prime working age. He was provided with neither permanent employment nor skill training which might lead to
permanent employment. Only 1.7 percent of federal funds went for
train-ing enrollees to assume paraprofessional responsibilities; the remainder
of the appropriation served primarily to assist temporarily that segment
of the unemployed least in need of assistance.24
COMPREHENSIVE EMPLOYMENT AND TRAINING ACT OF 1973
The Comprehensive Employment and Training Act of 1973 (CETA) repealed
the Manpower Development and Training Act of 1962 and portions of the
Economic Opportunity Act of 1964 and substituted a new public employment
program for the Emergency Employment Act of 1971. CETA became operative
on July 1, 1974. CETA is an attempt through decategorization, to minimize the inefficient bureaucracy that emerged and, through
decen-tralization, to better provide for the disparate needs of separate
localities. Decentralization under CETA works through a "prime sponsor" which may be a city or county with population of 100,000 or more, or a
consortium of local governments of which at least one unit has a
popu-lation of 100 .000. For all areas not otherwise covered, the state assumes the role of prime sponsor for what is known as the
"balance-of-state".
To the prime sponsor is left the determination of the mix of labor
training programs most likely to meet local needs. CETA's Title 1
(commonly referred to as Comprehensive Manpower Services) , permits the following activities: outreach, assessment and referral, education,
institutional training, on-the-job training, payments to employers for the expansion of job opportunities, payment of allowances, supportive and employment-related services, the gathering and dispensing of labor
market information, and public service employment, Prime sponsors may
mix these activities as they wish, and CETA does not require the operation of all activities. This kind of flexible system allows prime sponsors
to utilize those options that will succeed in reducing long-run
struc-tural unemployment in their areas.25
The Job Corps was incorporated as Title IV of CETA and remains in the Department of Labor for administration and operation. Indians,
offend-ers, youth, and non-English-speaking people are also administered by the DOL
consideration for Title III funds.
Although CETA is generally considered to be the comprehensive employment training program in the U.S., all programs that perform
employment training related services were not incorporated into the legislation. Other programs that were operated prior to CETA by state
governments serve as delivery agents for CETA programs.
Public service employment has been given, under CETA, its first permanent role in national labor policy. Title II of the legislation established a program similar to PEP in that it is triggered by.
unem-ployment rates in excess of a specified minimum and provides
transi-tional-to-permanent, rather than temporary, employment. Titles II and
VI of CETA, both of which provide public-service employment, differ in area eligibility, client eligibility, and the permanency of the
unem-ployment provided. Funds for Titles II and VI are to be used to create
jobs that provide needed public services and to conduct training pro-grams and other labor-related services necessary to fill those jobs and maintain the operation of the program. The legislative intent behind
both Titles is that emphasis be placed upon jobs that will lead to
permanent, unsubsidized employment opportunities and career advancement
for program participants.26
Under CETA Title I youth receive the bulk of the services. Youth
16-21 (in-school and out-of-school) participate in work-training combina-tion programs. Rural youth receive limited attencombina-tion vis-a-vis the
school system and the local municipal government through the CETA
school attendance of those students who would normally drop out because
of economic conditions. The out-of-school program addresses the
employ-ment needs of youth by providing work experience suppleemploy-mented with
sup-portive services as provided in the in-school youth.
The CETA program has been revised and amended to combat inequities
and deficiencies in the program. Critics of the program claim that
public-service employment slots are generally low-level dead end positions.
Municipalities have used these slots to continue to provide services in
a declining economy. White middle-class professionals displaced by
shrinking municipal budgets have been hired with CETA funds. These public-service jobs are generally "pre-selected" and not left open to random selection. (My experiences during my employment with a CETA
prime sponsor substantiates this claim. Jobs that were professional
in nature were always noted as being "filled" before the public
announce-ment was made.)
Summary
In the early sixties, when education and training goals were to
increase the "employability" of certain groups and to some degree,
per-form redistributive functions, the prevailing economic argument was whether
the high unemployment rate was the result of insufficient aggregate
demand or whether it was a structural problem. Since the early sixties,
billions of dollars have been poured into employment and training programs
to increase employability. The seventies have come and nearly gone and
Table 7
ENROLLMENT AND EXPENDITURES, FEDERAL MANPOWER PROGRAM, FISCAL YEARS 1963-1974
Program MDTA
Neighborhood Youth Corps Operation Mainstream Public Serv4ce Careers
Concentrated Employment Program Work Incentive Program
JOBS Job Corps
Public Employment Program TOTAL Total Enrollment (in thousands) 2,519.1 5,762.2 180.1 160.1 650.4 997.7 394.1 230.4 672.9 11,572.3 Total Expenditures (in thousands) $ 3,56.7,775 3,721,401 490,436 339,946 1,096,812 886,427 848,084 874,505 2,482,142* $14,366,600
*Includes $44,010,000 allotted under Title II and $237,110,000 allotted under Title III-A of the Comprehensive Employment and Training Act of
1973.
Source: Manpower Report of the President, 1975 (Washington, DC: Government Printing Office, 1975), table E-1, p. 317.
Table 8 shows unemployment rates for different
race-age-sex-groups for four separate years in the 1970's. The most obvious feature
of the table is the marked deterioration of the relative employment
situation of minorities. The 1978 unemployment rates of adult whites
(age 25+) was less than one percentage point higher than their 1970 .and
1973 values, the unemployment rates of black adults are two .to three percentage points higher.
The unemployment rates of younger age groups, our primary focus,
depicts a similar scheme. The rates of younger whites (ages 16 to 19
and 20 to 24) are also not much different from those in 1970 and 1973,
while the unemployment rates of black youth have skyrocketed. Of the
black youth employed, between 30 and 40 percent were participants in
various youth employment programs. Though our focus is on rural youth,
we can gain some image of their situation if we accept the premise that
their situation is probably worse than those stated for the general
youth norm. Realizing that the published unemployment rates understate
the severity of the changes in unemployment, we can say that, rural
true unemployment hovers around 40 to 50 percent. The labor force
participation rates of minority youth have fallen since 1970, while
the participation rates for white youth have risen. The ratio of employ-ment to population is almost twice as great for white teenagers as for
black. 28
Minority youth have been an exception in every positive improvement
toward closing the unemployment gap between blacks and whites in this country. The performance of the labor market in the United States
Table 8
UNEMPLOYMENT RATES BY RACE, AGE, AND SEX FOR SELECTED YEARS IN THE 1970s 1970 Age 16- - 19 M Black and White other 13.7 24.9 F 13.3 34.4 20 - 24 M F 25+ M F TOTAL 7.8 12.6 6.9 15.0 2.6 3.9 4.4 5.2 1973 Black and White other 12.3 26.9 13.0 34.5 6.5. 12.6 7.0 17.6 2.4 3.7 4.9 4.2 6.1 4.9 1977 Black and White other 15.0 37.0 15.9 39.9 9.3 21.7 9.3 23.6 3.8 5.5 7.7 9.1 7.0 1978 Black and White other 13.5 34.4 14.4 38.4 7.6 20.0 8.3 22.3 6.4 3.1 4.5 6.0
Source: B.L.S. Employment and Earnings for 1970, 1973, and 1977: unpublished
B.L.S. data for 1978. Taken from Johnson, George. "Do Structural Employment and Training Programs Influence Unemployment," Challenge, pg. 35.
during the 1970's has been quite good, with the significant exception
of the minorities. The labor force of young persons and women has
increased markedly relative to the labor force of adult men. In an
economy characterized by relative wage rigidity and severe structural
unemployment, this would have meant large increases in the
unemploy-ment rates of these rapidly growing groups. But, again, with the
exception of minorities (especially youth), this did not happen. Instead,
the distribution of employment adjusted quite well to the changed
distribution f the other groups in the labor force.
As demonstrated, there is much, still to be done towards reducing
unemployment and poverty in the United States among rural youth. Past employment programs have failed to focus on rural youth problems. With
the advent of CETA, flexibility allows for program designs that will
address the needs of rural youth.
Within the CETA framework, I have proposed a rural-youth
employ-ment training program that addresses the needs of rural youth from a
different policy perspective. Past programs have sought to approach
the problem by increasing human capital or increasing the supply of
temporary jobs. The YEDC approach not only increases human capital
and provides jobs but attempts to impact every facet of youth life.
CHAPTER II
PART I
The Youth Employment and Development Centers
In May 1979, the Mississippi Institute for Small Towns, Inc.
(MIST), Jackson, Mississippi, a non-profit community development
techni-cal assistance operation, secured my assistance and a fellow colleague
to implement a planning grant. The product of the planning grant was the
Youth Employment and Development Center proposal. This chapter outlines
the process that brought about the Youth Employment and Development
Center (YEDC) concept. Additionally, the YEDC program is described in
detail. Further, the YEDC is examined in terms of its potential. ability.
to impact rural youth unemployment.
The planning grant had been awarded to the Mississippi Conference
of Black Mayors (MCBM), Inc., to assess the needs of rural youth in their
respective communities. MCBM subcontracted with MIST, Inc., who, in turn,
secured our services. I assumed the role of Project Coordinatorand my
colleague served as Research Analyst for the planning project. The grant
mandated that certain activities take place. An interesting directive
was the mandate to have youth included in the planning process. According
to the grant, a local planning task force was to be organized in each
community represented by the MCBM. At least fifty percent of the task
force had to be youth "representative of the target population". A
Project Planning Task Force was to be organized to synthesize the local