HAL Id: hal-01923527
https://hal.archives-ouvertes.fr/hal-01923527
Submitted on 26 May 2021
HAL is a multi-disciplinary open access
archive for the deposit and dissemination of
sci-entific research documents, whether they are
pub-lished or not. The documents may come from
teaching and research institutions in France or
abroad, or from public or private research centers.
L’archive ouverte pluridisciplinaire HAL, est
destinée au dépôt et à la diffusion de documents
scientifiques de niveau recherche, publiés ou non,
émanant des établissements d’enseignement et de
recherche français ou étrangers, des laboratoires
publics ou privés.
Distributed under a Creative Commons Attribution| 4.0 International License
and Behavioral Deficits Induced Six Weeks after
Oligomeric Amyloid-β Peptide Injection in Rats
Charleine Zussy, Anthony Brureau, Emeline Keller, Stéphane Marchal, Claire
Blayo, Brice Delair, Guy Ixart, Tangui Maurice, Laurent Givalois
To cite this version:
Charleine Zussy, Anthony Brureau, Emeline Keller, Stéphane Marchal, Claire Blayo, et al..
Alzheimer’s Disease Related Markers, Cellular Toxicity and Behavioral Deficits Induced Six Weeks
after Oligomeric Amyloid-β Peptide Injection in Rats. PLoS ONE, Public Library of Science, 2013, 8
(1), �10.1371/journal.pone.0053117�. �hal-01923527�
and Behavioral Deficits Induced Six Weeks after
Oligomeric Amyloid-b Peptide Injection in Rats
Charleine Zussy1,2,3, Anthony Brureau1,2,3, Emeline Keller1,2,3, Ste´phane Marchal1,2,3, Claire Blayo1,2,3, Brice Delair1,2,3, Guy Ixart1,2,3, Tangui Maurice1,2,3, Laurent Givalois1,2,3*
1 Molecular Mechanisms in Neurodegenerative Dementia Laboratory, Inserm U710, Montpellier, France, 2 University of Montpellier 2, Montpellier, France, 3 EPHE, Paris, France
Abstract
Alzheimer’s disease (AD) is a neurodegenerative pathology associated with aging characterized by the presence of senile plaques and neurofibrillary tangles that finally result in synaptic and neuronal loss. The major component of senile plaques is an amyloid-b protein (Ab). Recently, we characterized the effects of a single intracerebroventricular (icv) injection of Ab fragment (25–35) oligomers (oAb25–35) for up to 3 weeks in rats and established a clear parallel with numerous relevant
signs of AD. To clarify the long-term effects of oAb25–35and its potential role in the pathogenesis of AD, we determined its
physiological, behavioral, biochemical and morphological impacts 6 weeks after injection in rats. oAb25–35was still present
in the brain after 6 weeks. oAb25–35injection did not affect general activity and temperature rhythms after 6 weeks, but
decreased body weight, induced short- and long-term memory impairments, increased corticosterone plasma levels, brain oxidative (lipid peroxidation), mitochondrial (caspase-9 levels) and reticulum stress (caspase-12 levels), astroglial and microglial activation. It provoked cholinergic neuron loss and decreased brain-derived neurotrophic factor levels. It induced cell loss in the hippocampic CA subdivisions and decreased hippocampic neurogenesis. Moreover, oAb25–35 injection
resulted in increased APP expression, Ab1–42 generation, and increased Tau phosphorylation. In conclusion, this in vivo
study evidenced that the soluble oligomeric forms of short fragments of Ab, endogenously identified in AD patient brains, not only provoked long-lasting pathological alterations comparable to the human disease, but may also directly contribute to the progressive increase in amyloid load and Tau pathology, involved in the AD physiopathology.
Citation: Zussy C, Brureau A, Keller E, Marchal S, Blayo C, et al. (2013) Alzheimer’s Disease Related Markers, Cellular Toxicity and Behavioral Deficits Induced Six Weeks after Oligomeric Amyloid-b Peptide Injection in Rats. PLoS ONE 8(1): e53117. doi:10.1371/journal.pone.0053117
Editor: Stephen D. Ginsberg, Nathan Kline Institute and New York University School of Medicine, United States of America Received May 24, 2012; Accepted November 28, 2012; Published January 2, 2013
Copyright: ß 2013 Zussy et al. This is an open-access article distributed under the terms of the Creative Commons Attribution License, which permits unrestricted use, distribution, and reproduction in any medium, provided the original author and source are credited.
Funding: This work was supported by annual INSERM funding. The funders had no role in study design, data collection and analysis, decision to publish, or preparation of the manuscript.
Competing Interests: The authors have declared that no competing interests exist. * E-mail: lgivalois@univ-montp2.fr
Introduction
Alzheimer’s disease (AD) is the most common cause of dementia in the elderly and is characterized by a progressive impairment in cognitive functions, resulting from synapse and nerve cell destruction in the brain. AD symptoms include memory loss, alteration of the individual’s personality and failure to communi-cate or perform routine tasks. The histopathological hallmarks of AD include the presence of extracellular senile plaques, intracel-lular neurofibrillary tangles (NFT), reduction and dysfunction of synapses, neuronal death and reduction in overall brain volume. Senile plaques are composed of insoluble extracellular aggregates consisting mainly of amyloid-b (Ab) peptides, which are generated by enzymatic cleavages of the amyloid precursor protein (APP), while NFT are the result of hyper- and abnormal phosphorylation of the microtubule-stabilizing protein Tau [1,2].
There is no doubt that progressive Ab accumulation contributes to AD. A correlation between the total amount of Ab in human brain and cognitive decline indicates that the amount of Ab, but not necessarily plaque formation, is important for AD progression [3,4]. Transgenic APP mice demonstrate cognitive decline before
plaque formation [5], and soluble oligomers can inhibit cognitive function [6] and long-term potentiation [7,8]. In fact, it is possible that extracellular amyloid deposits are only one aspect of the larger pathological cascade and an indirect consequence of possible protective responses intended to sequester toxic soluble Ab oligomers [4]. The degree of dementia in AD correlates better with Ab assayed biochemically, than with the histologically determined number of plaque. The concentration of soluble Ab species, which cannot be detected through an immunohistochem-ical analysis, appears to be more closely correlated with cognitive deficits [3,4]. In fact, Ab deposits may not even carry the most aggressive toxicity, but instead represent a reserve of toxicity from where toxic oligomeric fragments could be released [9–11].
The soluble Ab oligomers observed in AD patients contain Ab in its most predominant sequences: Ab1–40 or Ab1–42 [3,11].
Nevertheless, they also contain peptides with shorter sequences such as N-truncated amyloid-b oligomers [12,13]: Ab25–35 or
Ab25–35/40[14–16]. Ab25–35(GSNKGAIIGLM) can be produced
in AD patients by enzymatic cleavage of Ab1–40[14,15]. This Ab
peptide includes extracellular and transmembrane residues that have been reported to represent a biologically active region of Ab
[17–19] and to contain the highly hydrophobic region forming stable aggregations [18]. Interest in this undecapeptide, which itself shows a b-sheet structure [18,20], has grown over the last decade, mainly because it induces neurite atrophy, neuronal cell death, synaptic loss, as well as synaptic plasticity and memory deficits in a similar way to Ab1–40and Ab1–42[21], but with better
solubility and efficiency [22,23].
Most studies in rodents have examined the effects of Ab25–351,
2 and 3 weeks after its icv injection [20,24–35]. Only one study continued the investigation up to 6 months after icv injection of Ab25–35and found long-lasting memory deficits [34].
Therefore, to clarify the long-term effects of a single icv injection of Ab25–35 oligomers (oAb25–35) and to evaluate a
potential impact of such short Ab fragment in the progression of AD, we conducted a study to determine its behavioral, physiolog-ical, biochemical and morphological impacts in healthy adult male rats, 6 weeks after a single icv injection, including changes in APP processing, Ab1–42generation and Tau hyperphosphorylation.
Methods Animals
Adult male Sprague-Dawley rats (Depre´, France) weighing 280– 300 g at the beginning of the experiments were housed for 1 week before experiments under standard laboratory conditions (12 h/ 12 h light/dark cycle with lights on at 7:00 AM; 2161uC, food and water ad libitum). The animals were treated in accordance with the European Community Council Directive (EEC/86/609). The Animal Welfare Committee at the University of Montpellier 2 approved all protocols and all efforts were made to minimize the number of animals used and potential pain and distress. All surgery was performed under Ketamine/Xylazine mixture, and all efforts were made to minimize suffering. All experiments were performed in conscious rats between 9:00 AM and 2:00 PM, i.e. during the diurnal trough of the circadian rhythm.
Amyloid-b Peptide
Ab25–35and scrambled Ab25–35peptide (NeoMPS, France) were
dissolved in sterile bidistilled water at a concentration of 1mg/ml (soluble form) and stored at 220uC. Ab25–35 and scrambled
peptides were aggregated by in vitro incubation at 37uC for 4 days [26], to obtain a solution of Ab25–35oligomers (oAb25–35).
To evaluate the size of particles induced after the 4 days incubation at 37uC, different fractions (detailed in figure 1) were evaluated by photon correlation spectroscopy (PCS) using a Nanosizer (Zetasizer Nano Series ZS, Malvern Instruments, UK) with a laser light wavelength at 632.8 nm and a scattering angle of 173 degrees. The particle size (nm) was measured at 25uC using disposable microcuvettes (Malvern Instruments). The correlation times were defined on 10 s per run and a total of 13 runs was made per measurement. Before measurements, each sample was diluted if necessary in water to avoid multiple diffusion phenom-ena during PCS measurements. Results were analyzed using a Zetasizer software 6.01, experimental data were assessed by NNLS algorithm. For this calculation, the dispersant viscosity was taken as 0.89 mPa at 25uC and the refractive index as 1.33. Size distributions were expressed as size frequency distribution (%) in function of particles size (nm). As control, monomeric form of Ab25–35peptide was obtained by dilution in hexafluoroisopropanol
(HFIP, Sigma-Aldrich, France).
Experimental Procedures
Animals were divided into three groups. One group was left undisturbed (control rats), a second group received an icv injection
of incubated scrambled peptide (10mg/rat) and a third group received an icv injection of oAb25–35peptide (10mg/rat) [25]. For
icv injection through a Hamilton syringe (VWR, France), the animals were anesthetized with an intramuscular injection of 0.2 ml of a mixture of Ketamine hydrochloride (80 mg/kg b.w.) and Xylazine (10 mg/kg b.w.). They were then stereotaxically injected directly into the lateral ventricles at coordinates (AP: 21 mm, L: 61.5 mm, and DV: 23.5 mm) according to Paxinos and Watson [35].
Locomotor Activity and Body Temperature Variations
The day of the icv injection and during the same anesthetic session, a single telemetric transmitter (PhysioTel, TA 10TA-F40; DSI, USA) was implanted intra-peritoneally. The corresponding receiver (RA1010; DSI) was fixed under the animal’s cage and connected via a BMC100 consolidation matrix (DSI) to a Dataquest III computerized data analyzer (DSI). The animals were then recorded during the 6thweek following peptide injection and telemetric data were analyzed. This system allows measure-ment of continuous locomotor activity and body temperature variations, as previously reported [20].
Spatial Short-term Memory (Delayed Alternation in the T-maze)
As previously detailed [20,36], delayed alternation was tested in the T-maze and the results were expressed as ratio of the time spent in the initially closed novel arm over the time spent in the previous arm and as a ratio of the number of entries into the novel arm over the familiar one.
Spatial Long-term Memory (Place Learning in the Water-maze)
As previously reported [20,25], spatial reference memory was tested using a place learning procedure in the water-maze. Training consisted of three swims per day for 5 days. Each rat was allowed a 90 s swim to find the platform and was left for a further 30 s on the platform. The median latency was determined for each training session. A probe test was performed 4 h after the last training session. The platform was removed and each rat was allowed a free 60 s swim. The percentage of time spent in the training quadrant was determined by videotracking (Viewpoint, France).
Endocrine Stress
Blood samples were collected after killing the rats by decapi-tation, as previously reported [37]. Plasma corticosterone (CORT) was assayed with a radioimmunoassay kit (Biotrak, GE-Health-care, France) in 50ml plasma sample diluted (1:5) with the assay buffer. The intra- and inter-assay coefficients of variation were 5% and 7%, respectively. The assay sensitivity was 0.6 ng/ml.
Oxidative Stress
As previously described [20,28], quantification of lipid perox-idation in tissue extracts was based on Fe(III)xylenol orange complex formation according to the Hermes-Lima method [38].
Specific Markers (GFAP, Iba1, VAChT, PSA-NCAM, Caspase-9, -12 and -3)
Rats were sacrificed by decapitation and structures of interest were weighed, immediately frozen in liquid nitrogen and stored at 220uC. Tissues were sonicated with a VibraCell (Sonics & Materials, USA) in 2% SDS. Homogenates were then boiled (5 min) and centrifuged for 30 min at 14000 g (for GFAP,
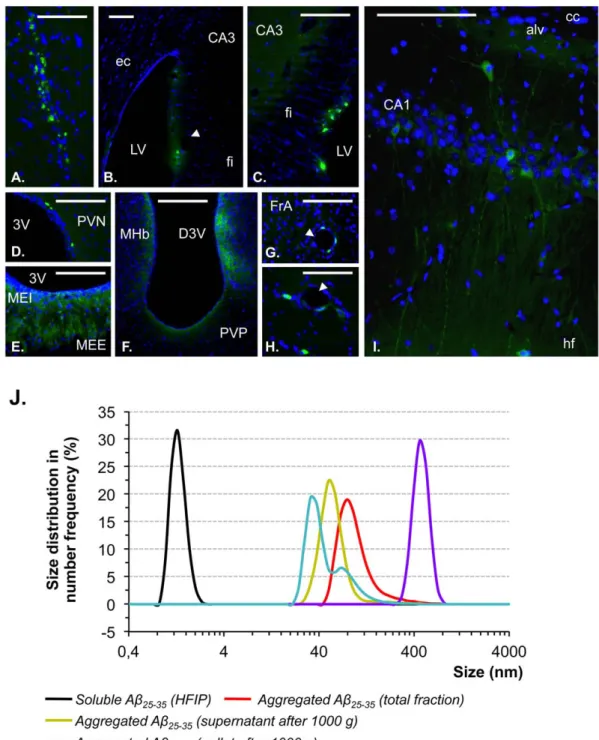
pro-Figure 1. Brain localization of Ab25–35and particle characterization of Ab25–35solutions A–I. Localization within brain structures of
oAb25–35-HLF, determined 6 weeks after its icv injection (10 mg/rat). oAb25–35-HLF was visualized in green, while the nucleus was counterstained with
DAPI (blue labeling). Abbreviations: 3V: third ventricle; alv: alveus of the hippocampus; CA1: field CA1 of hippocampus; CA3: field CA3 of the hippocampus; cc: corpus callosum; D3V: dorsal third ventricle; ec: external capsule; fi: fimbria of the hippocampus; FrA: frontal association cortex; hf: hippocampal fissure; LV: lateral ventricle; MEE: median eminence, external part; MEI: median eminence, internal part; MHb: medial habenular nucleus; PVN: paraventricular hypothalamic nucleus; PVP: paraventricular thalamic nucleus, posterior part. Arrowhead: blood vessel. Scale bar = 100 mm.J. Particle size distribution of the different fractions of Ab25–35solution (1 mg/ml) was determined by PCS at 25uC. Samples were prepared as described in
the materials and methods section. Black curve: Ab25–35peptide dissolved in hexafluoroisopropanol (HFIP); Red curve: solution of aggregated Ab25–35
peptide; Green curve: supernatant of aggregated Ab25–35peptide centrifuged at 1 000 g; Purple curve: re-suspended pellet of aggregated Ab25–35
peptide obtained after centrifugation at 1 000 g; Blue curve: supernatant of aggregated Ab25–35peptide centrifuged at 16 000 g. Data were analyzed
using a Zetasizer software 6.01 and expressed as size frequency distribution (%) in function of particles size (nm). doi:10.1371/journal.pone.0053117.g001
and cleaved caspase-9 and -12, and pro-caspase-3). To detect cleaved caspase-3, VAChT and Iba1, tissues were homogenized using a specific lysis buffer (Triton X100 1%; Tris-HCl pH 7.5, 20 mM; NaCl 150 mM; EDTA 10 mM; Na3VO4 100mM)
previously described by Cotrufo et al. [39]. Supernatants were collected and the protein concentration was measured using the BCA Kit (Pierce, France) and 20 to 40mg from each sample was taken for western blot analysis depending on the structure and antigen considered. Samples were boiled (5 min), separated by SDS-polyacrylamid gel (12%) and transferred to a nitrocellulose
membrane (Whatman, France). The membrane was incubated overnight (4uC) with a mouse anti-glial fibrillary acidic protein (GFAP) (1/1000; Sigma-Aldrich, France), or a rabbit anti-Iba-1 (1/750; Wako Chemicals, Japan), or a rabbit anti-VAChT (1/500; Sigma-Aldrich) or a rabbit anti-procaspase-3 and a rabbit monoclonal anti-caspase-3 (cleaved form) (1/1000 and 1/2000, respectively; Cell Signaling, France), or a rabbit anti-caspase-9 (pro- and cleaved forms; 1/1000; Cell Signaling), or a rat anti-caspase-12 (pro- and cleaved forms; 1/5000; Sigma-Aldrich, France) or a mouse anti-b-tubulin (b-tub) (1/5000;
Sigma-Figure 2. Physiological and behavioral effects of oAb25–35. A. Body weight variations determined 6 weeks after icv injection of scrambled
Ab25–35peptide (10 mg/rat; scrambled group) or oAb25–35(10 mg/rat; Ab25–35group). The results are expressed as means 6 SEM (with n = 6 per
group). *p,0.05 vs. control value and+p,0.05 vs. scrambled value). B. Variations in locomotor activity and body temperature determined 6 weeks after icv injection of scrambled Ab25–35peptide (10 mg/rat; scrambled group; n = 7) or oAb25–35(10 mg/rat; oAb25–35group; n = 7). Locomotor activity
and body temperature were monitored using telemetric sensors. The thick black line indicates the nocturnal phase (7:00 PM to 7:00 AM). The results are means/hour obtained the 6thweek following the icv injection.C. Effects of oAb
25–35icv injection (10 mg/rat) on the ability of rats to perform a
spatial short-term memory task (T-maze). Six weeks after icv injection, animals were allowed to explore the T-maze, with one short arm closed (B), for 10 min. After a 1 h time interval, the pattern of exploration of the whole maze was recorded for 2 min. The icv injection of the scrambled Ab25–35
peptide (10 mg/rat) served as negative control. The results are expressed as means 6 SEM. **p,0.01 vs. control un-injected rats,+p,0.05 and ++p,0.01 vs. scrambled treated rats. The number of animals in each group is indicated within the columns. D. Effects of oAb25–35icv injection
(10 mg/rat) on rat behavior in a spatial long-term memory test (Water-maze). Six weeks after icv injection, animals were allowed to swim for 90 s to find the training platform and 60 s without the platform for retention. The icv injection of the scrambled Ab25–35peptide (10 mg/rat) served as
negative control. The results are expressed as means 6 SEM. *p,0.05 and **p,0.01 vs. control un-injected rats,+p,0.05 and ++p,0.01 vs. scrambled treated rats.E. The probe test was performed 4 h after the last training trial in a single 60 s-duration swimming without platform. The presence in the training quadrant was analyzed over the chance level (25%): # p,0.05 and ## p,0.01. The number of animals in each group is indicated within the columns.F. Variations in plasmatic corticosterone (CORT) levels determined in rats 6 weeks after icv injection of Ab25–35
scrambled peptide (10 mg/rat; negative control) or oAb25–35(10 mg/rat). The values are means 6 SEM. **p,0.01 vs. control un-injected rats (control
group: C) and++p,0.01 vs. scrambled treated rats. The number of animals in each group is indicated within the columns. doi:10.1371/journal.pone.0053117.g002
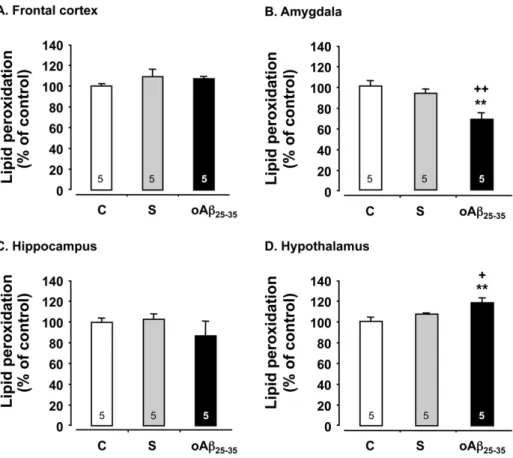
Figure 3. Oxidative stress. Variations in lipid peroxidation levels in the frontal cortex, amygdala, hippocampus and hypothalamus, determined in rats 6 weeks after icv injection of scrambled Ab25–35peptide (10 mg/rat; negative control) or oAb25–35(10 mg/rat). The results are expressed as means
6SEM. **p,0.01 vs. control un-injected rats (control group: C),+p,0.05 and ++p,0.01 vs. scrambled treated rats. The number of animals in each group is indicated within the columns.
Aldrich). The membrane was then rinsed and incubated for 2 h with the appropriate horseradish peroxidase-conjugated secondary antibodies (Sigma-Aldrich). Peroxidase activity was revealed by using enhanced-chemiluminescence (ECL) reagents. The intensity of peroxidase activity was quantified using Image-J software (NIH, Bethesda, USA). b-tubulin was taken as loading control for all immunoblotting experiments and each value was normalized relative to respective b-tubulin level [20]. Note that in this study, the two antibodies against PSA-NCAM that were tested for western blot analysis (mouse monoclonal anti-PSA-NCAM, clone 2-2B, ref# MAB5324 from Millipore and mouse monoclonal anti-PSA-NCAM, ref# AbC0019 from AbCys SA) were unable to work in our conditions.
APP Processing
As previously reported [20], 60mg from each sample was taken to western blot analysis following the same procedures detailed in 2.8. The primary antibody used to detect APP (125 kDa) and C99 fragment (13 kDa) was a rabbit anti-Amyloid Precursor Protein (PA1-84165: 1/750, ABR-Thermo-Scientific, France).
Tau Phosphorylation
To determine the levels of Tau phosphorylation at specific sites, equal amounts of protein (varying from 60 and 80mg depending on the antibody used) from each sample were taken to western blot analysis following the same procedures detailed before. The primary antibodies to detect phospho-Tau epitopes (50 kDa) were a mouse AT8 (S199/S202/T205) and AT100 (T212/S214/T217)
antibodies (MN1020: 1/3000 and MN1060: 1/3000, respectively; ThermoScientific, France), and to detect total Tau (50 kDa) was a mouse anti-Tau antibody (MA1-38710: 1/5000, ThermoScienti-fic, France).
BDNF Content
Rats were sacrificed by decapitation and structures of interest were weighed, immediately frozen in liquid nitrogen and stored at 220uC until assayed. Brain-derived neurotrophic factor (BDNF) content was measured with a conventional ELISA assay (BDNF Emax; Promega, France), as previously reported [40,41]. The assay sensitivity was 15 pg/tube. The BDNF concentration was expressed as pg/g wet weight. The intra- and inter-assay coefficients of variation were 3% and 6%, respectively.
Histology (Cresyl Violet Staining; GFAP, Iba-1, PSA-NCAM, VAChT Immunolabeling)
Animals were anaesthetized using an intramuscular injection of ketamine/xylazine solution and perfused intracardially (50 ml of NaCl 0.9% and 100 ml PO4 0.2 M containing 4%
paraformal-dehyde). Brains were removed and postfixed in the same fixative for 48 h (4uC) and then in a solution of sucrose (30%) for 3 days. Thereafter, tissues were included in a block of OCT compound (Tissue-Tek, Sakura Finetek, USA) and quickly frozen in acetone chilled on dry ice. Frozen brains were mounted on a cryostat (Leica, France) and serially cut into 10mm coronal sections. For histology, they were stained with 0.2% cresyl violet reagent, dehydrated and mounted. The method used for neuronal count is a classical method used with thin brain sections (10mm) to quantify undamaged hippocampic cells [20,29,42,43]. The count-ing was made uscount-ing images captured with Leica DFC495 high-resolution camera (Leica Microsystem, Nanterre, France) attached to Leica DM2500 microscope (Leica) and the Leica LAS Core image analysis software (Leica). For this purpose, digitized images acquired using a 640 objective were transformed into TIFF files and brought to the same level of contrast and sharpness using the software. Four sections were studied from each brain, taken from the anterior hippocampus level (23.0 to 24.0 from the bregma) [35], with intervals of 250mm. Sections were selected on a subjective random basis. Three fields were analyzed per hippo-campus for CA1, one for CA2 and CA3 and two for DG. Counts of undamaged cells were made using ImageJ software on TIFF captured images. Neuron densities on slices (number of neurons in the optical field expressed as the number of cells per mm2) were calculated as the arithmetic mean number of neurons in the two hemispheres and, for each animal, as the arithmetic mean of results obtained for each of the four slices. The count of undamaged cells in the CA1, CA2, CA3 and DG fields of the hippocampus was done by two different scientists unaware of the experimental conditions and independently from each other using display projections of the images (each person performed cell count for all animals included into the experiment and no difference was observed between the two independent and unaware analyses).
Analyses of the glial (GFAP) and acetylcholine (VAChT) markers were conducted according to a diaminobenzidine (DAB) immunohistochemistry approach, while analyses of the microglial (Iba-1) and neurogenesis (PSA-NCAM) markers were conducted according to a fluorescent immunohistochemistry approach [20,40]. Sections were incubated overnight at room temperature with a mouse anti-GFAP (1/1000, Sigma-Aldrich), or a rabbit Iba-1 (1/500; Wako Chemicals, Japan), or a rabbit anti-VAChT (1/500; Sigma-Aldrich) or a rabbit anti-PSA-NCAM antibody (1/200; Abcys, France). Then sections were incubated
Figure 4. Neurotrophic factor. Variations in BDNF contents within the frontal cortex, amygdala, hippocampus and hypothalamus, determined in rats 6 weeks after icv injection of scrambled Ab25–35
peptide (10 mg/rat; negative control) or oAb25–35(10 mg/rat). The results
are expressed as means 6 SEM. **p,0.01 vs. control un-injected rats (control group: C),+p,0.05 and ++p,0.01 vs. scrambled treated rats. The number of animals in each group is indicated within the columns. doi:10.1371/journal.pone.0053117.g004
for 2 h with the appropriate biotinylated (GFAP and anti-VAChT) or fluorescent (Alexafluor-488; anti-Iba-1 and Alexa-fluor-555; anti-PSA-NCAM) secondary antibody (Sigma-Aldrich or Molecular Probes, The Netherlands). Biotinylated sections were incubated for 1 h in avidin–biotin complex (ABC kit; Vector Laboratories, USA). Signals were detected with the diaminoben-zidine kit (Vector Laboratories), according to the manufacturer’s instructions, while nuclei of fluorescent sections were counter-stained with 49,69-diamino-2-phenylindole (DAPI, Molecular Probes). The immunostaining specificity was determined with the same protocol but by incubating control sections with the secondary antiserum alone.
Ab25–35Distribution
We used a tagged peptide with a fluorescent dye (oAb25–35
HiLyte Fluor 488, ANASPEC/Eurogentec, France) (oAb25–35
-HLF) to analyze the distribution within brain structures of the
injected oAb25–35 fragment. The ability of the tagged peptide to
form amyloid fibrils after 4 days of incubation at 37uC was previously assessed by electron microscopy and Congo red staining [20]. Six weeks following the icv injection of oAb25–35-HLF,
animals were anaesthetized using an intra-muscular injection of ketamine/xylazine solution and perfused intracardially, as previ-ously described. Brains were removed and postfixed in the same fixative for 3 days (4uC) and serially cut with a vibrating blade microtome (Leica) into 30mm coronal sections. Before to be mounted, sections were counterstained with DAPI to visualize nuclei.
Statistical Analysis
Data are presented as mean6SEM. Comparisons were performed using one-way or two-way ANOVA (F values) followed by a Fisher’s multiple comparison test. P, 0.05 was considered significant.
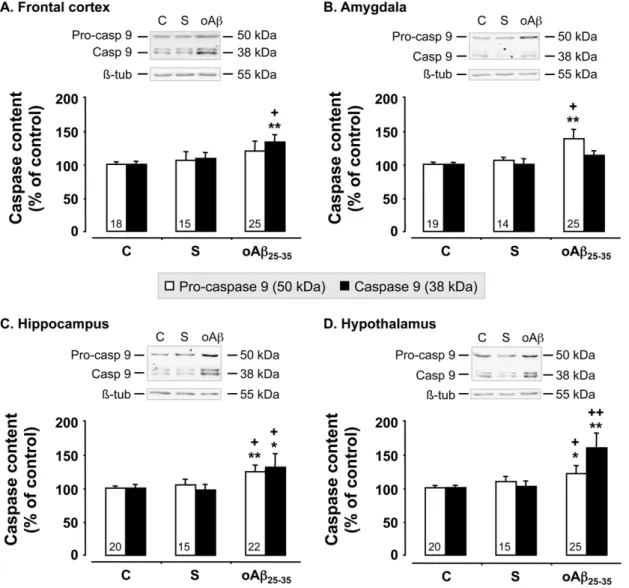
Figure 5. Mitochondrial stress. Pro- and activated caspase-9 levels within the frontal cortex, amygdala, hippocampus and hypothalamus, determined in rats by western blot 6 weeks after oAb25–35icv injection (10 mg/rat). Pro-caspase-9 (50 kDa) and activated caspase-9 (38 kDa) variations
were normalized with b-tubulin (b-tub, 55 kDa) variations and compared with un-injected rats (control group: C). The results are expressed as means 6SEM. *p,0.05 and **p,0.01 vs. control group,+p,0.05 and ++p,0.01 vs. scrambled treated rats. Note that scrambled peptide injection (10 mg/ rat) served as negative control and did not induce any modifications in pro- and activated caspase-9 levels. The number of animals in each group is indicated within the columns.
Results
Regional Distribution of Ab25–35-HLF Showed Persistent Presence of oAb25–35 after 6 Weeks in the Brain
The regional distribution of oAb25–35-HLF 6 weeks after
injection is presented in Fig. 1A–I. Control rat sections were treated and examined in the same conditions as injected rat sections and displayed no specific labeling. oAb25–35-HLF labeling
was relatively discreet, suggesting a progressive clearance of the peptide after 6 weeks in comparison to previous study [20]. However, oAb25–35-HLF was again found at the injection site level
where it was trapped by local cells (Fig. 1A). The fluorescent peptide was also found in brain ventricles, particularly in the lateral ventricle (LV) (Fig. 1B–C), and at the dorsal (D3V) and ventral (3V) parts of the third ventricle (Fig. 1D–F). At this level, oAb25–35-HLF was found in ependymal cells bordering ventricles
and in the surrounding brain structures (Fig 1B–F). The fluorescent peptide was found in the walls of blood vessels particularly in the amygdala, frontal (Fig. 1G) and parietal cortex, but also in hypothalamus and thalamus (Fig. 1H) regions. As previously reported, in addition to ependymal cells, oAb25–35-HLF
was found in neurons (Fig. 1H–I) and in glial cells, particularly in
Figure 6. ER stress. Variations in pro- and activated caspase-12 levels in the frontal cortex, amygdala, hippocampus and hypothalamus, determined in rats by western blot 6 weeks after oAb25–35icv injection (10 mg/rat). Pro-caspase-12 (50 kDa) and activated caspase-12 (25 kDa) variations were
normalized with b-tubulin (b-tub, 55 kDa) variations and compared with untreated rats (control group: C). The results are expressed as means 6 SEM. *p,0.05 and **p,0.01 vs. control group,+p,0.05 and ++p,0.01 vs. scrambled treated rats. Note that scrambled peptide injection (10 mg/rat) served as negative control and did not induce any modifications in pro- and activated caspase-12 levels. The number of animals in each group is indicated within the columns.
the median eminence (Fig. 1E), but also in nerve fibers, principally in the hippocampus (Fig. 1I).
4-days Incubation of Ab25–35 Led Almost Exclusively to Soluble Oligomers
In addition to a previous qualitative study [20], where we have evidenced the amyloid property of the aggregated Ab25–35peptide,
we have determined in the present work the respective quantity of each particle species contained in the solution injected in rats. The characterization of the aggregated Ab25–35solution was realized by
PCS and is presented in Figure 1J. This figure shows the size distribution of the oligomeric species in the aggregated Ab25–35
solution. After 4-days incubation at 37uC, the sample is composed of particles with an average diameter of 103.4 nm (weighted average, min/max: 50.7/712.4 nm) (red curve). In order to determine the size of particles that populated the aggregated Ab25–35solution, a
low-speed centrifugation was carried out at 1 000 g for 15 min. PCS analysis of the pellet resuspended in water (purple curve) indicated that the particle size extended from 295.3 to 825 nm with a peak
maximum at 458.7 nm and an average diameter of 479.5 nm. For the supernatant (green curve), the weighted average diameter of particles was 60.0 nm with a peak maximum at 50.7 nm. Similar size of particles (weighted average diameter of 52.8 nm) was measured in the supernatant after centrifugation at 16 000 g (blue curve). Note that these particles had a size with at least one order of magnitude higher than the monomer form of Ab25–35peptide in
HFIP (black curve). This suggests that the aggregated Ab25–35
solution that has been used for icv injection (red curve) is mainly composed of a mixture of soluble oligomer species whose sizes extended from 52.8 to 295.3 nm (98.1%). Some high-density aggregates with a diameter greater of equal at 458.7 nm were also detectable but in low proportion (1.8%).
oAb25–35 Injection in Rats Failed to Affect Body Weight
and Physiological Rhythms
At the beginning of the experiment, the three groups of rats presented no body weight differences (F2,15= 0.10; p.0.05)
(Fig. 2A). By contrast, body weight gain was decreased 6 weeks
Figure 7. Apoptosis. Variations in pro- and activated caspase-3 levels in the frontal cortex, amygdala, hippocampus and hypothalamus, determined in rats by western blot 6 weeks after oAb25–35icv injection (10 mg/rat). Pro-caspase-3 (35 kDa) and activated caspase-3 (19 kDa) variations were
normalized with b-tubulin (b-tub, 55 kDa) variations and compared with untreated rats (control group: C). The results are expressed as means 6 SEM. *p,0.05 and **p,0.01 vs. control group,+p,0.05 and ++p,0.01 vs. scrambled treated rats. Note that scrambled peptide injection (10 mg/rat) served as negative control and did not induce any modifications in pro- and activated caspase-3 levels. The number of animals in each group is indicated within the columns.
Figure 8. Astrocyte activation. A. Variations in GFAP levels in the frontal cortex, amygdala, hippocampus and hypothalamus, determined in rats by western blot 6 weeks after icv injection of scrambled Ab25–35peptide (10 mg/rat; negative control) or oAb25–35(10 mg/rat). GFAP (50 kDa)
variations were normalized with b-tubulin (b-tub, 55 kDa) variations and compared with untreated rats (control group: C). The results are expressed as means 6 SEM. *p,0.05 and **p,0.01 vs. control group,+p,0.05 and ++p,0.01 vs. scrambled treated rats. The number of animals in each group is indicated within the columns.B. Effects of oAb25–35(10 mg/rat) icv injection on astrocyte reactions using GFAP immunolabeling into the frontal and
parietal cortex, amygdala, hippocampus (CA1, CA2 & CA3 regions) and hypothalamus (periventricular nucleus: PeVN & paraventricular nucleus: PVN) determined in control (C) untreated rats and 6 weeks after Ab25–35injection. The scrambled peptide injection (10 mg/rat) served as negative control
and did not induce any modifications in the GFAP signal. 3v: third ventricle. brackets: hippocampus layer of granular cells layer. Scale bar = 60 mm. doi:10.1371/journal.pone.0053117.g008
after the icv injection of oAb25–35 as compared to control and
scrambled peptide-injected rats (F2,15= 5.18; p,0.05), with a
comparable value as previously observed [20].
Locomotor activity and body temperature rhythms were continuously recorded using telemetric transmitters and revealed only circadian differences but not among groups (Fig. 2B). In details, the two-way repeated measure ANOVA for locomotor activity and body temperature data revealed a significantly difference between night and day values but no difference induced by oAb25–35 icv injection (locomotor activity: F1,276= 0.13,
p.0.05 for treatment; F23,276= 14.5, p,0.0001 for time and
F23,276= 0.65, p.0.05 for interaction; body temperature:
F1,276= 0.73, p.0.05 for treatment; F23,276= 31.2, p,0.0001 for
time and F23,276= 0.55, p.0.05 for interaction).
6 Weeks after oAb25–35 Injection, Rats Showed Impaired Learning and Memory Capacities
The ability of rats to perform a spatial short-term memory task was examined using delayed alternation in the T-maze (Fig. 2C). The oAb25–35injection induced memory deficits, since analyses of
ratios of time spent and the number of visits in the novel arm over the familiar one revealed significant effects (F2,25= 8.09; p,0.01
and F2,25= 3.93; p,0.05, respectively), while scrambled
peptide-injected rats presented no deficits as compared to control animals (Fig. 2C).
The spatial reference memory was analyzed using a water-maze procedure. When rats started training 6 weeks after peptide injection (Fig. 2D), acquisition profiles decreased with training. Two-way repeated measure ANOVA showed an effect of training trials and a treatment effect: F2,260= 28.7, p,0.0001 for the
treatment, F4,260= 131, p,0.0001 for trials and F8,260= 3.96,
p,0.001 for the interaction (Fig. 2D). These data outlined an alteration of acquisition performances. However, when animals were submitted to the probe test (Fig. 2E), oAb25–35-treated rats
showed a preferential presence in the training quadrant similarly as scrambled peptide-treated and control rats. The peptide injection therefore only slowed down place learning acquisition but did not impeded it.
6 Weeks after oAb25–35Injection, Rats Showed a Marked
Endocrine Stress
The oAb25–35 icv injection significantly increased plasma
CORT concentrations after 6 weeks when compared with control and scrambled peptide-injected rats (F2,31= 53.8, p,0.0001)
(Fig. 2F).
Analyses of Cellular Markers in oAb25–35 Injected Rats
When compared to control and scrambled peptide-injected rats, the oAb25–35 icv injection induced after 6 weeks an increase in
lipid peroxidation level in the hypothalamus (F2,12= 4.95, p,0.05)
(Fig. 3D), while in the amygdala, oAb25–35 induced a significant
decrease in lipid peroxidation levels (F2,12= 17.7, p,0.001)
(Fig. 3B). By contrast, no difference in peroxidized lipids was observed in the frontal cortex (F2,12= 1.17, p.0.05) (Fig. 3A) and
the hippocampus (F2,12= 3.05, p.0.05) (Fig. 3C) in control,
scrambled peptide- and oAb25–35-injected rats.
As a major neuroprotective system, BDNF contents were analyzed in the rat brain structures. BDNF levels in the frontal cortex (Fig. 4A) and amygdala (Fig. 4B) were decreased 6 weeks after oAb25–35-treated rats, when compared to control and
scrambled peptide-injected rats (F2,41= 3.76, p,0.05 and
F2,40= 5.33, p,0.01, respectively). By contrast, the oAb25–35
injection induced no modification of BDNF content in the
Figure 9. Microglial activation. A. Effects of oAb25–35(10 mg/rat) icv
injection on microglial reaction using Iba-1 immunolabeling in the amygdala, frontal and parietal cortex, hypothalamus (paraventricular nucleus: PVN) and hippocampus (CA1 & CA3 regions) determined in control untreated rats and 6 weeks after Ab25–35 scrambled peptide
(10 mg/rat; negative control) or Ab25–35injection. Activated microglia
was visualized with Alexafluor 488-labeled specific antibody against Iba-1 (green immunolabeling), while the nucleus was counterstained with DAPI (blue labeling). 3v: third ventricle. Scale bar = 100 mm. B–E. Variations in Iba1 levels in the frontal cortex (B), amygdala (C), hippocampus (D) and hypothalamus (E), determined in rats by western blot 6 weeks after icv injection of scrambled Ab25–35peptide (10 mg/rat;
negative control) or oAb25–35(10 mg/rat). Iba1 (17 kDa) variations were
normalized with b-tubulin (b-tub, 55 kDa) variations and compared with untreated rats (control group: C). The results are expressed as means 6 SEM. *p,0.05 and **p,0.01 vs. control group,+p,0.05 and ++p,0.01 vs. scrambled treated rats. The number of animals in each group is indicated within the columns.
hippocampus (F2,36= 1.85, p.0.05) (Fig. 4C) and hypothalamus
(F2,39= 1.05, p.0.05) (Fig. 4D).
We used western blot analyses to measure the levels of pro- and activated caspase-9, an index of mitochondrial alteration, in the cerebral structures of interest, before (control rats) and 6 weeks after scrambled peptide or oAb25–35 injection (Fig. 5). While
scrambled peptide injection failed to affect pro- and cleaved caspase-9 levels, oAb25–35 induced an increase in pro-caspase-9
levels in the amygdala (+38%; F2,55= 9.25, p,0.001) (Fig. 5B),
hippocampus (+25%; F2,54= 5.67, p,0.01) (Fig. 5C) and
hypo-thalamus (+21%; F2,57= 3.43, p,0.05) (Fig. 5D), but not in the
frontal cortex (F2,55= 2.17; p.0.05) (Fig. 5A). Cleaved caspase-9
levels were increased after Ab25–35injection in the frontal cortex
(+33%; F2,55= 3.74, p,0.05) (Fig. 5A), hippocampus (+31%;
F2,54= 2.70, p,0.05) (Fig. 5C) and hypothalamus (+59%;
F2,57= 14.6, p,0.0001) (Fig. 5D), while no effect was observed
in the amygdala (F2,55= 2.08; p.0.05) (Fig. 5B).
We used western blot analyses to measure the levels of pro- and cleaved caspase-12, one of endoplasmic reticulum (ER) stress induction, before (control rats) and 6 weeks after scrambled peptide or oAb25–35 injection (Fig. 6). The scrambled peptide
injection failed to affect pro- and cleaved caspase-12 levels, but oAb25–35 induced significant effects (Fig. 6). In detail, oAb25–35
injection increased pro-caspase-12 only in the frontal cortex (+98%; F2,52= 24.6, p,0.0001) (Fig. 6A) and hippocampus
(+55%; F2,52= 10.0, p,0.001) (Fig. 6C), while no effect was
observed in the amygdala (F2,53= 0.16, p.0.05) (Fig. 6B) and
hypothalamus (F2,56= 1.97, p.0.05) (Fig. 6D). Cleaved caspase-12
was not increased after oAb25–35 injection in the hypothalamus
(F2,56= 1.67, p.0.05) (Fig. 6D), while a marked increase was
observed in the frontal cortex (+70%; F2,52= 10.9, p,0.001)
(Fig. 6A), amygdala (+56%; F2,53= 3.86, p,0.05) (Fig. 6B) and
hippocampus (+81%; F2,52= 10.8, p,0.0001) (Fig. 6C).
We used western blot analyses to measure the levels of pro- and cleaved caspase-3, one of the apoptotic effective caspases, before (control rats) and 6 weeks after scrambled peptide or oAb25–35
injection (Fig. 7). Scrambled peptide injection failed to affect pro-and cleaved caspase-3 levels, but oAb25–35induced an increase in
pro-caspase-3 levels in the amygdala (+32%; F2,56= 3.42, p,0.05)
(Fig. 7B) and hippocampus (+59%; F2,54= 17.0, p,0.0001)
(Fig. 7C), but no effect in the frontal cortex (F2,48= 2.84, p.0.05)
(Fig. 7A) and hypothalamus (F2,57= 1.70, p.0.05) (Fig. 7D). oAb25– 35injection induced a marked increase in cleaved caspase-3 levels in
the frontal cortex (+79%; F2,37= 19.1, p,0.0001) (Fig. 7A) and
amygdala (+68%; F2,37= 19.1, p,0.0001) (Fig. 7B), while no effect
was observed in the hippocampus (F2,35= 0.03, p.0.05) (Fig. 7C)
and hypothalamus (F2,37= 1.54, p.0.05) (Fig. 7D).
6 Weeks after oAb25–35 Injection, Astroglial and Microglial Reactions Revealed Neuroinflammation
GFAP level, a marker of astroglial reactivity, was modified 6 weeks after oAb25–35injection in the frontal cortex (F2,37= 3.35,
p,0.05) (Fig. 8A), amygdala (F2,37= 4.62, p,0.05) (Fig. 8B), and
hypothalamus (F2,35= 16.7, p,0.0001) (Fig. 8D), but not in the
hippocampus (F2,34= 1.70, p.0.05) (Fig. 8C), as compared to
control and scrambled peptide icv-injected rats. In the amygdala and hypothalamus, astroglial activity increased by 25 and 46%, respectively, 6 weeks after oAb25–35 injection. By contrast in the
frontal cortex, GFAP level was decreased by 20%, 6 weeks after oAb25–35injection (Fig. 8A).
Increased GFAP immunoreactivity, indicative of astrogliosis was noted, essentially throughout the amygdala and hypothalamus (Fig. 8E), while no modification was observed in the parietal cortex and CA1 region of the hippocampus and a decrease was noted in the frontal cortex and other hippocampal regions (DG and CA3). Scrambled peptide icv injection did not induce any astrogliosis modification in the structures of interest (Fig. 8E).
Increased Iba-1 immunoreactivity, indicative of microgliosis, was essentially observed in the amygdala, frontal cortex and hippocampus 6 weeks after icv injection of oAb25–35(Fig. 9A). By
contrast, no modification was observed in the hypothalamus of oAb25–35 injected rats or in any of the structures considered in
control and scrambled peptide icv injected rats (Fig. 9A). These immunohistochemistry observations were confirmed by western blot analysis. Indeed, microglial activity (Iba1 level) was increased 6 weeks after oAb25–35injection in the frontal cortex (F2,23= 6.66,
p,0.01; +40% vs. control) (Fig. 9B), amygdala (F2,23= 146,
p,0.01; +204% vs. control) (Fig. 9C), and hippocampus (F2,24= 19.4, p,0.01; +83% vs. control) (Fig. 8D), but not in the
hypothalamus (F2,24= 0.79, p.0.05) (Fig. 8E), as compared to
control and scrambled peptide icv-injected rats.
Decrease Density of Cholinergic Neurons and Terminals was Observed 6 Weeks after oAb25–35Injection
In control rats, large numbers of VAChT-positive cell bodies were seen in the nucleus basalis (Meynert) (Fig. 10A). In the hypothalamus, a very dense plexus of VAChT immunoreactive fibers were present in the external layer of the median eminence and weakly VAChT-positive cell bodies were noted in the arcuate nucleus (Fig. 10B). A dense network of VAChT-positive nerve fibers was seen in the parietal cortex, with the highest density in layers I, IV and V (Fig. 10C). In the hippocampal formation (Fig. 10D), the highest density of VAChT-positive fibers was seen in the pyramidal cell layer of CA1-CA3 regions. No modification was observed after scrambled peptide icv injection. By contrast, oAb25–35icv injection
appeared to induce a pronounced decrease in VAChT immuno-labeling in the nucleus basalis (Fig. 10A), parietal cortex (Fig. 10C) and hippocampus (Fig. 10D), while no effect seemed to be induced by oAb25–35 injection in the hypothalamus (Fig. 10B). These
immunohistochemistry observations were confirmed by western blot analysis particularly in well-defined structures, i.e. hypothala-mus (Fig. 10B; F2,24= 0.02, p.0.05) and hippocampus (Fig. 10D;
F2,25= 5.59; p,0.01; 223% vs. control).
Hippocampus Integrity was also Impaired 6 Weeks after oAb25–35 Injection
Loss of pyramidal cells in the hippocampus was determined using Cresyl violet staining before (control) and 6 weeks after scrambled peptide or oAb25–35injection (Fig. 11A). No
modifica-Figure 10. Cholinergic system. Effects of oAb25–35(10 mg/rat) icv injection on VAChT immunolabelling within the nucleus basalis of Meynert (A),
mediobasal hypothalamus (B), parietal cortex (C) and hippocampus (D) determined in control untreated rats and 6 weeks after Ab25–35injection. In
(B): 3v: third ventricle. In (C): levels I to V cortical layers are indicated. In (D): brackets show the hippocampus granular cell layer. cc: corpus callosum. Scale bars = 100 mm. Variations in VAChT levels in the hypothalamus (B) and hippocampus (D), determined in rats by western blot 6 weeks after icv injection of scrambled Ab25–35peptide (10 mg/rat; negative control) or oAb25–35(10 mg/rat). VAChT (70 kDa) variations were normalized with
b-tubulin (b-tub, 55 kDa) variations and compared with untreated rats (control group: C). The results are expressed as means 6 SEM. *p,0.05 and **p,0.01 vs. control group,+p,0.05 and ++p,0.01 vs. scrambled treated rats. The number of animals in each group is indicated within the columns. doi:10.1371/journal.pone.0053117.g010
tion was observed after scrambled peptide injection. By contrast, oAb25–35injection induced a decrease in stained cells in the CA1
(212%; F2,9= 6.76, p,0.05), CA2 (216%; F2,9= 13.2, p,0.01)
and CA3 (210%; F2,9= 14.1, p,0.01) hippocampus subfield,
while no modification was observed in the DG (F2,9= 0.58,
p.0.05), when compared to control and scrambled peptide-injected rats (Fig. 11B).
PSA-NCAM-positive cells, indicative of neurogenesis, were revealed within the DG. An apparent decline in PSA-NCAM immunolabeling was observed 6 weeks after oAb25–35 injection,
while no modification was induced by scrambled peptide icv injection (Fig. 11C).
oAb25–35Modified APP Processing 6 Weeks after Injection
To determine whether the oAb25–35 injection impacted APP
processing, we measured APP and C99 levels by western blot (Fig. 12). The scrambled peptide injection did not affect APP and C99 levels. By contrast, oAb25–35injection provoked a sustained
increase in APP levels after 6 weeks in the frontal cortex (Fig. 12A, F2,22= 5.95; p,0.01), amygdala (Fig. 12B, F2,23= 30.2; p,0.01)
and hypothalamus (Fig. 12D, F2,22= 7.56; p,0.01), while in the
hippocampus Ab25–35 injection induced a significant decrease in
APP levels (Fig. 12C, F2,24= 13.6; p,0.01). In all structures
considered, oAb25–35 injection provoked a sustained increase in
C99 levels, which was significant in the cortex frontal (F2,25= 8.52;
p,0.01), amygdala (F2,22= 31.3; p,0.01) and hippocampus
(F2,22= 7.53; p,0.01), but not in the hypothalamus (F2,23= 2.01;
p.0.05). In comparison of all other structures analyzed, in the amygdala the increase of APP and C99 levels observed 6 weeks after the Ab25–35 injection was extremely marked (6 3.8 and 6
2.6, respectively) (Fig. 12B).
Tau Phosphorylation was also Altered 6 Weeks after oAb25–35Injection
To determine whether the oAb25–35 injection altered after 6
weeks the phosphorylation level of Tau, we measured AT8, AT100 and total Tau levels by western blot. The results were then expressed as phospho-Tau/total Tau ratios (Fig. 13). The scrambled peptide injection did not affect the phosphorylation of AT8 and AT100 epitopes (Fig. 13). By contrast, oAb25–35injection
provoked a sustained increase of Tau phosphorylation (AT8) in the frontal cortex (Fig. 13A, F2,20= 9.24; p,0.01) and amygdala
(Fig. 13B, F2,19= 61.0; p,0.01). In the hypothalamus (Fig. 13D),
no effect was observed (F2,20= 0.11; p.0.05). In the hippocampus,
a significant decrease was evidenced (Fig. 13C, F2,23= 11.0;
p,0.01). The AT100 phosphorylation was significantly increased only in the amygdala (Fig. 13B, F2,21= 5.84; p,0.01) and
hippocampus (Fig. 13D, F2,22= 5.33; p,0.01). No modification
was observed in the frontal cortex (Fig. 13A, F2,21= 0.19; p.0.05)
and hypothalamus (Fig. 13C, F2,21= 0.23; p.0.05).
Discussion
Long-term AD-like Toxicity after oAb25–35 Peptide Injection in Rats
The main finding of this study is that a single icv injection of oAb25–35provoked important physiological, behavioral,
biochem-ical and morphologbiochem-ical alterations 6 weeks after injection. The results revealed a clear similarity with numerous relevant signs of the pathology and were in line with the amyloid cascade hypothesis, while also suggesting the possible involvement of soluble oligomeric Ab fragments in the etiology of AD [3,44].
The long-term effects of oAb25–35 seemed to be generalized
since the peptide injection provoked measurable short- and long-term memory deficits, hypersecretion of glucocorticoids, BDNF deficit in the frontal cortex and amygdala, modification of APP processing and Tau phosphorylation, alteration of ER and mitochondrial homeostasis, apoptosis in the frontal cortex and amygdala, neuroinflammation processes, cholinergic deficits, hippocampal cell loss and an apparent decrease in hippocampal neurogenesis. Inflammation was maintained through astroglial and/or microglial activation in all structures considered. This observation is in accordance with AD hallmarks [45–49], insofar as neuroinflammatory processes were observed in AD patients at all pathological stages, processes which could participate in the amplification of the Ab peptides-induced toxicity [50–53].
The impact of oAb25–35 on cholinergic neurons observed at
earlier stages [20] was maintained after 6 weeks. VAChT immunoreactivity was decreased in the hippocampus, parietal cortex and basal nuclei of Meynert, but not in the hypothalamus. The cholinergic deficits induced by oAb25–35 injection therefore
seemed consistent with the well-characterized pathological hall-marks described in AD [54,55]. An effect that could be explained in part by the high levels of circulating glucocorticoids evidenced here that was shown to increase Ab1–42 and NMDA-induced
neurodegeneration in cholinergic neurons from the nucleus basalis in rat [56].
In the hippocampus, oAb25–35icv injection induced cellular loss
after 6 weeks, but only in pyramidal cells of all CA regions, while no effect was observed in granular cells of DG. In a prior study, we showed an early cellular loss in the DG [20]. This particular difference between each hippocampus region evidenced over the time deserves a very precise quantification using a stereological approach, but it could be explained in part by neurogenesis modifications between the 3rd and 6th week following oAb25–35
injection. PSA-NCAM immunolabeling seems to be more markedly decreased during the first weeks after injection than observed here after 6 weeks. This interesting observation that DG neurogenesis could finally be able to mitigate hippocampus cell loss must be accurately characterized including proliferation, migration and maturation of newborn cells with adequate markers [57], as previously reported between 5 to 30 days by Li and Zuo [58]. In other hippocampal regions, several hypotheses must be
Figure 11. Hippocampus integrity. Variations in hippocampus pyramidal cell numbers determined in rats 6 weeks after icv injection of scrambled Ab25–35peptide (10 mg/rat; negative control) or oAb25–35(10 mg/rat).A. Representative microphotographs of coronal sections of Cresyl violet stained
hippocampus CA1, CA2, CA3 and DG subfields, obtained in control untreated rats and after scrambled Ab25–35peptide or Ab25–35icv injection. Scale
bar = 300 and 100 mm.B. Average numbers of hippocampus pyramidal cells determined in untreated control rats (C) and 6 weeks after icv injection of scrambled Ab25–35peptide (10 mg/rat; negative control) or oAb25–35(10 mg/rat). The results are expressed as means 6 SEM (with n = 4 per group).
*p,0.05 and **p,0.01 vs. control rats,+p,0.05 and ++p,0.01 vs. respective scrambled peptide-treated rats. C. Effects of oAb25–35(10 mg/rat) icv
injection on hippocampus dendate gyrus (DG) neurogenesis using PSA-NCAM immunolabeling determined in untreated control rats and 6 weeks after Ab25–35scrambled amyloid peptide (10 mg/rat; negative control) or oAb25–35injection. Neurogenesis was visualized within coronal sections of
the DG with Alexafluor555-labeled specific antibody against PSA-NCAM (red immunolabeling), while the nucleus was counterstained with DAPI (blue labeling). Scale bars = 200 mm.
considered. Since glucocorticoids act synergistically with excitatory amino acids, particularly with glutamate [59,60], chronic over-stimulation could be extremely toxic [61]. Indeed, a hypersecre-tion of glucocorticoids is observed 6 weeks after oAb25–35injection
at levels that could effectively results in a deleterious effect of glucocorticoids. No other data is available at present on the effect of Ab peptide injection on glucocorticoid regulation. However, several studies demonstrated that glucocorticoids modulated APP processing [62], increased, as previously described, Ab1–42- and
NMDA-induced neurodegeneration in cholinergic neurons from the nucleus basalis in rat [56] and Ab25–35toxicity in hippocampus
neurons [63]. These observations are also coherent with AD symptoms, since a hypersecretion of glucocorticoids was frequently observed in AD patients [64,65].
The hippocampus cell loss is likely the result of apoptotic processes. An increase in pro and cleaved forms of caspase9 and -12 was observed in the hippocampus, which reflects mitochondrial and ER stress. However, these increases in initiator caspases were not associated with an activation of the effector caspase, caspase-3. Since initiator caspase-9, which can be induced by caspase-12 [66–68], also activates caspase-6 [69], it is possible that the cell loss in the hippocampus could be in part due to an activation of caspase-6 in this model. As an alternative, necrosis cell death could also be envisaged since, in vivo, the complete elimination of apoptotic cells prevents an inflammatory response, whereas necrosis often results in inflammatory reactions [70]. Moreover, in cell culture models, oAb25–35was reported to induce apoptosis
at lower concentrations (5, 10mmol/l) and necrosis at higher concentrations (20, 40mmol/l) [71]. In the frontal cortex and amygdala, oAb25–35 injection induced BDNF deficits after 6
weeks. These deficits were in line with previous results, since BDNF deficits were already observed from 2 weeks in the frontal cortex and 3 weeks in the amygdala [20]. In addition, a significant increase in caspases 9, 12 and 3 was observed in these two structures 6 weeks after oAb25–35injection. As previously reported
in several studies [72–74], BDNF deficits could be associated with a decrease in survival pathways and therefore participate in the initiation of apoptotic processes. The expression of BDNF receptors, TrkB isoforms and p75, and other neurotrophins, particularly nerve growth factor (NGF), must therefore be analyzed to clarify the involvement of trophic factors in the toxic effects induced by oAb25–35 injection. Consequently, the
oAb-induced toxicity, notably apoptotic processes, hippocampic cell loss, glucocorticoids increase, BDNF impairment and cholinergic deficits came with and could be considered as responsible for the delayed learning and memory impairments observed in oAb25–35
treated rats.
It must be noted that the oAb25–35 effects measured here on
various markers led to variations that could appear as not correlated within a particular brain region, particularly at the 6 weeks time-point used in the present study. These often subtle changes are likely due to the particular time-course of the toxicity
Figure 12. APP processing. Effects of oAb25–35 (10 mg/rat) icv
injection on APP processing in the frontal cortex, amygdala, hippo-campus and hypothalamus, determined by western blot in untreated control rats and 6 weeks after Ab25–35 scrambled amyloid peptide
(10 mg/rat; negative control) or oAb25–35injection. APP (125 KDa) and
C99 (13 KDa) variations were normalized with b-tubulin (b-tub, 55 KDa) variations and compared with non-injected rats (control group: C). The results are expressed as means 6 SEM. *p,0.05 and **p,0.01 vs. control non-injected rats (control group: C) and+p,0.05 and ++p,0.01 vs. respective scrambled peptide-treated rats. The number of animals in groups is indicated within the columns.
Figure 13. Tau phosphorylation. Effects of oAb25–35 (10 mg/rat) icv injection on Tau phosphorylation in the frontal cortex, amygdala,
hippocampus and hypothalamus, determined by western blot in untreated control rats and 6 weeks after Ab25–35scrambled amyloid peptide (10 mg/
rat; negative control) or oAb25–35icv injection. The Tau hyperphosphorylation (AT8; 50 KDa) and the abnormal Tau phosphorylation (AT100; 50 KDa)
variations were expressed in function of total Tau expression (50 KDa) and compared with non-injected rats (control group: C). The results are expressed as means 6 SEM. *p,0.05 and **p,0.01 vs. control non-injected rats (control group: C) and+p,0.05 and ++p,0.01 vs. respective scrambled peptide-treated rats. The number of animals in groups is indicated within the columns.
and intrinsic vulnerability of each brain structure, as previously reported at shorter times [20] and as observed in the pathology [75]. For instance, the hippocampus that is precociously damaged after oAb25–35[20], shows in the present work, after 6 weeks, some
signs of recovery in terms of lipid peroxidation, BDNF levels, or inflammation. In the amygdala, the lipid peroxidation decrease observed 6 weeks after oAb25–35was in the continuity and very
coherent with the measures made at earlier times in this brain region [20]. Indeed, this apparent sign of recovery could be simply explained by the fact that after the massive and rapid oxidative stress observed during the 1st and 2ndweeks after icv injection, endogenous neuroprotective mechanisms operate, limiting the extension of lipid peroxidation by increasing activity of the enzymes involved in clearance of peroxidized lipids. Such enzymes include glutathione peroxidase activity that has been recently reported to be modified after Ab25–35[76,77]. Moreover, while in
our previous study the hypothalamus appeared to be relatively insensitive to oAb25–35 [20], it seemed, here, that the effects
induced by the amyloid peptide progressively reached this structure. Indeed, an increase in oxidative stress in the hypothal-amus was shown, correlated with an increase in caspase-9 levels. Clearly, oAb25–35 induced mitochondrial dysfunction in the
hypothalamus associated with neuroinflammation processes and an increase of APP level after 6 weeks. However, no effect of oAb25–35was observed on hypothalamic cholinergic neurons, Tau
phosphorylation, C99 levels and caspase 12 and 3 levels. Likewise, in post-mortem studies, amyloid deposits were detected in the hypothalamus in late phases of AD [78]. All Ab plaques in the hypothalamus were of the Congo red-negative amorphic type [79,80] and comparable to the morphology of amyloid deposits observed in hippocampal and cortical structures more precocious-ly in AD [81]. These observations show that Ab accumulation in the hypothalamus is a delayed event compared to other structures in AD. In our model, hypothalamus seemed to show, within the time scale used in this study, a similar pattern, since it was necessary to wait 6 weeks to observe the consequences of oAb25–35
toxicity in this structure. These delayed effects of oAb25–35could
be partly due to a return of BDNF at basal levels after a sustained increase observed before [20]. As previously discussed, a decrease in BDNF-dependent survival pathways could facilitate oAb25–35
toxicity in this structure.
Involvement of Soluble Ab Short Fragments in the AD Physiopathology
For the first time in this study, we have characterized the particles composition of the aggregated Ab25–35solution injected
icv in rats. Indeed, while in previous study [20] we detailed qualitatively each component of the injected solution, here we showed that the majority of particles (more than 98%) were small soluble particles, suggesting that the toxicity observed after the icv injection of this peptide (oAb25–35) could be due to a mixture of
soluble oligomers. However, in a previous study [25], we have showed that the injection of a non-aggregated solution of Ab25–35
induced less toxicity than the aggregated solution, suggesting that bigger particles would be necessary to the toxicity. This hypothesis is reinforced by a previous result using an electronic microscopy approach and showing that bigger particles (amyloid fibrils) seemed to stabilize the smaller soluble particle forms [20].
In addition, the long-lasting presence of oAb25–35-HLF tagged
peptide in the brain not only showed that such short fragments have in vivo, an important lifespan within brain tissues, but also strongly suggested that they could participate in the maintenance of the toxicity as observed here.
Six weeks after oAb25–35 injection, APP processing, and
particularly the amyloidogenic pathway (C99 levels), was increased in the frontal cortex, amygdala and hippocampus. This long-term effect of oAb25–35 could contribute to the global toxicity always
observed after 6 weeks. Interestingly, the increase in C99 level is accompanied with a decrease in APP level in the hippocampus. In the other structures examined, both APP and C99 levels were concomitantly increased. This difference could be due to a specific activation of BACE in the hippocampus, as previously suggested [82], while, in the other structures, oAb25–35could only induce an
increase in APP expression and processing. Furthermore, as previously discussed [56,62,63], the relation between the high corticosterone levels induced by oAb25–35 and the activation of
amyloidogenic pathway must therefore be further analyzed to clarify the contribution of glucocorticoids deregulation in the amyloid toxicity and more largely in AD etiology.
oAb25–35injection also modified Tau phosphorylation. Previous
studies showed an increase of Tau phosphorylation up to 3 months after intra-amygdala injection of Ab25–35 or 4 weeks after icv
injection [32,83]. In these studies, the authors did not perform the distinction between the different phosphorylation epitopes of Tau. Here, we used two antibodies directed against AT8 and AT100 epitopes, both considered as markers of AD-related Tau phosphorylation [84]. We evidenced clearly a difference of sensitivity to oAb25–35 among the brain regions considered. An
increase of AT8 phosphorylation was noted only at the frontal cortex and amygdala levels, while it was decreased in hippocam-pus and unchanged in the hypothalamus. Concomitantly, in the same rats, the AT100 phosphorylation was increased in the amygdala and hippocampus and unchanged in the frontal cortex and hypothalamus. In fact, one explanation of these differences of sensitivity to amyloid peptide comes from recent study, where the authors evidenced an intrinsic specific regulation of Tau phosphorylation. Indeed, it seems that Tau phosphorylation occurred in a sequential order of events and that feedback mechanisms exist within neurons where the phosphorylation of certain sites would induce the dephosphorylation of other sites, in order to constantly maintain a phosphorylation level [85]. Thus in our study, it could be suggested that each brain regions could be at a different stage of Tau phosphorylation, and for instance at the hippocampal level that the phosphorylation decrease observed of the AT8 epitope could be under a negative feedback loop exerted by the phosphorylation of the AT100 epitope shown in this structure 6 weeks after oAb25–35injection.
There is no doubt that progressive Ab accumulation contributes to the AD pathology and that extracellular amyloid deposits are a hallmark of AD. However, the view that the mature amyloid fibril was the only toxic species of Ab is now challenged. Indeed, experimental studies have shown for a range of peptides and proteins that amyloid fibril formation is preceded by the appearance of organized molecular assemblies, usually termed protofibrils [86]. In addition, detailed biophysical studies are currently identifying the formation of smaller oligomeric species at earlier stages of the aggregation process, in vitro, in animal models and in patient brains. In fact, it appears highly conceivable that amyloid deposits may only be one aspect of a larger pathological cascade and indirect consequences of protective responses geared towards sequestering toxic soluble Ab molecules within plaques, from which oligomeric toxic fragments could be released by proteolysis [4,9,10,87]. The peculiar potent aggregative ability and neurotoxicity of oAb25–35, its capability to induce de novo the Ab1– 40/42protein synthesis and the abnormal phosphorylation of Tau,