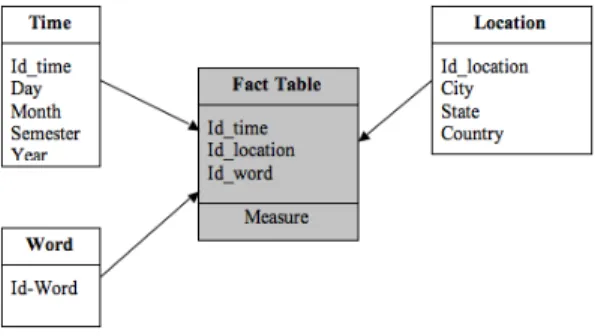
Towards an On-Line Analysis of Tweets Processing
Texte intégral
Figure
Documents relatifs
to the right. When the dogs had adjusted themselves to this position, the box was again turned to the right 90°;. Thus the door was opened by the dogs successively at the N.W.
This work also discusses the most well-know issues in the Twitter genre: the use of hashtags and the amount of OOVs, with especial focus on comparing the differences between formal
3.1 Sentiment Analysis module The sentiment analysis module relies in a SVM machine-learning model that is trained with data composed of features extracted from the TASS
We present and discuss an exper- imental setting to observe language through tweets, with a particular emphasis on the impact of visualization tech- niques on time series (messages
Green 11 , depends on comparing the dynamics of a (clas- sical) reduced distribution function for s particles with that of an isolated set of s particles, essentially expanding
Our lexical analysis approach using logistic regression produces the best results at 0.43 MCC, we describe a promising community labeling model, and discuss our attempts to
In bot detection, we used features related to behavior of the account, sentiment and va- riety of posts, in gender detection function words and emoticons.. These features were
Therefore, in this work we propose an innovative approach that combines deep learning frame- work with linguistic features specific for this issue.. This approach has been evaluated
