HAL Id: hal-03092222
https://hal.archives-ouvertes.fr/hal-03092222
Submitted on 8 Jan 2021HAL is a multi-disciplinary open access archive for the deposit and dissemination of sci-entific research documents, whether they are pub-lished or not. The documents may come from teaching and research institutions in France or abroad, or from public or private research centers.
L’archive ouverte pluridisciplinaire HAL, est destinée au dépôt et à la diffusion de documents scientifiques de niveau recherche, publiés ou non, émanant des établissements d’enseignement et de recherche français ou étrangers, des laboratoires publics ou privés.
Inter-laboratory Characterisation of Apatite Reference
Materials for Chlorine Isotope Analysis
Alicja Wudarska, Ewa Slaby, Michael Wiedenbeck, Jaime Barnes, Magali
Bonifacie, Neil Sturchio, Gérard Bardoux, Frédéric Couffignal, Johannes
Glodny, Linnea Heraty, et al.
To cite this version:
Alicja Wudarska, Ewa Slaby, Michael Wiedenbeck, Jaime Barnes, Magali Bonifacie, et al.. Inter-laboratory Characterisation of Apatite Reference Materials for Chlorine Isotope Analysis. Geostan-dards and Geoanalytical Research, Wiley, In press, �10.1111/ggr.12366�. �hal-03092222�
Inter-laboratory Characterisation of Apatite Reference Materials for
1Chlorine Isotope Analysis
23
Alicja Wudarska (1, 2)*, Ewa Słaby (2), Michael Wiedenbeck (1), Jaime D. Barnes (3), Magali 4
Bonifacie (4, 5), Neil C. Sturchio (6), Gérard Bardoux (4), Frédéric Couffignal (1), Johannes 5
Glodny (1), Linnea Heraty (6), Timm John (7), Christof Kusebauch (1), Sathish Mayanna 6
(1)†, Franziska D.H. Wilke (1), Ewa Deput (2) 7
8
(1) GFZ German Research Centre for Geosciences, Telegrafenberg, 14473 Potsdam, Germany 9
(2) Institute of Geological Sciences, Polish Academy of Sciences, Research Centre in Warsaw, Twarda 10
51/55, 00-818 Warsaw, Poland 11
(3) Department of Geological Sciences, University of Texas, Austin, TX 78712, USA 12
(4) Université de Paris, Institut de Physique du Globe de Paris, CNRS, F-75005 Paris, France 13
(5) Observatoire Volcanologique et Sismologique de Guadeloupe, Institut de Physique du Globe de 14
Paris, F-97113 Gourbeyre, France 15
(6) Department of Earth Sciences, University of Delaware, 255 Academy Street, Newark, DE 19716, 16
USA 17
(7) Institut für Geologische Wissenschaften, Freie Universität Berlin, Malteserstr. 74-100, 12449 Berlin, 18
Germany 19
* Corresponding author. E-mail: [email protected] 20
† Current address: Carl Zeiss Microscopy GmbH, Carl Zeiss Straße 22, 73447 Oberkochen, Germany 21
22
Here we report on a set of six apatite reference materials (chlorapatites MGMH# 133648, 23
TUBAF# 38 and fluorapatites MGMH# 128441A, TUBAF# 37, 40, 50) which we have 24
characterised for their chlorine isotope ratios; these RMs span a range of Cl mass fractions 25
within the apatite Ca10(PO4)6(F,Cl,OH)2 solid solution series. Numerous apatite specimens, 26
obtained from mineralogical collections, were initially screened for 37Cl/35Cl homogeneity using 27
SIMS followed by δ37Cl characterisation by gas source mass spectrometry using both dual-28
inlet and continuous-flow modes. We also report major and key trace element compositions as 29
determined by EPMA. The repeatability of our SIMS results was better than ± 0.10 ‰ (1s) for 30
the five samples with > 0.5 % m/m Cl, and ± 0.19 ‰ (1s) for the low Cl abundance material 31
(0.27 % m/m). We also observed a small, but significant crystal orientation effect of 0.38 ‰ 32
between the average 37Cl/35Cl ratios measured on three oriented apatite fragments. 33
Furthermore, the results of GS-IRMS analyses show small but systematic offset of δ37Cl SMOC 34
values between the three laboratories. Nonetheless, all studied samples have comparable 35
chlorine isotope compositions with the average 103δ37Cl
SMOC values between +0.09 and +0.42 36
and in all cases with 1s ≤ ± 0.25. 37
38
Keywords: chlorine isotopes, apatite, matrix effect, crystal orientation effect, secondary ion 39
mass spectrometry 40
41
Chlorine isotopes in apatite-group minerals have gained attention due to advances in the 42
secondary ion mass spectrometry technique (SIMS, e.g., Layne et al. 2004, Bouvier and 43
Baumgartner 2013, Kusebauch et al. 2015a,b), which have enabled the investigation of the 44
volatile elements in the Solar System based on the chlorine isotope signatures found in small 45
or heterogeneous apatite crystals from lunar (Sharp et al. 2010, Tartèse et al. 2014, Treiman 46
et al. 2014, Boyce et al. 2015) and Martian materials (Sharp et al. 2016, Bellucci et al. 2017)
47
as well as from smaller extra-terrestrial bodies such as Vesta (Sarafian et al. 2017). In addition 48
to extra-terrestrial studies, the halogen (F, Cl, Br, I) contents of apatite have been used to 49
investigate element mobility and ore formation processes (e.g., Marks et al. 2012) and also to 50
assess the extent of secondary alteration of apatite host rocks (Kusebauch et al. 2015a, 51
Wudarska et al. 2020). 52
According to the IUPAC Technical Report (Brand et al. 2014) and following further 53
recommendations for isotope data presentation by Coplen (2011) and Meisel (2019) the ratio 54
of two stable chlorine isotopes 37Cl and 35Cl in a sample should be expressed in relation to 55
Standard Mean Ocean Chloride (SMOC) using the equation: 56
𝛿 Cl=37 Cl 37 Cl sample 35 ⁄ Cl 37 Cl35 SMOC ⁄ -1 57
Moreover, it is recommended to report the relative difference of isotope ratios as 103δ37Cl 58
rather than in commonly used per mil (‰) notation (Meisel 2019). In this manuscript, however, 59
we used ‰ notation to both express measurement repeatability, which was calculated as 60
relative standard deviation, and to report the difference in instrumental mass fractionation 61
(IMF) in SIMS analyses. Furthermore, when quantifying the actual divergence of measured 62
isotope ratios from the true values defined by gas source isotope ratio mass spectrometry (GS-63
IRMS) we used the widely employed notation: 64
αinst.= ( Cl37 ⁄ Cl)35 meas.⁄( Cl37 ⁄ Cl)35 true 65
which is a unitless value directly related to the IMF induced bias according to: 66
IMF=(αinst.-1) × 1000 ‰
67
The anchor point for the 103δ37Cl
SMOC scale is +0.43 (Brand et al. 2014), which 68
corresponds to the sodium chloride NIST SRM 975 (Xiao et al. 2002). However, due to the fact 69
that the absolute ratio for this material (35Cl/37Cl = 3.1272) is associated with a significant 70
uncertainty of ± 0.0082 (2s, Shields et al. 1963), throughout this paper we recalculated 71
δ37Cl
SMOC values obtained by GS-IRMS to 37Cl/35Cl ratios using the SMOC ratio of 0.319533 72
(zero point on the δ37Cl
SMOC scale). This value was calculated based on the data reported for 73
the sodium chloride secondary reference material (RM) ISL-354: 103δ37Cl
SMOC value of +0.05 74
± 0.02 (1σ; Xiao et al. 2002) and 37Cl/35Cl ratio of 0.319549 ± 0.000044 (2σ; Wei et al. 2012). 75
The recalculation of δ37Cl values obtained by conventional methods to 37Cl/35Cl ratios for our 76
samples was necessary for quantifying the IMF of our SIMS analyses. 77
Most of the existing research on the chlorine isotope composition of geological materials 78
has been based on bulk analyses using the GS-IRMS (e.g., Eggenkamp 1994, 2014). 79
However, in those cases where limited amounts of material are available in situ analysis using 80
SIMS is the method of choice. NanoSIMS instruments have proven useful for the analysis of 81
lunar samples, where repeatability of measurements on the reference materials of ~1 ‰ is 82
acceptable in view of the large natural variations of 103δ37Cl
SMOC in lunar materials (from −1 up 83
to +81, e.g., Sharp et al. 2010, Potts et al. 2018, Stephant et al. 2019, Wang et al. 2019). In 84
contrast, the much narrower range of δ37Cl values found in most terrestrial geological samples 85
makes chlorine isotope ratio determinations challenging, both in terms of data acquisition and 86
interpretation. Two recent studies of apatite crystals from Proterozoic and Archean rocks have 87
shown that chlorine isotope signatures of apatite can help in tracing metasomatic processes 88
overprinting terrestrial rocks; such data can provide valuable information, despite displaying 89
much narrower ranges of 103δ37Cl
SMOC values (from –1.2 to +3.8, Kusebauch et al. 2015a or 90
from –0.8 to +1.6, Wudarska et al. 2020) as compared to those recorded in the extra-terrestrial 91
materials. 92
Quantitative isotope measurements by SIMS require homogeneous RMs of known 93
isotope composition. Recent SIMS studies of δ37Cl in apatite (Kusebauch et al. 2015a, Bellucci 94
et al. 2017, Sarafian et al. 2017) have been based on two end-members of the solid solution
95
series represented by chemical formula Ca10(PO4)6(F,Cl,OH)2: natural fluorapatite from 96
Durango (Mexico) and synthetic chlorapatite. A linear correction between IMF and Cl mass 97
fraction was applied based on the analyses of these two materials (Kusebauch et al. 2015a). 98
Unfortunately, these RMs are available only in small amounts. Taking into consideration the 99
narrow range of chlorine isotope ratios in terrestrial materials, SIMS measurements require 100
calibration using RMs closely matched to the chemical composition of the unknowns. 101
Therefore, the goal of our current research was to develop a suite of well-characterised, 102
homogeneous RMs covering a wide range of chlorine mass fractions in apatite making it 103
possible to precisely define the matrix-dependent IMF of SIMS measurements. This issue has 104
also been highlighted in the recent paper by Li et al. (2020) who concluded that additional RMs 105
with a range of Cl mass fractions are required for routine δ37Cl measurements, which would 106
be in addition to a newly developed apatite RM (Eppawala-AP, Sri Lanka) described therein. 107
Previous SIMS isotopic works on magnetite, hematite and sphalerite showed that there 108
may be a significant crystal orientation effect on measured oxygen and sulphur isotope ratios 109
(Huberty et al. 2010, Kita et al. 2011). In view of the anisotropic behaviour of apatite during 110
EPMA measurements (Stormer et al. 1993, Goldoff et al. 2012, Stock et al. 2015), which results 111
from the incorporation of F-, Cl- and OH- in the anion column parallel to the c-axis of the 112
hexagonal structure (Hughes and Rakovan 2002, Hughes et al. 2016), we also conducted a 113
SIMS investigation of apatite fragments that were intentionally embedded in epoxy mounts so 114
as to provide differing crystallographic orientations. 115
116
Sample selection and description
117 118
A total of 56 natural apatite samples provided by mineralogical museums were tested for 119
their chlorine isotope compositions (37Cl/35Cl) using secondary ion mass spectrometry. A suite 120
of six specimens (Figure 1, Table 1, Appendix S1) that proved to be suitably homogeneous in 121
37Cl/35Cl (repeatability of measurements within ± 0.2 ‰, 1s) and representing a broad range of 122
Cl mass fractions were further characterised using scanning electron microscopy-energy 123
dispersive spectroscopy (SEM-EDS), EPMA, SIMS, and GS-IRMS. Durango apatite, which is 124
often used as a reference material in various analytical methods (e.g., McDowell et al. 2005, 125
Kusebauch et al. 2015a, Teiber et al. 2015), has served in this study as both a test sample 126
and as a quality control material. The six selected materials, previously cleaned in acetone and 127
distilled water, were crushed and sieved to a grain-size fraction between 63 and 1400 µm (or 128
in case of Durango between 63 and 1000 µm). These subsequently underwent mineral 129
separation to remove any foreign phases and were finally split using a riffle splitter in order to 130
generate multiple, metrologically identical units (Table 1). The purity of all split materials is 131
estimated to be ≥ 98%. 132
133
Figure 1. Photographs of the six apatite samples studied as provided by the mineralogical museums. 134
135
Table 1. List of the apatite samples (in order of descending Cl mass fraction) used in this study 136
137
a Total weights of crushed apatite material produced after completion of mineral separation, which was
138
subsequently split into metrologically identical units. 139
Sample ID Source Origin Total weight a Number of splits MGMH#133648 Museum at Harvard UniversityMineralogical & Geological Norway, unknown locality 9.2 g 128
TUBAF#38 TU Bergakademie Freiberg Bamble, Norway 73.9 g 512 TUBAF#40 TU Bergakademie Freiberg Kragerø, Norway 20.0 g 128 MGMH#128441A Mineralogical & Geological
Museum at Harvard University Colorado, US 84.0 g 512 TUBAF#50 TU Bergakademie Freiberg Spain, unknown
locality 4.5 g 32 Dur Mineral dealer Durango, Cerro de
Mercado, Mexico --- ---TUBAF#37 TU Bergakademie Freiberg Bamble, Norway 207.8 g 1024
MGMH#133648 consists of seven yellow-white crystals of chlorapatite from Norway, of 140
which only the one fragment (~11.4 g) shown in Figure 1 was selected for this study, while the 141
remaining material (~13.2 g) was returned to the Mineralogical & Geological Museum at 142
Harvard University. A white crust of hydroxylapatite was removed from the surface of the 143
chlorapatite crystal using a circular saw and a micro-drill. Crushed material underwent 144
magnetic (Frantz) and heavy liquid (bromoform) separation. MGMH#133648 contains minor 145
amounts of inclusions of hydroxylapatite, Ca-Mg-Fe-silicates and aluminosilicates, and calcite. 146
TUBAF#38 is a yellow crystal of chlorapatite from Bamble, Norway. A whitish grey crust 147
of hydroxylapatite was removed from the surface of the chlorapatite crystal using a circular 148
saw. Crushed material underwent magnetic (Frantz) and heavy liquid (bromoform) separation. 149
TUBAF#38 contains minor amounts of inclusions of hydroxylapatite, Mg-silicates, Mg-Fe-Ca- 150
and K-bearing aluminosilicates, and monazite. 151
TUBAF#40 is a green crystal of fluorapatite from Kragerø, Norway. Crushed material 152
underwent magnetic (Frantz) and heavy liquid (bromoform) separation. TUBAF#40 contains 153
minor amounts of inclusions of K- and Mg-aluminosilicates, Mg-silicates, monazite, quartz, 154
calcite, Ca-sulphates and Fe-oxides. 155
MGMH#128441A is a yellow crystal of fluorapatite, which was selected for this study 156
from eight specimens from Colorado, US; the other seven crystals, having similar Cl isotope 157
compositions, were returned to the Mineralogical & Geological Museum at Harvard University. 158
Dark-green mineral (possibly amphibole) was removed from the surface and from a cavity 159
inside of the selected crystal using a micro-drill. Crushed material underwent magnetic (Frantz) 160
separation. MGMH#128441A contains minor amounts of inclusions of Fe-oxides, Ca-Mg-Fe-161
Mn-silicates and aluminosilicates (some of which probably contain minor amounts of Cl), and 162
monazite. 163
TUBAF#50 is a yellow, multi-crystal fluorapatite from Spain. Prior to crushing the sample 164
was hand-picked to remove non-apatite material (e.g., dust particles and contaminating fibres). 165
TUBAF#50 is almost free from any inclusions; only a single inclusion of Fe-silicate was 166
identified using SEM-EDS. 167
TUBAF#37 is a green fluorapatite from Bamble, Norway. Crushed material was treated 168
with 12% acetic acid (in order to remove calcite) and the material then underwent further 169
magnetic (Frantz) and heavy liquid (bromoform, diiodomethane) separation. TUBAF#37 170
contains minor amounts of inclusions of pyrite, quartz, calcite, Ca-Mg-silicates, Mg-Fe-171
aluminosilicates, Ba- and Ca-sulphates, and zircon. 172
Dur is a yellow fluorapatite from Durango, Cerro de Mercado, Mexico. A gem-quality 173
single crystal contained only minor amounts of Fe-oxides, which could mostly be eliminated by 174 careful hand-picking. 175 176
Analytical methods
177 178 Sample preparation 179For further EPMA and SIMS characterisation, apatite crystals were mounted in epoxy 180
resin in the centre of 25.4 mm diameter acrylic discs in which holes had been drilled. The 181
mounts were subsequently polished to a <5 µm surface quality as evaluated by white light 182
interferometry. A total of five mounts were produced; they contained the following materials 183
obtained from the splitting process described above: 184
– Mount #1: one unit of each sample (random crystals) and one fragment of both: the 185
Durango apatite and the NIST 610 silicate glass for tuning purposes (Figure 2), 186
– Mount #2: a few hand-picked crystals of TUBAF#37, which showed different hues of 187
yellow colour under the binocular microscope, and a few crystals of TUBAF#38 having white, 188
usually opaque, OH-enriched fragments (Appendix S2, Figure S2.1), 189
– Mount #3: a part of the white crust of hydroxylapatite mechanically removed from the 190
surface of the MGMH#133648 sample (see section “Sample selection and description”), which 191
was embedded in epoxy to determine its isotopic composition, for addressing the minor 192
amounts that we were unable to exclude from the sample splits (Appendix S2, Figure S2.2), 193
– Mount #4: three fragments of the Durango single crystal, which represent different 194
orientations with respect to c-axis, along with a piece of NIST 610 glass for tuning purposes 195
(Appendix S2, Figure S2.3), 196
– Mount #5: one unit of the Durango apatite (random crystals) for EPMA assessment 197
only (Appendix S2, Figure S2.4). 198
199
200
Figure 2. Reflected-light optical image of a gold-coated SIMS mount #1; image taken after completion 201
of the SIMS 37Cl/35Cl measurements. Note the rectangular grid pattern on the Durango fragment (Dur)
202
and on one of the MGMH#133648 grains where numerous analyses were conducted on a small area 203
through the course of the analytical sequence. 204
205
Conventional δ37Cl determinations in three independent GS-IRMS laboratories were 206
performed on identical mineralogical splits that were hand-picked in Potsdam under a binocular 207
microscope beforehand in order to remove most of the non-apatite material (minor amounts of 208
inclusions were present in some analysed samples, but special attention was paid to remove 209
any Cl-rich phases such as amphibole). 210
SEM-EDS and FE-SEM-EBSD analyses 211
Polished crystals embedded in epoxy as well as loose grains mounted on conductive 212
carbon tabs were investigated at the Helmholtz Centre Potsdam (GFZ) using an Ultra Plus 213
(Carl Zeiss, Oberkochen) field emission scanning electron microscope equipped with an EDS 214
detector (Thermo Fisher Scientific) operated at 20 kV accelerating voltage in order to identify 215
the chemical compositions of those phases associated with apatite samples. 216
The crystal orientations of the Durango apatite fragments selected for the assessment 217
of crystallographic orientation effects on measured 37Cl/35Cl ratios were determined using the 218
electron backscatter diffraction technique (EBSD). Sample mount #4 (see above), which had 219
been polished with silica colloid, was placed on a SEM stub using a carbon tape. EBSD point 220
analyses and mapping (at 0.2 µm step size) were performed using a FEI Quanta 3D field 221
emission scanning electron microscope equipped with an EBSD detector (AMETEK-EDAX 222
Digiview 5 Camera) in low vacuum mode (~100 Pa) operated at 20 kV acceleration voltage 223
and 23 nA beam current. The raw data were further processed using EDAX OIM software. The 224
EBSD mapping results were filtered based on the Confidence Index (CI) and only the points 225
having CI >0.15 were taken into consideration for further interpretation. 226
227
Chemical analysis by EPMA 228
Quantitative chemical analyses of apatite crystals were performed using the JEOL 229
Hyperprobe JXA-8500F microprobe at the GFZ. The samples were coated with a 20 nm thick 230
carbon film and analysed for major and trace elements using an acceleration voltage of 15 kV, 231
a spot size of 10 µm and two different beam current settings of 5 nA and 40 nA. Very low 232
electron beam current of 5 nA and relatively large beam diameter were applied in order to 233
minimise volatile (F, Cl) diffusion (Stormer et al. 1993, Goldoff et al. 2012), whereas a high 234
electron beam current of 40 nA was used to detect REE and other trace elements. The details 235
on the spectral lines, corresponding peak counting times and the calibration materials are 236
given in Appendix S3. Calculations of the apatite formulae based on the EPMA data were 237
performed using the method of Ketcham (2015) with normalisation done based on 25 oxygen 238
equivalents. The OH content was calculated with the assumption that the X-site is fully 239
occupied by F, Cl and OH (F + Cl + OH = 2). 240
241
Chlorine isotope homogeneity test by SIMS 242
In situ analyses of 37Cl/35Cl ratios were conducted using the Cameca 1280-HR large 243
geometry SIMS instrument at the GFZ. Prior to analyses the sample mounts were cleaned in 244
high-purity ethanol and were then argon sputter coated with a 35 nm thick high-purity gold film 245
to assure electrical conductivity. A ~2 nA, nominally 10 keV 133Cs+ primary ion beam focused 246
to a ~5 µm diameter spot was used to produce 35Cl- and 37Cl- secondary ions following a 247
modified protocol based on that of Kusebauch et al. (2015a). Using a 25 × 25 μmraster, the 248
sample surface was sputtered for 60 seconds to remove the gold coat and to suppress surface 249
contaminants. The raster was then reduced to a 15 × 15 μm, from which 35Cl- and 37Cl -250
secondary ions were collected simultaneously on Faraday cups, over 20 cycles with each cycle 251
lasting for 4 seconds. The mass resolving power (MRP) was M/ΔM ≈ 1800 (at 10 % peak 252
height). 253
According to earlier research on aluminosilicate glasses by Layne et al. (2004) a MRP 254
of 5142 is necessary to separate adjacent peaks corresponding to 35Cl- and 34S1H-. Sulphur is 255
commonly incorporated into the apatite structure (Pan and Fleet 2002); therefore, we have 256
carefully developed our SIMS measurement protocol taking into consideration the risk of this 257
potential interference. In case of TUBAF#37, which has the lowest Cl/S ratio among all tested 258
samples with 0.27 ± 0.04 % m/m of Cl and 0.25 ± 0.09 % m/m of SO3, the 34S1H- peak is nearly 259
negligible (ca. 65 counts per second) in comparison to the very intense 35Cl- peak (ca. 3.15 x 260
105 counts per second, Figure 3). Hence, this added precaution seems worth considering only 261
at very low Cl/S ratios during routine analyses. 262
263
Figure 3. Secondary ion spectrum (registered using EM) at nominal mass of 35Cl- for the apatite sample
264
TUBAF#37 illustrating isobaric interference with 34S1H- at M/ΔM ≈ 5400 (at 10% peak height). Lower
265
part of the figure shows a magnified spectrum from the upper part of this figure. 266
267
The peak corresponding to 34S1H- has been noted only using electron multiplier (EM) 268
detection, while it could not be distinguished from the background of the Faraday cup (FC). 269
Taking into consideration a very low intensity of this peak in EM detection we have concluded 270
that the isobaric interference of 34S1H- with 35Cl- is irrelevant for our apatite homogeneity test, 271
and therefore, we have conducted the measurements at a mass resolving power of ~1800 272
(Figure 4), which greatly improves ion counting rates leading to overall better data quality. 273
274
Figure 4. Secondary ion mass spectra (registered using FC) at nominal masses of 35Cl- and 37Cl- for the
275
apatite sample TUBAF#37 at M/ΔM ≈ 1800 (at 10 % peak height). 276
277
Multiple SIMS analysis points on multiple fragments were selected on all six apatite 278
samples; these locations were broadly spaced and selected in a quasi-random fashion. Our 279
SIMS data were collected in a single automatic, chain-analysis sequence that lasted ~17.5 280
hours. Instrumental drift was monitored via closely spaced analyses on both the fragment of 281
the Durango apatite and on one of the MGMH#133648 crystals that were regularly 282
interspersed throughout the run. Additional tests of selected fragments of TUBAF#37, 283
TUBAF#38 and MGMH#133648 embedded in two other mounts were conducted during the 284
same session under identical analytical conditions. Three oriented fragments of the Durango 285
apatite had been analysed a couple of months earlier following similar analytical protocol. 286
A typical count rate for 37Cl- ions was in the range from ~3.8 x 10⁶ (for fluorapatite 287
TUBAF#37) to ~9.4 x 10⁷ (for chlorapatite MGMH#133648). The depth of sputtered sample 288
pits was ~0.9 µm and the amount of consumed material during each analysis was ~250 pg as 289
based on white light interferometry (for a 3D image of a typical SIMS crater see Appendix S4). 290
Conventional δ37Cl values determination by GS-IRMS
291
Isotopic studies can be affected by inter-laboratory bias, which results from differences 292
in analytical protocols (e.g., John et al. 2010, Gonfiantini et al. 2003, Manzini et al. 2017). In 293
order to establish the extent of inter-laboratory bias for chlorine isotope measurements of 294
apatite, conventional δ37Cl values were determined independently in three gas source isotope 295
ratio mass spectrometry laboratories. A traceability material of sodium chloride ISL-354 of 296
known chlorine isotope composition (37Cl/35Cl = 0.319549, Wei et al. 2012; 103δ37Cl
SMOC = 297
+0.05, Xiao et al. 2002) was analysed along with the apatite samples. 298
299
Dual-inlet isotope ratio mass spectrometry in laboratory 1: Chlorine isotope analyses at 300
the Institut de Physique du Globe de Paris (France) were conducted using dual-inlet IRMS 301
following the methods described in Eggenkamp (1994), improved by Godon et al. (2004), and 302
used at IPGP ever since (e.g., Li et al. 2015, Eggenkamp et al. 2016, 2019). Apatite samples 303
were fully dissolved in 15.5 ml of 4.4 mol l-1 HNO
3 and placed in an oven at 75°C for ~7 hours. 304
All samples, except one (MGMH#133648), were independently dissolved two times (i.e., 11 305
separate dissolutions) before independent replicate preparation for δ37Cl measurements (n = 306
18 in total). Amount of the processed material depended on the Cl concentration: from ~24 mg 307
for chlorapatite MGMH#133648 up to ~360 mg for fluorapatite TUBAF#37. Cl was completely 308
precipitated as AgCl after the addition of 5 ml of 1 mol l-1 AgNO
3. In contrast, following the 309
recommendation of Eggenkamp (1994), for the precipitation of the internal seawater reference 310
Atlantique 2 (n = 10) and of the international reference material ISL-354 (previously dissolved 311
in ultrapure water; n = 9), we consecutively added: 4 ml of 1 mol l-1 KNO
3 (to increase the ionic 312
strength of the solution), 2 ml of McIlvaine solution (to buffer solution at pH 2.2) and 1 ml of 0.2 313
mol l-1 AgNO 3. 314
After precipitation, AgCl was filtrated and protected from light on a 0.7 µm Whatman 315
GF/F glass fibre filter. The filter was dried overnight in an oven at 80°C and subsequently 316
loaded into a pyrex tube with excess of CH3I, sealed under vacuum and reacted at 80°C for 317
48 hours. The tube was then cracked under vacuum and the CH3Cl was separated from the 318
excess of CH3I by gas chromatography (2 columns filled with Porapak Q). The final amount of 319
pure CH3Cl generated was quantified by a capacitive gauge. This provided a control of the 320
quality of the whole procedure: apatite dissolution, AgCl precipitation, CH3Cl fabrication, and 321
CH3Cl purification. Yields for the whole procedure were calculated for each prepared aliquot 322
of CH3Cl, based on the mass of apatite dissolved and the results of EPMA measurements. 323
Finally, CH3Cl was collected in a sample tube and transferred to a ThermoScientific Delta V 324
mass spectrometer. 325
All δ37Cl measurements were normalised against at least two measurements of 326
Atlantique 2 seawater (the internal seawater reference used by Godon et al. 2004 and since 327
at IPGP) run each day under the same conditions of analyses as the apatite samples. All data 328
were acquired in 3 consecutive days at IPGP. The uncertainty on each 103δ37Cl data is ± 0.04 329
(1s) based on the long-term δ37Cl reproducibility on Atlantique 2 (n = 150, and also checked 330
on 10 seawater analyses run over the course of this study). As a quality check for this 331
normalisation, the 103δ37Cl values on 9 aliquots of the international standard ISL-354 are 332
averaging at -0.01 ± 0.10 (Table 5), which is consistent with the recommended value (+0.05, 333
Xiao et al. 2002). To further check for the quality of the whole procedure for the δ37Cl 334
determination we also ran 5 aliquots of seawater prepared with addition of Na2HPO4 • 2H2O 335
salt and concentrated HNO3, and subsequently precipitated following the protocol used for the 336
dissolved apatite samples (i.e., with the addition of AgNO3 reactant only). The results of these 337
tests are presented in Table S5.1 (Appendix S5). Total Cl amounts in all aliquots produced 338
from the processed materials (the apatite samples and ISL-354) as well as in the reference 339
seawater samples were within the range of 10-20 micromoles. 340
Finally, it is noteworthy that the calculated yields for the whole procedure (i.e., all steps 341
of apatite dissolution, AgCl precipitation, CH3Cl fabrication, CH3Cl purification) are averaging 342
at 99 ± 9% (Table S5.2 in Appendix S5), reflecting an excellent match between the Cl content 343
estimated by EPMA with those measured based on apatite dissolution at IPGP. 344
Dual-inlet isotope ratio mass spectrometry in laboratory 2: Chlorine isotope analyses at 345
the University of Delaware (USA) were conducted using dual-inlet IRMS. Each apatite sample 346
was dissolved in entirety (50-580 mg) in 0.5 mol l-1 HNO
3 at room temperature. Dissolutions 347
were done for two separate units of TUBAF#50, and a single dissolution was made for one 348
unit of each of the other samples. The reference materials ISL-354 and NIST-975 were 349
dissolved in ultrapure deionized water. Two or three replicate measurements of each sample 350
and reference material were performed on separate aliquots of solution. The measurements 351
were performed in two analytical sessions a year apart using two different mass spectrometers 352
and applying additional steps in the sample preparation procedure in the second session. 353
Enough sample solution to yield between 10 and 30 micromoles Cl was aliquoted into a 354
50-cm3 centrifuge tube. The aliquot volume was then adjusted to 10 ml by addition of ultrapure 355
deionized water or by evaporation at 90°C. Each adjusted sample aliquot was then further 356
acidified with 200 µl of concentrated HNO3 and then 3 ml of 1 mol l-1 AgNO3 was added. 357
Capped centrifuge tubes were warmed in a 90°C oven for 30 minutes then moved into a dark 358
cabinet to cool and ripen overnight. AgCl solids were centrifuged at 2100 g for 3.5 minutes and 359
the supernatant solution was removed. The solids were rinsed three additional times with dilute 360
HNO3 followed by centrifugation. The solid AgCl was transferred into a pre-cleaned 9 mm 361
diameter Pyrex combustion tube using a small section of a quartz fibre filter swab and small 362
ultrapure water rinses. The AgCl was then evaporated to dryness at 90°C in a dark oven. 363
The apatite sample TUBAF#37 produced unusual, superfine precipitates that did not 364
separate from solution even after 20 minutes centrifugation. This sample was left in a dark 365
cabinet for 8 months. The finally clear supernatant was removed and analysis by ion 366
chromatography (IC) showed negligible chloride in solution. The solids were re-dissolved using 367
2 drops of concentrated NH4OH and 10 ml deionized H2O. Chloride concentration of this re-368
dissolved solution was comparable to the original raw solution. The re-dissolved TUBAF#37 369
solution was then re-acidified and 3 ml of 1 mol l-1 AgNO
3 was added. The resulting precipitates 370
were the expected AgCl solids. Aliquots of four other samples measured in the second session 371
(MGMH#133648, MGMH#128441A, TUBAF#38 and TUBAF#40) and ISL-354 were also 372
treated in the same manner. 373
Under vacuum, an excess of CH3I (~200 micromoles) was cryogenically loaded into each 374
combustion tube and sealed under vacuum with a methane-oxygen torch. Samples were then 375
reacted at 300°C for two hours (Holt et al. 1997). The mixture of CH3Cl and CH3I was 376
chromatographically separated with a 6m ¼” PoraPlot packed column with helium carrier (70 377
ml/min, 65°C). The CH3Cl peak was monitored by a thermal conductivity detector and trapped 378
using liquid nitrogen while the CH3I was backflushed to waste and the helium carrier gas was 379
pumped away. 380
In the first analytical session, the cryofocused CH3Cl was directly expanded into the dual-381
inlet bellows of a ThermoFinnigan Delta Plus XL IRMS via a series of switching valves. In the 382
second session, the CH3Cl was cryogenically transferred into a 5-ml glass bulb with a Teflon 383
HiVac valve. These samples were then manually introduced to the dual-inlet bellows of a 384
Thermo Scientific Delta V-Plus IRMS the following day. The same reference CH3Cl monitoring 385
gas was used for both mass spectrometers. The m/z 52/50 ratios of the sample gas were 386
determined relative to this reference gas with its δ52 value set to 0.0. The ISL-354 reference 387
material prepared along with the samples was used to calibrate results to the SMOC scale. 388
The NIST SRM 975 reference sample was used as an additional quality control material (Table 389
S5.3 in Appendix S5). 390
391
Continuous-flow isotope ratio mass spectrometry in laboratory 3: Chlorine isotope 392
analyses at the University of Texas (Austin, USA) were conducted using continuous flow 393
isotope ratio mass spectrometry (CF-IRMS) following the methods outlined in Eggenkamp 394
(1994) and modified by Sharp et al. (2007). Cl- was extracted from approximately 15-100 mg 395
of pre-weighed apatite via pyrohydrolysis, in which the sample is melted in the presence of an 396
ultrapure deionized water vapour and Cl- is collected in 10 ml of 20 mmol l-1 NaOH (Schnetger 397
and Muramatsu 1996, Shimizu et al. 2015). Two separate pyrohydrolysis extractions were 398
prepared for each sample. Reference material ISL-354 was dissolved in ultrapure deionized 399
water and separate aliquots were analysed from the same solution. Once the Cl- was in 400
solution, samples were prepared following the methods outlined in Eggenkamp (1994), and as 401
described in detail above. The AgCl was reacted with excess CH3I to produce CH3Cl, which 402
was purified on a column filled with Porapak Q and introduced into a ThermoElectron MAT 403
253. Measurements were calibrated against three seawater reference samples. Yields, based 404
on sample peak areas compared to reference peak areas of known Cl contents, were 104 ± 405
25%. Cl amounts in all aliquots produced from the processed materials were within the range 406
of ~0.8 to 2.4 micromoles. Samples were analysed during three separate analytical sessions. 407
This method’s 103δ37Cl uncertainties during the analytical sessions was ± 0.13 (1s), 408
which is slightly better than the laboratory’s long-term uncertainty of ± 0.20 (1s). The solution 409
leftovers from the halogen extraction via pyrohydrolysis were also analysed by IC at the GFZ 410
in order to determine Cl mass fraction and to assess yields of the Cl extraction process. Method 411
description and the results of the IC measurements are included in Appendix S5. 412
413
Results and Discussion
414 415
Chemical composition 416
All apatite samples were investigated for their chemical composition using EPMA with 417
two different electron beam current settings – 5 nA (Table 2) and 40 nA (Table 3) that enabled 418
us to obtain high quality information on the mass fractions of both volatile (F, Cl) and trace 419
elements, respectively. No zoning or margin-to-core chemical composition variations were 420
detected on the random fragments of crushed material that were investigated. For full datasets 421
of the individual EPMA measurements see Appendix S6. 422
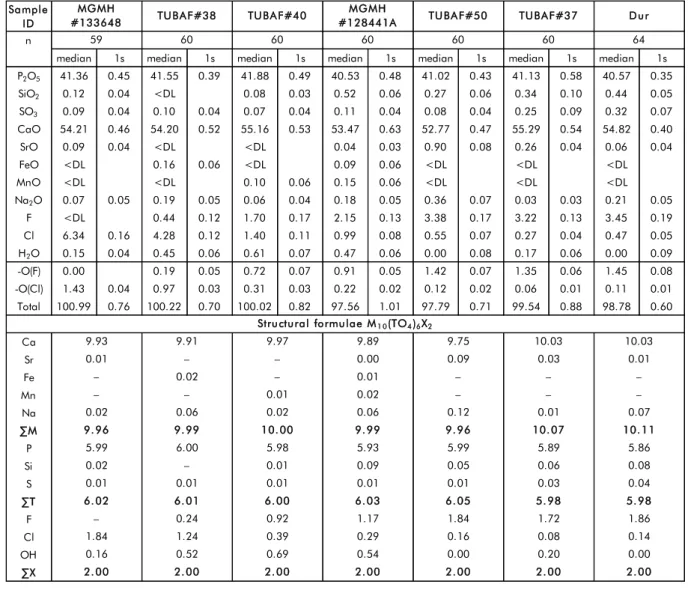
Table 2. EPMA major element data for studied apatite samples, using 15 kV, 5 nA and 10 µm beam 423
parameters 424
425
<DL – below detection limit 426
The data represent median values of between 59 and 64 individual measurements (n) conducted on a 427
total of 15 or 16 fragments of each material. H2O and OH components were calculated based on ideal 428
stoichiometry. For the EPMA full datasets and the detection limits, see Appendix S6. 429
Sample ID
n
median 1s median 1s median 1s median 1s median 1s median 1s median 1s P2O5 41.36 0.45 41.55 0.39 41.88 0.49 40.53 0.48 41.02 0.43 41.13 0.58 40.57 0.35 SiO2 0.12 0.04 <DL 0.08 0.03 0.52 0.06 0.27 0.06 0.34 0.10 0.44 0.05 SO3 0.09 0.04 0.10 0.04 0.07 0.04 0.11 0.04 0.08 0.04 0.25 0.09 0.32 0.07 CaO 54.21 0.46 54.20 0.52 55.16 0.53 53.47 0.63 52.77 0.47 55.29 0.54 54.82 0.40 SrO 0.09 0.04 <DL <DL 0.04 0.03 0.90 0.08 0.26 0.04 0.06 0.04 FeO <DL 0.16 0.06 <DL 0.09 0.06 <DL <DL <DL MnO <DL <DL 0.10 0.06 0.15 0.06 <DL <DL <DL Na2O 0.07 0.05 0.19 0.05 0.06 0.04 0.18 0.05 0.36 0.07 0.03 0.03 0.21 0.05 F <DL 0.44 0.12 1.70 0.17 2.15 0.13 3.38 0.17 3.22 0.13 3.45 0.19 Cl 6.34 0.16 4.28 0.12 1.40 0.11 0.99 0.08 0.55 0.07 0.27 0.04 0.47 0.05 H2O 0.15 0.04 0.45 0.06 0.61 0.07 0.47 0.06 0.00 0.08 0.17 0.06 0.00 0.09 -O(F) 0.00 0.19 0.05 0.72 0.07 0.91 0.05 1.42 0.07 1.35 0.06 1.45 0.08 -O(Cl) 1.43 0.04 0.97 0.03 0.31 0.03 0.22 0.02 0.12 0.02 0.06 0.01 0.11 0.01 Total 100.99 0.76 100.22 0.70 100.02 0.82 97.56 1.01 97.79 0.71 99.54 0.88 98.78 0.60 Ca Sr Fe Mn Na ∑M P Si S ∑T F Cl OH ∑X 2.00
TUBA F#38 TUBA F#40 TUBA F#50 TUBA F#37 Dur
2.00 2.00 2.00 2.00 2.00 2.00 0.14 0.16 0.52 0.69 0.54 0.00 0.20 0.00 1.84 1.24 0.39 0.29 0.16 0.08 5.98 – 0.24 0.92 1.17 1.84 1.72 1.86 6.02 6.01 6.00 6.03 6.05 5.98 0.08 0.01 0.01 0.01 0.01 0.01 0.03 0.04 0.02 – 0.01 0.09 0.05 0.06 10.11 5.99 6.00 5.98 5.93 5.99 5.89 5.86 9.96 9.99 10.00 9.99 9.96 10.07 – 0.02 0.06 0.02 0.06 0.12 0.01 0.07 – – 0.01 0.02 – – 0.01 – 0.02 – 0.01 – – – 0.01 – – 0.00 0.09 0.03 MGMH #133648 MGMH #128441A
Structural formulae M1 0(TO4)6X2
9.93 9.91 9.97 9.89 9.75 10.03 10.03
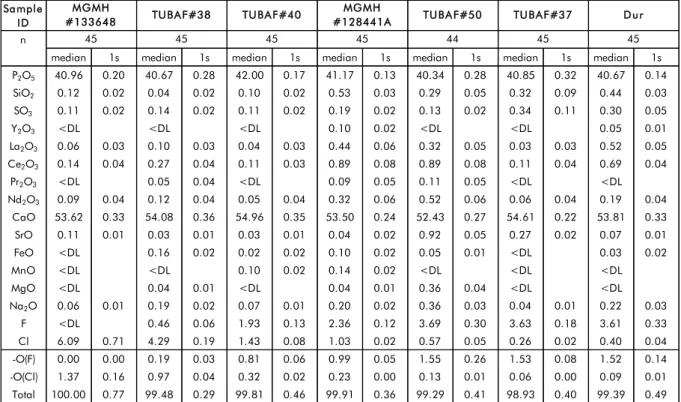
Table 3. EPMA major and trace element data for studied apatite samples, using 15 kV, 40 nA and 10 430
µm beam parameters 431
432
<DL – below detection limit 433
The data represent median values of 44-45 individual measurements (n) conducted on 15 fragments of 434
each apatite sample. For the EPMA full datasets and the detection limits, see Appendix S6. 435
436
Selected apatite samples cover almost the full compositional space of the F-Cl-OH 437
system (Figure 5) with the lowest Cl mass fraction determined for fluorapatite TUBAF#37 (0.27 438
± 0.04 % m/m, 1s) and the highest content in chlorapatite MGMH#133648 (6.34 ± 0.16 % m/m, 439
1s). Due to volatiles migration under electron beam influence (e.g., Goldoff et al. 2012), fluorine 440
content was most probably overestimated in the dataset obtained using 40 nA current, and 441
therefore, further calculations of H2O content by difference and the structural formulae were 442
carried out using exclusively our 5 nA dataset (Table 2). The chlorine mass fraction of 443
MGMH#133648 varies notably depending on the electron beam current (median values are 444
6.34 ± 0.16 % m/m (1s) and 6.09 ± 0.71 % m/m (1s) for 5 nA and 40 nA, respectively). We 445
observed grain-to-grain variations for MGMH#133648 (Appendix S6), which may suggest the 446
crystal orientation effect previously noted in EPMA studies (e.g., Goldoff et al. 2012). Grain-to-447
Sample ID
n
median 1s median 1s median 1s median 1s median 1s median 1s median 1s P2O5 40.96 0.20 40.67 0.28 42.00 0.17 41.17 0.13 40.34 0.28 40.85 0.32 40.67 0.14 SiO2 0.12 0.02 0.04 0.02 0.10 0.02 0.53 0.03 0.29 0.05 0.32 0.09 0.44 0.03 SO3 0.11 0.02 0.14 0.02 0.11 0.02 0.19 0.02 0.13 0.02 0.34 0.11 0.30 0.05 Y2O3 <DL <DL <DL 0.10 0.02 <DL <DL 0.05 0.01 La2O3 0.06 0.03 0.10 0.03 0.04 0.03 0.44 0.06 0.32 0.05 0.03 0.03 0.52 0.05 Ce2O3 0.14 0.04 0.27 0.04 0.11 0.03 0.89 0.08 0.89 0.08 0.11 0.04 0.69 0.04 Pr2O3 <DL 0.05 0.04 <DL 0.09 0.05 0.11 0.05 <DL <DL Nd2O3 0.09 0.04 0.12 0.04 0.05 0.04 0.32 0.06 0.52 0.06 0.06 0.04 0.19 0.04 CaO 53.62 0.33 54.08 0.36 54.96 0.35 53.50 0.24 52.43 0.27 54.61 0.22 53.81 0.33 SrO 0.11 0.01 0.03 0.01 0.03 0.01 0.04 0.02 0.92 0.05 0.27 0.02 0.07 0.01 FeO <DL 0.16 0.02 0.02 0.02 0.10 0.02 0.05 0.01 <DL 0.03 0.02 MnO <DL <DL 0.10 0.02 0.14 0.02 <DL <DL <DL MgO <DL 0.04 0.01 <DL 0.04 0.01 0.36 0.04 <DL <DL Na2O 0.06 0.01 0.19 0.02 0.07 0.01 0.20 0.02 0.36 0.03 0.04 0.01 0.22 0.03 F <DL 0.46 0.06 1.93 0.13 2.36 0.12 3.69 0.30 3.63 0.18 3.61 0.33 Cl 6.09 0.71 4.29 0.19 1.43 0.08 1.03 0.02 0.57 0.05 0.26 0.02 0.40 0.04 -O(F) 0.00 0.00 0.19 0.03 0.81 0.06 0.99 0.05 1.55 0.26 1.53 0.08 1.52 0.14 -O(Cl) 1.37 0.16 0.97 0.04 0.32 0.02 0.23 0.00 0.13 0.01 0.06 0.00 0.09 0.01 Total 100.00 0.77 99.48 0.29 99.81 0.46 99.91 0.36 99.29 0.41 98.93 0.40 99.39 0.49
TUBA F#50 TUBA F#37 Dur
45 45 45 45 44 45 45 MGMH #133648 MGMH #128441A TUBA F#38 TUBA F#40
grain variations were also observed for TUBAF#38, but Cl contents are similar with median 448
values at 4.28 ± 0.12 % m/m (1s) and 4.29 ± 0.19 % m/m (1s) for 5 nA and 40 nA 449
measurements, respectively. Both MGMH#133648 and TUBAF#38 contain OH-enriched 450
areas identified in our SEM-based investigation of the inclusions, which could be the reason 451
for grain-to-grain variations. It should be noted that these variations have not been detected in 452
the 5-nA measurements, which were carried out at random location of the very same crystal 453
fragments as the 40 nA analyses. We note, however, that the sample mount was re-polished 454
between the two sessions devoted to 5 nA and 40 nA measurements. Therefore, we advise 455
using MGMH#133648 and TUBAF#38 with caution for chlorine abundance determinations due 456
to a possible heterogeneous Cl/OH ratio in these two particular chlorapatite specimens. 457
458
459
Figure 5. Ternary plot showing median F-Cl-OH compositions of the studied samples determined by 460
EPMA (Table 2). 461
462
The minerals of the apatite group can commonly incorporate different minor and trace 463
elements into both cationic (e.g., La3+, Ce3+, Pr3+, Nd3+, Sr2+, Mg2+, Na+) and anionic positions 464
(e.g., SiO44-, SO42-, Pan and Fleet 2002). Accordingly, in the studied apatite samples various 465
types and amounts of minor and trace elements were investigated. TUBAF#50 and 466
MGMH#128441A are very rich in REEs, while MGMH#133648 and TUBAF#40 contain fewer 467
such trace elements. Significant amounts of other components such as Sr, Mg and Na were 468
detected in TUBAF#50. The chemical composition of Dur (Durango, Mexico) closely matches 469
the composition of other crystals from the same locality (e.g., Harlov and Förster 2003, Marks 470
et al. 2012), which confirms the validity of the EPMA protocols applied in this study.
471 472
SIMS homogeneity test of 37Cl/35Cl ratios
473
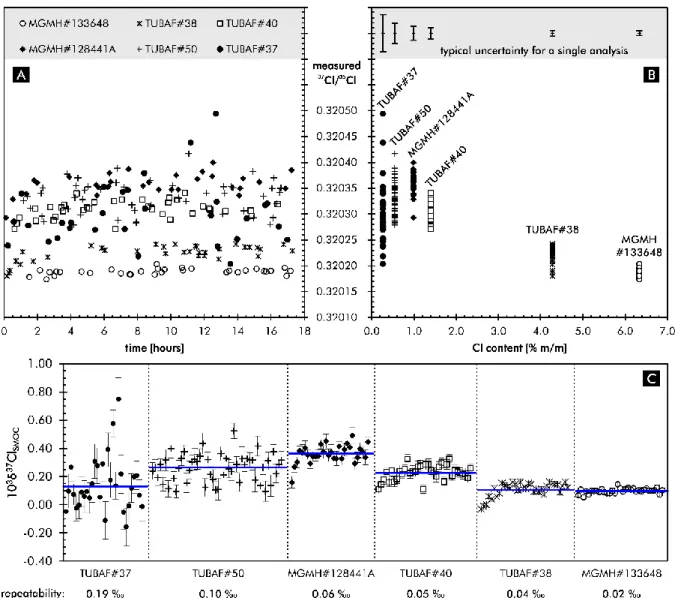
The homogeneity test conducted on random apatite fragments from one unit of each 474
sample (Figure 2) confirmed that they are sufficiently homogeneous at the sub-nanogram 475
sampling scale in terms of their chlorine isotope composition. The repeatability of ≥30 476
measurements performed on a minimum of 15 fragments was better than ± 0.2 ‰ (1s, i.e., 1 477
standard deviation) for all samples (Table 4, Figure 6, Appendix S7); in fact, it was better than 478
± 0.1 ‰ for all five samples having >0.5 % m/m Cl. All specimens were tested during the same 479
analytical session under the identical conditions, and therefore, the measurements yielded 480
better counting statistics and repeatability for Cl-rich samples. An average uncertainty of single 481
analysis determined for each sample was between ± 0.01 ‰ (1s) for chlorapatite 482
MGMH#133648 and ± 0.11 ‰ (1s) for fluorapatite TUBAF#37 (Figure 6). Our instrumental drift 483
monitor analyses interspersed periodically with analyses of the studied apatite samples 484
showed that the data were collected under stable conditions, and therefore no offline drift 485
corrections were necessary. 486
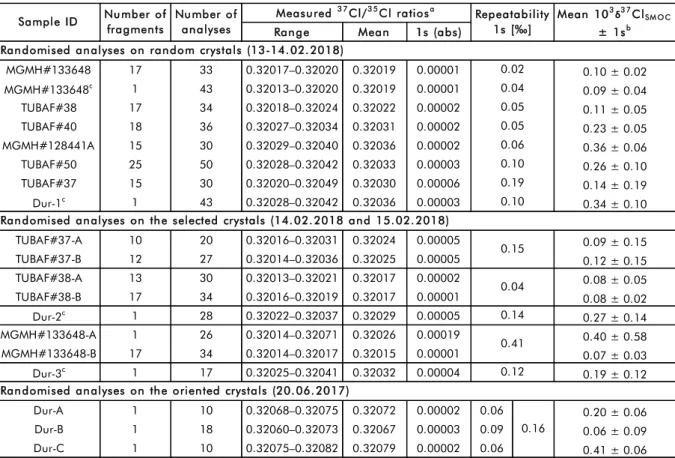
Table 4. Results of SIMS homogeneity tests 487
488
For full datasets of all individual SIMS analyses see Appendix S7. 489
a Not corrected for IMF.
490
b The data collected in February 2018: 103δ37Cl values were calculated based on the correlation of α inst
491
with Cl concentration (for further details see Figure 10 and subsection "Matrix effect and instrumental 492
mass fractionation"). The data collected on the oriented crystals in June 2017: 103δ37Cl values were
493
calculated based on the αinst determined using the mean 37Cl/35Cl ratio for Dur-A, Dur-B, and Dur-C. The
494
data reduction for all measurements was conducted using the absolute SMOC 37Cl/35Cl ratio of 0.319533
495
(zero point on the δ37ClSMOC scale;see the third paragraph of Introduction for further details).
496
c Instrumental drift monitor analyses regularly interspersed with analyses of the studied apatite samples.
497
Dur-1, Dur-2 and Dur-3 indicate three randomly oriented fragments of the Durango apatite, which were 498
used for monitoring the instrumental drift. 499
Range Mean 1s (abs)
MGMH#133648 17 33 0.32017–0.32020 0.32019 0.00001 0.10 ± 0.02 MGMH#133648c 1 43 0.32013–0.32020 0.32019 0.00001 0.09 ± 0.04 TUBAF#38 17 34 0.32018–0.32024 0.32022 0.00002 0.11 ± 0.05 TUBAF#40 18 36 0.32027–0.32034 0.32031 0.00002 0.23 ± 0.05 MGMH#128441A 15 30 0.32029–0.32040 0.32036 0.00002 0.36 ± 0.06 TUBAF#50 25 50 0.32028–0.32042 0.32033 0.00003 0.26 ± 0.10 TUBAF#37 15 30 0.32020–0.32049 0.32030 0.00006 0.14 ± 0.19 Dur-1c 1 43 0.32028–0.32042 0.32036 0.00003 0.34 ± 0.10 TUBAF#37-A 10 20 0.32016–0.32031 0.32024 0.00005 0.09 ± 0.15 TUBAF#37-B 12 27 0.32014–0.32036 0.32025 0.00005 0.12 ± 0.15 TUBAF#38-A 13 30 0.32013–0.32021 0.32017 0.00002 0.08 ± 0.05 TUBAF#38-B 17 34 0.32016–0.32019 0.32017 0.00001 0.08 ± 0.02 Dur-2c 1 28 0.32022–0.32037 0.32029 0.00005 0.27 ± 0.14 MGMH#133648-A 1 26 0.32014–0.32071 0.32026 0.00019 0.40 ± 0.58 MGMH#133648-B 17 34 0.32014–0.32017 0.32015 0.00001 0.07 ± 0.03 Dur-3c 1 17 0.32025–0.32041 0.32032 0.00004 0.19 ± 0.12 Dur-A 1 10 0.32068–0.32075 0.32072 0.00002 0.06 0.20 ± 0.06 Dur-B 1 18 0.32060–0.32073 0.32067 0.00003 0.09 0.06 ± 0.09 Dur-C 1 10 0.32075–0.32082 0.32079 0.00002 0.06 0.41 ± 0.06 0.15 0.04 0.41 0.12 0.16 0.05 0.06 0.10 0.19 0.10 Mean 103 δ3 7ClSM O C ± 1sb
Randomised analyses on random crystals (13-14.02.2018)
Randomised analyses on the oriented crystals (20.06.2017)
Randomised analyses on the selected crystals (14.02.2018 and 15.02.2018) Sample ID Number of fragments Number of analyses Measured
3 7Cl/3 5Cl ratiosa Repeatability 1s [‰] 0.14 0.02 0.04 0.05
500
Figure 6. (a, b) Individual 37Cl/35Cl measurements by SIMS (not corrected for IMF). (a) The data were
501
collected under stable conditions in a single automatic, chain-analysis sequence that lasted ~17.5 hours. 502
An offline correction for instrumental drift was unnecessary. (b) Repeatability of SIMS analyses was 503
better than 0.10 ‰ (1s) for all five samples having more than 0.5 % m/m of Cl (TUBAF#50, 504
MGMH#128441A, TUBAF#40, TUBAF#38, MGMH#133648), and 0.19 ‰ for the low Cl abundance 505
apatite TUBAF#37. The uncertainty bars represent a typical within-run 1s uncertainty for each material; 506
they decrease from ± 0.11 ‰ for fluorapatite TUBAF#37 to ± 0.01 ‰ for chlorapatite MGMH#133648. 507
(c) SIMS 103δ37Cl values were calculated based on a correlation of IMF factor with Cl mass fraction. For
508
further details see Figure 10 and subsection "Matrix effect and instrumental mass fractionation". The 509
uncertainty bars represent within-run 1s uncertainty for each data point and the horizontal lines 510
represent weighted means for each material. 511
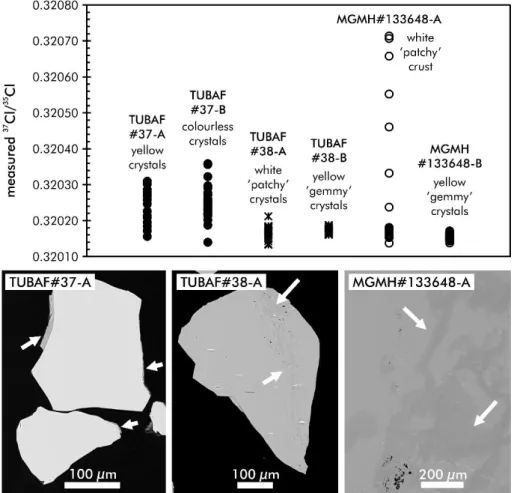
Additional tests were conducted on hand-picked grains of TUBAF#37 and TUBAF#38, 512
which looked visually different under the binocular microscope. A few grains representing 513
yellow and colourless crystals of TUBAF#37 as well as milky and transparent crystals of 514
TUBAF#38 (Appendix S2) were investigated using SEM-EDS and further analysed by SIMS 515
for their chlorine isotope compositions (Table 4, Figure 7, Appendix S7). BSE images collected 516
for TUBAF#37 reveal that the yellow colouring results from a thin calcite layer, which covers 517
some of the crystals, and which accordingly would have no impact on the 37Cl/35Cl ratios. 518
Therefore, the chlorine isotope composition of yellow crystals in TUBAF#37 is consistent with 519
the composition of colourless grains. Furthermore, SEM investigation showed that the white, 520
usually opaque fragments of TUBAF#38 preserved traces of OH-replacement processes in 521
this chlorine-rich sample. The SIMS determined 37Cl/35Cl ratios of OH-enriched areas were 522
measured and compared to the values collected for transparent, light-yellow crystals of 523
TUBAF#38. This test showed only very small differences between the two crystal types (0.25 524
‰ between two most extreme values; n = 64). In contrast, a similar test conducted on a piece 525
of white crust removed from the surface of MGMH#133648 showed significant differences (up 526
to 1.75 ‰; n = 60; Table 4, Figure 7, Appendix S7) between the most extreme value determined 527
in OH-enriched area and the average 37Cl/35Cl ratio for the volumetrically dominant, 528
transparent, yellow crystals of MGMH#133648. The white crust was cut from the 529
MGMH#133648 prior to crushing, but some minor amounts are still present in the split material. 530
Therefore, we recommend that careful BSE and reflected-light optical observations of mounted 531
polished crystals should be made prior to isotopic analyses so as to exclude any inclusions in 532
all reference materials or OH-enriched areas in TUBAF#38 and MGMH#133648. 533
534
Figure 7. 37Cl/35Cl ratios measured using SIMS (not corrected for IMF) on hand-picked apatite crystals
535
of TUBAF#37 and TUBAF#38(see Figure S2.1) as well as on a piece of white crust of hydroxylapatite 536
mechanically removed from the surface of MGMH#133648 (Figure S2.2). In lower panels the arrows on 537
the BSE images indicate anomalous material present in TUBAF#37-A (a thin carbonate layer on the 538
apatite crystals), TUBAF#38-A (OH-enriched veins) and MGMH#133648-A (OH-enriched areas in the 539
crust). 540
541
Crystallographic orientation effect on SIMS measured 37Cl/35Cl ratios
542
Minerals of the apatite group usually crystallise in the hexagonal crystal system (with 543
space group P63/m), but lowering of the symmetry is possible due to extensive cationic and 544
anionic substitutions in the lattice (Hughes and Rakovan 2002). The apatite crystal structure 545
parameters readily responds to the various content of the anion position, which is parallel to 546
the c-axis of the hexagonal structure (e.g., Hughes et al. 2016). Accommodation of monovalent 547
anions such as Cl- and F- in the anion column entails migration and exchange of these 548
elements not only during the post-crystallisation processes, but also under the influence of the 549
electron bombardment during the quantitative measurements by EPMA (Stormer et al. 1993, 550
Goldoff et al. 2012, Stock et al. 2015). It has been shown that the crystallographic orientation 551
of apatite has a significant effect on the time-dependent X-ray intensities of fluorine and 552
chlorine (e.g., Goldoff et al. 2012). Furthermore, previous SIMS works devoted to e.g., 553
magnetite, hematite and sphalerite have also shown a significant crystal orientation effect on 554
measured oxygen and sulphur isotope ratios (Huberty et al. 2010, Kita et al. 2011). Therefore, 555
in this portion of our study three apatite fragments from a single crystal, but having differing 556
orientations to the c-axis, were investigated by SIMS. 557
A portion of an euhedral crystal of the Durango fluorapatite was cut approximately 558
perpendicular, parallel and slantwise (bevel cut) to the c-axis anion channel of the apatite 559
structure. The orientation of these crystal fragments was confirmed by EBSD mapping (Figure 560
8), which showed that Dur-A is perpendicular to the c-axis and is close to (0001) plane, Dur-B 561
is parallel to the c-axis (close to (112̅0) plane), while Dur-C has an intermediate orientation. 562
EBSD mapping of the Durango fragment cut slantwise to the c-axis channel (Dur-C) showed 563
some variability in crystal orientation (visible as yellowish areas in the violet background in 564
Figure 8). This is possibly an instrumental artefact related to the quality of the surface, but this 565
interpretation needs further confirmation. Moreover, it was not possible to establish the Miller-566
Bravais indices for Dur-C due to the inconclusive results from EBSD point analyses; therefore, 567
it is unclear which crystallographic plane is represented by the Dur-C fragment. 568
569
Figure 8. Results of crystal orientation test of three Durango apatite fragments having different crystal 570
orientation with respect to the c-axis. EBSD maps showed that Dur-A (red) is perpendicular to the c-axis 571
and is close to (0001) plane, Dur-B (blue) is parallel to the c-axis (close to (112̅0) plane), while Dur-C 572
(violet) has an intermediate member. The average 37Cl/35Cl ratios measured by SIMS in these crystals
573
differ by up to 0.38 ‰ (between Dur-B and Dur-C). The mapping results were filtered based on 574
Confidence Index and the black spots visible on the maps correspond to CI <0.15. The black lines are 575
most likely the polishing artefacts. 576
577
Repeatability of widely distributed SIMS analyses conducted on the individual oriented 578
fragments was in all three cases better than ± 0.09 ‰ (1s, n = 10-18, Table 4, Appendix S7), 579
proving their internal homogeneity, while the repeatability of the measurements of all three 580
fragments was ± 0.16 ‰ (1s, n = 38). For the Cameca 1280-HR SIMS instrument operated at 581
primary and secondary accelerating voltages of +10 kV and –10 kV, respectively, the incident 582
Cs+ beam angle is 21° from the normal to the sample surface (Huberty et al. 2010). 583
Consequently, during the measurements of Dur-A and Dur-B the incident primary beam angle 584
was about 20° and 70° from the c-axis channel, respectively. The SIMS analyses yielded 585
higher (by 0.16 ‰) 37Cl/35Cl
measured ratios for Dur-A (0.32072 ± 0.00002, 1s) as compared to the 586
ratios measured in Dur-B (0.32067 ± 0.00003, 1s). This further suggests that interaction of the 587
primary Cs+ beam with the chlorine ions in the apatite channel enhances mobility of the heavier 588
isotope 37Cl. The difference between the mean 37Cl/35Cl ratios calculated for the parallel (Dur-589
B) and the intermediate (Dur-C; 37Cl/35Cl
measured = 0.32079 ± 0.00002, 1s) members is even 590
greater: they differ by 0.38 ‰. Taking the average 37Cl/35Cl ratio of 0.32071 ± 0.00005 (1s) for 591
all three crystal fragments and the recommended 103δ37Cl
SMOC value of +0.19 ± 0.07 for 592
Durango apatite (Table 5), the corresponding 103δ37Cl
SMOC values for each individual crystal 593
are as follows: +0.20 ± 0.06 (Dur-A), +0.06 ± 0.09 (Dur-B) and +0.41 ± 0.06 (Dur-C). Despite 594
the fact that the exact angle between the primary beam and the crystallographic plane 595
represented by Dur-C could not be established, this test shows that there is a significant 596
crystallographic orientation effect on 37Cl/35Cl ratios measured in apatite, which should be 597
taken into consideration during future SIMS works. 598
599
Conventional δ37Cl values
600
Conventional analyses (GS-IRMS) of stable chlorine isotopes have been successfully 601
applied to various geological materials, mostly fluids, silicates and salts (e.g., Godon et al. 602
2004, Sharp et al. 2007, Bonifacie et al. 2007, Li et al. 2015, Eggenkamp et al. 2019). GS-603
IRMS data for the minerals of the apatite group are scarce (e.g., Kusebauch et al. 2015c) and 604
the impact of choices made when designing an analytical protocol has not previously been 605
established. 606
All apatite samples investigated within this study have comparable chlorine isotopic 607
compositions with the average 103δ37Cl
SMOC values clustering between +0.09 and +0.42, which 608
is in contrast to a wider range of values represented by the two reference samples – Durango 609
(+0.5) and synthetic chlorapatite (+2.0) – characterised by Kusebauch et al. (2015a) or the 610
Norwegian samples studied therein which span a range from –1.2 up to +3.7. Determined 611
103δ37Cl
SMOC values do not correlate with Cl mass fractions (Figure 9, Table 5). There are 612
significant differences between individual data sets generated in three independent GS-IRMS 613
laboratories. The offset of 103δ37Cl
SMOC values is not constant for all studied specimens and it 614
varies from 0.05 to 0.67. However, the values determined at the UT Austin are generally the 615
highest, whereas those measured in IPGP are usually the lowest and the values reported by 616
the Delaware laboratory in most cases fall between the data provided by the other two 617
laboratories. In contrast, for all three GS-IRMS laboratories the 103δ37Cl
SMOC values 618
determined for sodium chloride ISL-354 are in close agreement to the published value of +0.05 619
(Xiao et al. 2002), which confirms that the analytical protocols for silver chloride precipitation 620
and measurement were developed and applied properly in all three laboratories. 621
622
Figure 9. δ37ClSMOC values determined independently in three GS-IRMS laboratories. The average
623
103δ37ClSMOC values are within a range of +0.09 to +0.42 and do not correlate with apatite Cl mass
624
fractions. A small bias can be seen between the laboratories. The error bars represent the uncertainties 625
(1s) established during analytical sessions in each GS-IRMS laboratory. Continuous-flow IRMS 626
determinations of 103δ37Cl are characterised by higher uncertainty of ± 0.13 (1s, UT Austin) and higher
627
103δ37ClSMOC values than those conducted in dual-inlet mode (± 0.04, 1s, for both IPGP and U.
628
Delaware). 629
Table 5. δ37ClSMOC values determined by GS-IRMS for the apatite samples and isotopic reference
630
material ISL-354. 631
632
a The reference 103δ37Cl value for ISL-354 is +0.05 (Xiao et al. 2002).
633
MGMH
#133648 TUBA F#38 TUBA F#40
MGMH
#128441A TUBA F#50 TUBA F#37 Dur ISL-354a
0.02 0.04 -0.10 0.23 0.09 0.03 -0.15 -0.03 0.03 -0.05 0.11 -0.04 0.16 -0.03 0.04 0.29 -0.12 -0.08 -0.08 0.00 0.17 0.06 0.03 -0.03 -0.01 0.01 -0.14 -0. 01 ± 0. 03 -0. 02 ± 0. 06 -0. 01 ± 0. 06 0. 23 ± 0. 06 0. 01 ± 0. 11 -0. 01 ± 0. 05 -0. 01 ± 0. 10 0.09 0.08 0.20 0.46 0.35 0.06 0.08 0.09 0.21 0.47 0.34 0.04 -0.04 0.03 0.27 0.47 0.37 0.03 -0.04 0.03 0.27 0.48 0.38 0.03 0.37 0.03 0.03 0.16 0.00 0.19 0.35 0.16 0.19 0.13 0.14 0.01 0.18 0.34 0.18 0.18 0.13 0.15 0.18 0.14 0.16 0.25 0.23 0.03 0.25 0.23 0.04 0.25 0.23 0.03 0.23 0.23 0.03 0.02 0. 09 ± 0. 08 0. 04 ± 0. 04 0. 22 ± 0. 04 0. 43 ± 0. 06 0. 36 ± 0. 02 0. 22 ± 0. 04 0. 20 ± 0. 03 0. 05 ± 0. 04 0.25 0.20 0.03 0.19 0. 23 ± 0. 40 0. 43 ± 0. 20 0. 66 ± 0. 08 0. 68 ± 0. 36 0. 66 ± 0. 15 0. 34 ± 0. 09 0. 17 ± 0. 10 -0. 05 ± 0. 14 12 11 13 11 10 10 12 ---0. 09 ± 0. 16 0. 09 ± 0. 19 0. 20 ± 0. 24 0. 42 ± 0. 20 0. 32 ± 0. 25 0. 20 ± 0. 13 0. 19 ± 0. 06 ---0.319563 0.319563 0.319596 0.319667 0.319634 0.319596 0.319594 ---Aliquot 2 --- ---
---Laboratory 3 at University of Texas, continuous-flow mode, pyrohydrolysis
103
δ37ClSMOC
individual analyses
Aliquot 1 -0.05 0.58 0.72 0.93 0.56 0.40 Laboratory 1 at IPGP, dual-inlet mode, sample dissolution in 4. 4 mol l- 1 HNO
3
Laboratory 2 at University of Delaware, dual-inlet mode, sample dissolution in 0. 5 mol l- 1 HNO 3 103 δ37ClSMOC individual analyses in 1st session Aliquot 1 --- ---Aliquot 2 --- ---Aliquot 3 --- --- --- --- --- ---0.04 Aliquot 2 0.51 0.29 0.60 0.42 0.77 0.27 -0.15
Summary of the GS-IRMS results Total number of measurements (n)
37Cl/35Cl ratiosc 103 δ3 7ClSM O C working values (± 1s)b Mean 103 δ3 7ClSM O C (± 1s) Mean 103 δ3 7ClSM O C (± 1s) ---Sample ID Mean 103 δ3 7ClSM O C (± 1s) 103 δ37ClSMOC individual analyses Aliquot 1 103 δ37ClSMOC individual analyses in 2nd session Aliquot 4 ---Aliquot 5 --- --- --- ---