Biomechanical and Biochemical Properties of Tissue Engineered
Neocartilage Before and After Implantation
by
Regina K. Cheung
Submitted to the
B.S. Engineering and Applied Science (Mechanical Engineering)
California Institute of Technology, 2001
Department of Mechanical Engineering in Partial the Requirements for the Degree of
Fulfillment of
Master of Science in Mechanical Engineering at the
Massachusetts Institute of Technology June 2003
© 2003 Massachusetts Institute of Technology. All Rights Reserved.
MASSACHUSETTS INSTITUTE OF TECHNOLOGY
JUL 0 8 2003
LIBRARIES Signature of Autho Certified by: Certified by: r:/ Deportment ot Mech.pfcal Engineering May 23, 2003
%Ian J. Grodzinsky Dirptor, Center tq-uio e ical Engineering, MIT Professor of Electrical, Mechanical, an Biological Engineering
Fhesis Supervisor
Ain A. Sonin Professor of Mechanical Engineering
Biomechanical and Biochemical Properties of Tissue Engineered Neocartilage Before and After Implantation
by
Regina K. Cheung
Submitted to the Department of Mechanical Engineering on May 23, 2003 in Partial fulfillment of the Requirements for the Degree of Master of Science in
Mechanical Engineering
ABSTRACT
A novel serum free culture system has been developed in an attempt to generate 3D hyaline like neocartilage independent of polymer scaffolds. This neocartilage is being investigated as a possible implant material for cartilage repair. Biomechanical and biochemical data was acquired for neocartilage grown from donors of a variety of ages and cultured for different durations. Grafts which had been implanted in sheep, as well as surrounding cartilage sites, were also biomechanically analyzed.
Neocartilage from younger ovine donors was stiffer than that from more mature ovine donors. Longer culture times also yielded stiffer ovine and human constructs. The use of tissue transglutaminase in fixing the graft to the defect site may have aided healing, although the mechanism is unclear. Graft stiffness was not found to significantly increase with healing time; however, more samples are needed to confirm this trend. Cartilage surrounding the graft site and from the contralateral joint was found to be significantly affected; eight weeks post-operation, mechanical compressive stiffness dropped and shear stiffness rose. Twenty-six weeks post-operation, the stiffness returned to levels found in control sheep.
Thesis Supervisor: Alan J. Grodzinsky
Acknowledgements
First and foremost, I want to thank my advisor, Professor Alan Grodzinsky, for being a wonderful teacher and mentor these past two years. Many thanks also to Eliot Frank and Han Hwa Hung for all their help in the laboratory. I would also like to acknowledge my collaborators from Isto Technologies; without Joseph Feder, Bob Spiro, Davis Adkisson, Neil Kizer, and Jena Strauss-Schoenberger, this study would not have been possible. Finally, I would like to thank Robin Friedman, Parth Patwari, Nora Szaz, Stephanie Lin, Laurel Ng, Delphine Dean, and everyone else from the Continuum Electromechanics Lab for their time and support.
Table of Contents
Abstract --- 2 Acknowledgements --- 3 Table of Contents --- 4 Chapter 1 - Introduction --- 6 Background --- 6Mechanical Properties of Articular Cartilage --- 7
Natural Healing of Cartilage --- 8
Challenges of Cartilage Engineering --- 8
A New Method --- 13
Objectives and Hypotheses --- 14
Chapter 2 - Methods --- 15
Neocartilage Biomechanics --- 15
Materials --- 15
Preparation of Disks and Strips for Compression and Tension Tests --- 16
Mechanical Testing in Confined Compression and Tension Testing --- 17
Sheep Cartilage and Graft Biomechanics --- 18
Materials --- 18
Preparation of Cartilage for Compression and Shear Tests --- 20
Mechanical Testing in Confined Compression and Torsional Shear --- 20
Biochemistry --- 21
GAG and Collagen Content: Donor Species and Age --- 28
Ovine GAG and Collagen Content: Time Course --- 29
Human GAG and Collagen Content: Time Course --- 30
Biomechanical/Biochemical Correlations --- 31
Ovine Implants --- 31
Study 1 --- 31
Stiffness of Ovine Tissue from Different Sites: Both Studies --- 32
Stiffness of Ovine Tissue Sites in Study 1 --- 34
Effect of Tissue Transglutaminase and Weight Bearing Condition --- 38
Stiffness of Ovine Tissue over Time: Both Studies --- 40
Chapter 4 - Discussion --- 44
Neocartilage - Effect of Donor Age --- 44
Ovine Cartilage and Grafts --- 45
Study 1 - Effect of Tissue Transglutaminase and Weight Bearing Condition --- 45
Healing Duration - Effect on Graft and Surrounding Cartilage --- 45
Conclusions and Next Steps --- 47
Neocartilage --- 47
Ovine Implants --- 48
References --- 50
Appendices --- 52
Appendix A - Construct Biomechanics --- 52
Appendix B - Construct Biochemistry --- 75
Appendix C - Ovine Biomechanics --- 79
Chapter 1 - INTRODUCTION
Background
Articular cartilage is the dense connective tissue that covers certain areas of bone. It serves as a shock absorber, softening the impact during loading. Cartilage consists of chondrocytes embedded in an extracellular matrix (ECM) of type I collagen, aggrecan, and highly charged proteoglycans. The components of the ECM are key to cartilage withstanding the complex compressive, tensile, and shear forces encountered in joints.
Aggrecan is a large aggregating chondroitin sulfate proteoglycan. A monomer of aggrecan consists of a protein backbone, on which 100 - 150 chondroitin sulfate
glycosaminoglycan (cs-GAG) chains and 30-60 keratin sulfate chains are attached. Up to 100 individual aggrecan monomers bind via a link protein to hyaluranon to form a large aggregate that has a molecular size up to 800 MDa. These aggregates make up approximately 10% of the wet weight of cartilage.
Glycosaminoglycan (GAG) chains, a major component of aggrecan, are linear polymers of repeating disaccharides with hexosamine, carboxylate, and/or sulfate ester functionalities. In cartilage, these functionalities cause aggrecan to have a high anionic
Mechanical Properties of Articular Cartilage
Aggrecan Hyaluronate
Collagen 11 Chondrocyte By Nora Szaz
Cartilage is a negatively charged, viscoelastic material in which the proteoglycans are fixed negative charges. Compression of cartilage results in
deformation of chondrocytes and the extracellular matrix. Repulsion between charged proteoglycans contributes to stiffness, and resulting fluid flow induces streaming potentials and currents. Tensile strength is a function of the collagen fibrillar network.
The mechanical properties of cartilage can change with time. It has been
observed that chondrocytes can respond to various physical stimuli by altering the ECM. Static mechanical compression of cartilage explants in vitro decreases proteoglycan and
aggrecan to hyaluranon [6]. Dynamic compression can increase biosynthesis [7], and large amplitude dynamic compression can induce degradation and loss of matrix [8].
These in vitro data sets indicate that cartilage is in fact a complex feedback system wherein chondrocytes respond to loading by altering the ECM. This in turn alters the mechanical properties, which changes the loading on the cells... and the cycle
continues.
Natural Healing of Cartilage Injury
Cartilage is avascular, alymphatic, and has low cell density. Chondrocytes do not easily proliferate, therefore cartilage injuries generally do not heal well. Further
complications are caused by complex mechanical loading of joints; a change in the surface of the cartilage also causes a change in the loading profile, possibly affecting the remaining chondrocytes.
Once chondrocytes are damaged or lost, the surrounding matrix gradually degenerates. Without help, the body is not able to repair these defects. For this reason, the area of tissue engineered cartilage is of great interest to medicine.
responds to loading like the surrounding cartilage? To answer this, many factors must be taken into account. What cell source is best? Should the cells be seeded in a
scaffold or not? How can mechanical and biochemical viability be ensured? There exists a wealth of research aimed at answering these questions.
Cells impart regenerative properties to a cartilage construct; extracellular matrix that is secreted is not only important for the development of the original construct, but for long term maintenance after implantation. There are a number of cell sources:
autologous (from patient's own cells), allogeneic (from another human's cells), or xenogeneic (from another species' cells). Ideally, autologous cells would be used to
prevent immunological rejection. However, due to high donor site morbidity, generally only a small amount of chondrocytes can be harvested. Expansion of the cells in vitro is therefore an important but difficult step; chondrocytes have a tendency to dedifferentiate
upon repeated passaging. [9]
The scaffold both provides short term mechanical stability and serves as a template for the organization of the developing construct. Important criteria for a cell
scaffold include: an environment conducive to cell adhesion and growth; non-toxicity in vivo of the scaffold or its degradation products; at least 90% porosity, providing
maximum surface area for cell-scaffold interactions, maximum space for ECM
regeneration, and minimal diffusion constraints during culture; the tendency to degrade and resorb after sufficient tissue regeneration; and an adjustable degradation rate to match tissue regeneration. Most importantly, in cartilage tissue engineering, the scaffold provides a 3D environment which helps maintain the chondrocytes' phenotype.
Considerable research has been done to characterize the ability of agarose, alginate, collagen I and II, polylactic acid (PLA), polyglycolic acid (PGA), and fibrin scaffolds to maintain chondrocyte phenotype and ECM biosynthesis. Several of these studies have focused on both mechanical and biochemical properties of different cell-seeded scaffolds.
One of the earliest examples of cell seeded scaffolds used polyglycolic acid (PGA) mesh with chondrocytes. [10] PGA scaffolds have since been seeded with both bovine and human articular chondrocytes, and successfully grown into cartilaginous implants in vivo and in vitro [11]. Unfortunately, PGA scaffolds are capable of only a small range of mechanical properties, and degrade quickly upon exposure to aqueous media. A potential solution is coating fibrous PGA meshes with polylactic acid (PLA), adding considerable mechanical stability. However, this also results in decreased cell adhesion and lower rates of proliferation after cell seeding [12]. There is also literature indicating that PGA and PLA degradation results in considerable release of acidic by-products, resulting in inflammatory reactions [13-16]. These results seems to suggest that cartilage constructs may require other stiffer scaffolds.
The behavior of chondrocytes seeded in agarose gels has been studied extensively. Young bovine chondrocytes retain their phenotype very well in agarose, and can create enough ECM in about a month to steadily increase equilibrium modulus and dynamic stiffness over five times to about 25% of that seen in native cartilage.
decrease in stiffness and biosynthesis. [18,19] However, not much work has been done in vivo; agarose has mainly been used as a model in which chondrocytes phenotype is maintained for in vitro studies.
Alginate has also been used as a model for maintaining chondrocytes phenotype in vitro [20]. There has been extensive study of alginate as a scaffold for cartilage implants. Injection molded cell-seeded alginate constructs have been grown in-vivo for as long as 30 weeks; proteoglycan synthesis increased to about 60% and equilibrium modulus increased to about 15% of native cartilage values [21]. Alginate gels and sponges have also been successfully modified with high density of adhesive ligand (arganine-lycine-aspartic acid, RGD) and sodium hyaluronate to yield cell seeded constructs with highly cellular cartilaginous matrix [22, 23]. However, alginate has poor
biocompatibility, and a lack of biodegradability, both of which can cause potential
problems. To circumvent this issue, several recent studies have looked at using alginate as a temporary scaffold in which to foster chondrocyte proliferation and ECM synthesis. After a period of in vitro culture, the alginate is dissolved, and the cells along with their
cell associated matrix are either seeded on a second scaffold (fibrin, PGA/PLA) or cultured on a tissue culture insert [24, 25, 26].
Because collagen is an integral part of normal articular cartilage, there has been much work using various collagen I and 11 gels or sponges as cell scaffolds.
Chondrocytes have been shown to retain their phenotype and secrete ECM when cultured in collagen I gels [27, 28], and have also been used to repair cartilage defects in small animals [29, 30, 31]. However, collagen I is usually only found in diseased or
predominant component of healthy articular cartilage. In vitro studies comparing collagen I and collagen II scaffolds concluded that cells in type 11 scaffolds secreted more ECM and had higher proliferation rates [32]. Collagen 11 constructs have been shown to greatly aid articular cartilage defect healing in canines; however, 15 weeks after implantation, the compressive stiffness of the repair tissue was 20-fold lower than that of native cartilage [31].
Self-assembling peptide gel scaffolds are another new approach to scaffolds for cartilage tissue engineering. KLD-12 peptide hydrogels have recently been explored as a potential scaffold. Upon casting, the compressive stiffness was 100-1000 times lower than native cartilage. These hydrogels, when cultured for a month, increased in
equilibrium modulus and dynamic stiffness to 10%-33% that seen in native tissue and exhibited biosynthesis rates similar to those in agarose [33].
Implantation of the scaffolds previously discussed involves shaping the construct and somehow fastening them into the cartilage defect. The constructs can be delicate,
making implantation difficult. Injectable constructs eliminate these complications. For instance, chondrocytes can be suspended in fibrinogen, and then injected into a defect while polymerizing with thrombin, such that the construct solidifies into the shape of the defect.[34]. A potential problem with this method is that it requires a sufficient number of chondrocytes, necessitating either large amounts of donor tissue, or in vitro
supplemented media, which may somehow be involved this dedifferentiation. Serum provides growth factors, hormones, transferin, selenium, and other factors conducive to cell growth and proliferation. However, there are severe limitations with animal sera. Because it is so complex, there is considerable lot-to-lot variation. Serum can cause immunological rejection after implantation, and in some cases can be toxic to cells.
Ideally, one could use autogenous tissue that is grown in the patient's own sera to avoid some of these issues, but this is a potentially complicated solution. Therefore, culturing chondrocytes in serum-free media is preferable. Several studies have shown that
chondrocytes cultured in various supplemented serum-free media can proliferate at rates at least as high as in media containing serum while retaining their phenotype [35, 36, 37]. The optimal combination and concentration of growth factors remains to be found.
Depending on the cell source and scaffold, the culture conditions (media type, compression duties) and culture lengths required to attain certain mechanical/
biochemical conditions will vary. Finally, at what point mechanically or biochemically is the construct ready to be implanted? How long till implant will heal? Under what loading conditions should the implant be subject to for maximum healing? Clearly, these are questions which must be looked into before the products of cartilage engineering are successfully used in humans.
A New Method
A novel serum free culture system has been developed in an attempt to generate 3D hyaline like neocartilage independent of polymer scaffolds [38]. This neocartilage is
neocartilage that has biochemical and morphologic properties reflective of juvenile cartilage-like tissue [38].
As discussed previously, it is advantageous that the implants have sufficiently robust mechanical properties to enable manipulation at the time of implantation, and to allow development of mechanical and biochemical properties relevant to hyaline-like cartilage for use in repair of articular cartilage defects. Factors which may affect biological, biochemical, and mechanical properties include the source and age of cells used in the construct, and the duration of neocartilage culture prior to implantation.
Objectives and Hypotheses
Our first objective was to characterize the biomechanical properties of neocartilage constructs from human/ovine donors of different ages, cultured over a range of times, and to compare these biomechanical properties to biochemical composition. Our hypothesis was that cells from young human or animal donors cultured for sufficient time periods would lead to mechanically stiffer constructs than those cultured from older sources.
Our second objective was to characterize the biomechanical properties of fetal lamb neocartilage constructs implanted into sheep. Two studies were performed at
Chapter 2 - METHODS
Neocartilage Biomechanics
Materials
Three types of neocartilages were grown [38]: those seeded with 2nd or 3rd tri-mester fetal lamb chondrocytes (FLC) (4x10⁶ cells/well), 1 week lamb chondrocytes (LC) (4x10⁶ cells/well),
and human chondrocytes (HC) (6x10⁶ cells/well). (Table 1)
Hyaline cartilage was dissected from the proximal tibia and distal femur bones of donors. Chondrocytes were isolated as previously described [38], and plated in 1 mL of Dulbecco's Modified Eagle's Medium with 10% fetal bovine serum. Cultures were then maintained with HL-1 CompleteT M serum free medium to stimulate extracellular matrix synthesis.
sample day N m n LC15 117 3 12 6 LC 14 158 4 13 8 LC8 208 1 3 0 FLC E1-2 82 2 12 4 FLC B1-3 89 1 3 2 FLC E 120 3 19 5 FLC B1-3 131 1 4 2 FLC D1-2 131 2 12 4 FLC A2-3 133 2 8 4 FLCA1 133 2 7 4 FLC D 207 3 18 6 FLC B1-3 311 2 10 4 HC3week 61 3 18 6 HC 3 week 96 3 19 6 HC3week 120 3 18 6 HC (1) 3 month 95 3 20 6 HC (1) 3 month 121 3 18 6 HC (2) 3 month 146 2 10 4 HC (1) 3 month 156 3 18 6 Table 1: Neocartilage Samples. N= number of disks
m = number of compression cores n = number of tension strips
FLC and LC disks were cultured from different animals for various durations; 3 week infant HC constructs from the same donor, 3 month infant HC constructs from 2
donors (Table 1), and HC disks from a series of 37 week gestation to 8 year donors. Construct disk thickness ranged from 150-600 um.
The approximately 1" diameter constructs were sent overnight from ISTO
facilities in St. Louis, MO to MIT labs in Cambridge, MA. The material was immersed in 25 mL tubes filled with HL-1TM Complete serum free media, which in turn was kept cold with ice packs. Contents of HL-1TM Complete include: a modified Dulbecco's Modified Eagle's Medium/F12 base, Hepes buffer, known amounts of insulin, transferring, testosterone, sodium selenite, ethanolamine, various saturated and unsaturated fatty acids, proprietary stabilizing proteins, and
P-glycerol
phosphate; but do not include bovine serum albumin or other undefined protein mixtures [38].All constructs were tested between 1 and 3 days of being removed from culture at ISTO facilities. Upon arrival, constructs were either immediately prepared for
mechanical testing, or replaced in culture for no longer than 2 days until testing could be done. These constructs were cultured at 370 C, 5% CO2, in serum free media, also provided by ISTO, which was supplemented with vitamin C (50ug/mL).
Preparation of Disks and Strips for Compression and Tension Tests
strip for tensile tests 3mm core for
were removed from each 1" diameter construct with a 3mm dermal punch and straight razor, as pictured in Fig 1. Each core or strip thickness was assessed with a current sensing micrometer.
Mechanical Testing in Confined Compression and Tension Testing
Each 3mm core was statically compressed in two 5% strain steps and two 2.5% strain steps consecutively using a Dynastat Mechanical Spectrometer via methods previously described [39]. The linear component of the equilibrium stress-strain curve was used to determine the equilibrium confined compression aggregate modulus
(HA)-At the final 15% static offset strain, the samples were dynamically compressed at 1 % sinusoidal strain amplitude at frequencies in the 0.01 to 1 Hz range to determine the dynamic confined compressive stiffness.
Each strip was tested under tension, again by using a Dynastat Mechanical Spectrometer. One end of the specimen was clamped to a load cell; the other end was clamped to the displacement control. Two steps in strain of 5% were applied
consecutively, followed by 2.5% strain increments up to 22.5% strain. The Young's modulus in tension (Et) was determined for each specimen from the linear component of the equilibrium tensile stress-strain curve,
All tests were performed with the specimen immersed in PBS at room temperature, with EDTA and 1 ug/mL pepstatin added to inhibit degradation of the construct. The constructs were then frozen at -80* C and sent overnight back to ISTO
Sheep Cartilage and Graft Biomechanics
Materials
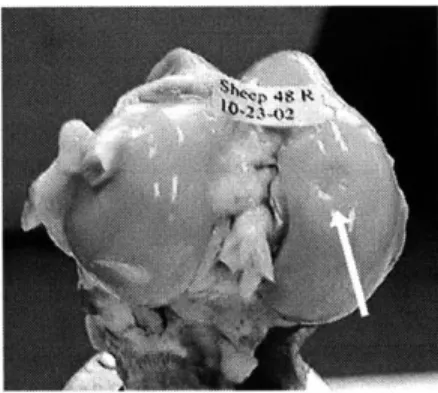
17 sheep were used in two studies. In all cases, an articular cartilage defect was created in a medial condyle of each sheep, into which
neocartilage was implanted. Fig. 2A shows a condyle with an implant site, Fig. 2B shows a control condyle with no implant.
Figure 2A. Condyle with graft site
In the first study, the neocartilage was affixed to the defect using nylon absorbable suture and tissue transglutaminase (tTG) as a biological glue to aid in implant fixation [41] for 5 sheep. Only sutures were used for another 5 sheep. All animals Figure 2B. Control Condyle
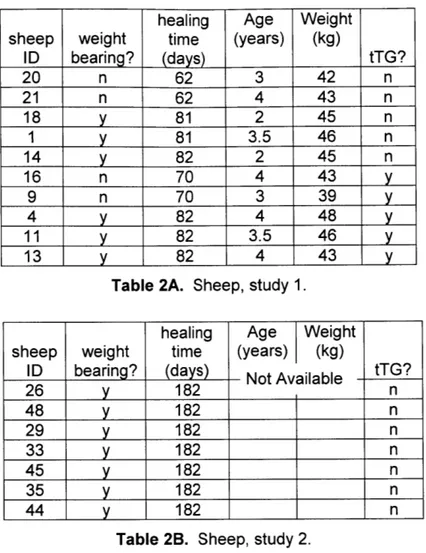
were allowed to heal for approximately eight weeks in non-weight bearing condition; the operated leg was kept in a sling. Two animals from each group were then sacrificed for analysis, while three animals from each group were allowed to walk on the leg for approximately three weeks (weight bearing condition) before sacrifice (Table 2A).
healing Age Weight
sheep weight time (years) (kg)
ID bearing? (days) tTG? 20 n 62 3 42 n 21 n 62 4 43 n 18 y 81 2 45 n 1 y 81 3.5 46 n 14 y 82 2 45 n 16 n 70 4 43 y 9 n 70 3 39 y 4 y 82 4 48 y 11 y 82 3.5 46 y 13 y 82 4 43 y
Table 2A. Sheep, study 1.
healing Age Weight
sheep weight time (years) (kg)
ID bearing? (days) Not Available tTG?
26 y 182 n 48 y 182 n 29 y 182 n 33 y 182 n 45 y 182 n 35 y 182 n
44
y
182 nTable 2B. Sheep, study 2.
Upon sacrifice at the veterinary lab in Wisconsin, the femur from both the operated knee and the non-operated control knee were removed and sent overnight to MIT labs in Cambridge, MA. The knees were wrapped in gauze soaked in media, and kept cold with ice packs.
All cartilage samples were tested between 1 and 3 days after sacrifice. Upon arrival, constructs were either immediately prepared for mechanical testing, placed in PBS with EDTA and 1 ug/mL pepstatin (to inhibit degradation of the construct) for no longer than two days at 40C until testing.
Preparation of Cartilage for Compression and Shear tests
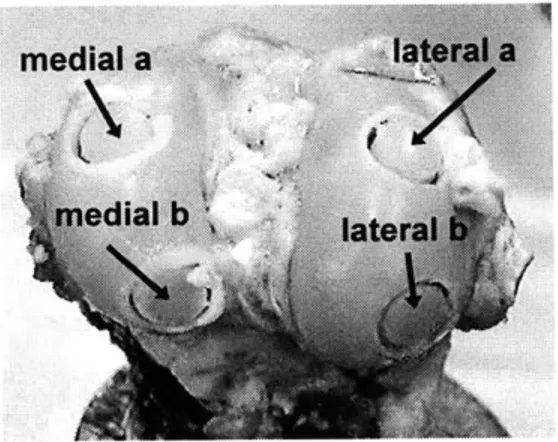
A drill press and hack saw were used
to remove 0.25" diameter cores from each medial a condyle. Four cores were taken from both the
operated and control knees: two from the edial b medial condyle, and two from the lateral
condyle. Therefore, eight cores were taken from each sheep: left medial a (LMa), left
Figure 3. Sheep knee with cores medial b (LMb), left lateral a (LLa), left lateral
b (LLb), right medial a (RMa), right medial b (RMb), right lateral a (RLa), and right lateral b (RLb).
The top layer of articular cartilage was removed from each core with a sledge microtome. These slices (-480 um thick) were placed in a bath of phosphate buffer solution (PBS) with EDTA and 1 ug/mL pepstatin to prevent degradation of the construct. After shear testing, a 3mm dermal punch was used to create samples for compression testing.
After dynamic shear testing, a 3mm core was removed from each slice. After determining the thickness with a current sensing micrometer, each 3mm core was statically compressed in two 5% strain steps and two 2.5% strain steps consecutively using a Dynastat Mechanical Spectrometer via methods previously described [40]. The linear component of the equilibrium stress-strain curve was used to determine the equilibrium confined compression aggregate modulus (HA). At the final 15% static offset strain, the samples were dynamically compressed at 1 % sinusoidal strain amplitude at frequencies in the 0.01 to 1 Hz range to determine the dynamic confined compressive stiffness.
All tests were performed with the specimen immersed in PBS at room
temperature with EDTA and 1 ug/mL pepstatin to inhibit degradation of the construct. The samples were then frozen at -800 C and sent overnight back to ISTO facilities in St.
Louis MO, for biochemical composition analysis.
Biochemistry
Colorimetric (DMMB binding) measurement of glycosaminoglycan (GAG) and hydroxyproline (hyPro) content were determined as previously described [38], after digestion of samples in papain buffer. Finally, these data sets were normalized to DNA content (Hoechst dye) [38].
Statistical Analyses
All statistical analysis was performed with SYSTAT v9.0 software. Multifactorial analyses of variance (ANOVA) were performed to examine the effects of independent variables of interest; Tukey / Bonferroni post-hoc and Student T-tests were used to compare data sets.
Chapter 3 - RESULTS
Neocartilage Constructs
Construct disk thickness ranged from 150-600 um, and was measured for each specimen (see Appendix A for details). FLC constructs were generally thicker than LC constructs. Neocartilage seeded with adult HC resulted in a cell monolayer that lacked sufficient matrix to be mechanically tested (data not shown).
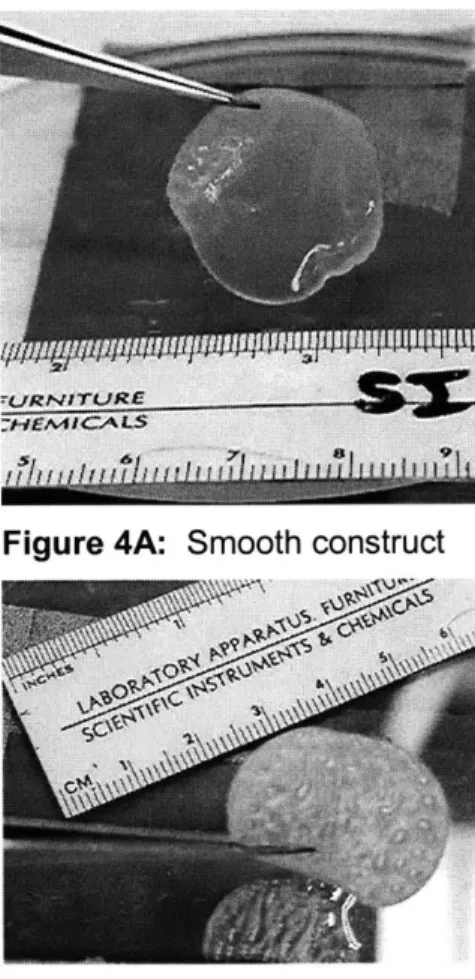
Figure 4A: Smooth construct
The majority of the constructs received had largely smooth surfaces, as shown in Fig. 4A. However, constructs cultured from the 3 week human infant donor exhibited increasing amounts of "bubbling" or corrugation over time. As can be seen in Fig. 4B, at 120 days of culture, the
corrugation had spread through the entire construct. Each individual bubble contained liquid media, such that 3 mm punches were flat, but bilayered.
Compressive Equilibrium Modulus (HA)
In constructs cultured for 117-158 days, FLC neocartilage had higher HA than LC neocartilage (Fig. 5A: p<0.001). The HA of FLC neocartilage was significantly higher at 311 days than all other FLC neocartilage tested (Fig. 5B: ANOVA, Tukey post hoc, p<0.001). The HA of 3 month HC construct did not change significantly over time, although construct HA at day 156 was significantly higher than at day 95 (Fig. 5C: ANOVA, Tukey post hoc, p<0.05). The HA of 3 week HC construct decreased
significantly over time, and was much higher at day 61 than at days 96 and 120 (Fig. 5C: ANOVA, Tukey post hoc p<0.001).
The dynamic compressive stiffness of all constructs tested increased with increasing compression frequency, and the values at 1 Hz were about one order of magnitude higher than HA (data not shown). These trends are consistent with known
relative values of static and dynamic compressive mechanical properties of native cartilage explants [39].
HA
I
FLC LC 3 week HC 3I
month HCFigure 5A: Equilibrium modulus of constructs cultured for 117-158 days.
*** = p<0.001
Fetal Lamb Construct HA
p<0.001 ANOVA 100 200 days in culture 300 400 Figure 5B: modulus of over time. Equilibrium FLC neocartilage *** = p<0.001 Human Construct HA m 3 week A 3 month T *
i
Figure 5C: Equilibrium modulus of HCneocartilage over time= p<0.001 * = p<0.05 0 50 100 150 200 days in culture 25 -20 15r -0M. CL 10 -5 0 cc 0. ..1 45 40 35 30 25 20 15 10 5 0 0 0 40 35 30 25 cL 20 15 10 5 0
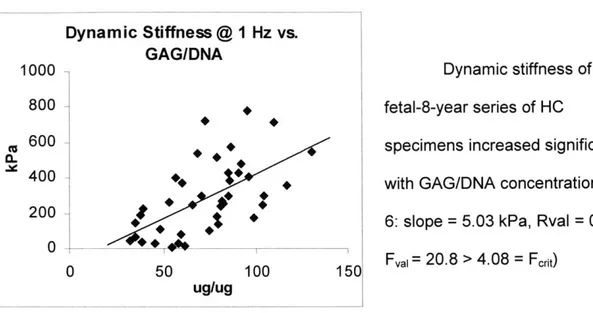
Dynamic Compressive Stiffness Dynamic Stiffness @ 1 Hz vs. GAG/DNA 0 I -50 100 150
Dynamic stiffness of the fetal-8-year series of HC
specimens increased significantly with GAG/DNA concentration (Fig.
6: slope = 5.03 kPa, Rval = 0.592,
Fval= 20.8 > 4.08 = Frit)
L -
Ugug
Figure 6: Dynamic stiffness of HC vs. GAG/DNA
Tensile Equilibrium Modulus
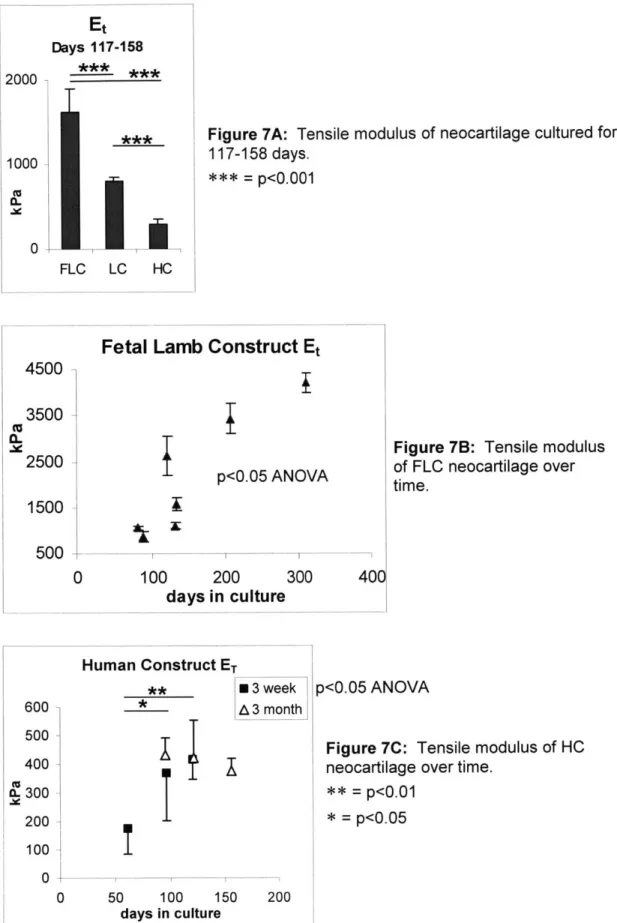
The Et of FLC neocartilage was greater than that of LC neocartilage (Fig. 7A:
p<0.001). Et of HC neocartilage (3 month and 3 week pooled) was significantly lower
than both FLC and LC neocartilage (Fig. 7A: p<0.001). The Et of FLC neocartilage increased significantly with time in culture (Fig. 7B: ANOVA, p<0.05). The Et of 3 week
HC neocartilage increased significantly with time in culture (Fig. 7C: ANOVA, p<0.05).
The Et of 3 month HC constructs did not change significantly with time in culture (Fig 7C).
1000 800 c 600 400 200 0
Et Days 117-158 2000 1000 (L 0~ 0 L FLC LC HO
Figure 7A: Tensile modulus of neocartilage cultured for 117-158 days.
*** = p<0.001
Fetal Lamb Construct Et
p<0.05 ANOVA
100 200
days in culture
300 400
Figure 7B: Tensile modulus of FLC neocartilage over time.
p<0.05 ANOVA
Figure 7C: Tensile modulus of HC neocartilage over time.
** = p<0.01 * = p<0.05 4500 -(U 0M3500 -2500 -1500 - 500-0 Human Construct ET ** 3 week * A 3 month 600 500 400 IL 300 200 100 0 0 50 100 150 200
GAG and Collagen Content: Donor Species and Age
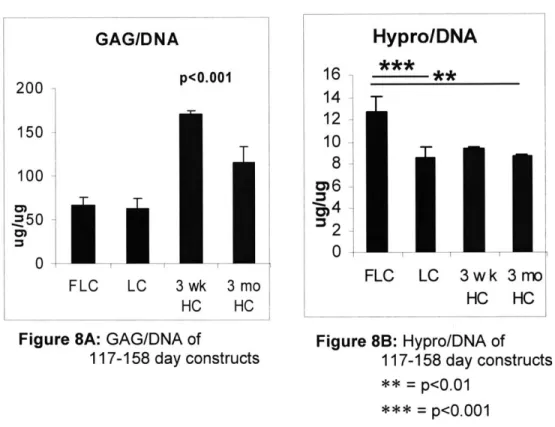
In constructs cultured for 117-158 days, FLC constructs had significantly higher Hypro/DNA concentration than 3 month HC and LC (Fig. 8B, p<0.01, p<0.001). Both 3 week and 3 month HC constructs had significantly higher GAG/DNA content than both LC and HC (Fig. 8A: p<0.001).
GAG/DNA 200 p<0.001 150 100 2~50 0 FLC LC 3wk 3mo HC HC
Figure 8A: GAG/DNA of
117-158 day constructs 16 14 12 10 8 0
Hypro/DNA
** FLC LC 3wk HC 3 mo HC Figure 8B: Hypro/DNA of 117-158 day constructs ** = p<0.01 = p<0.001Ovine GAG and Collagen Content: Timecourse
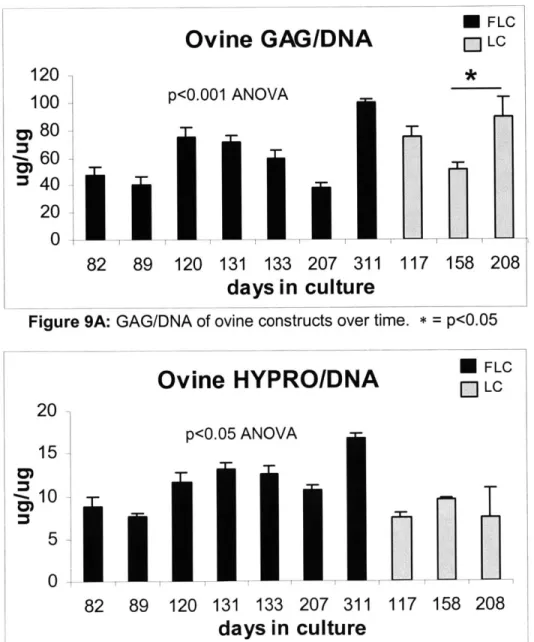
GAG/DNA in FLC and LC constructs tended to increase with time in culture (Fig. 9A: ANOVA, p<0.001). GAG/DNA for FLC constructs peaked significantly at 311 days (Fig. 9A: p<0.01). GAG/DNA in day 208 LC neocartilage was significantly higher than in day 158 LC samples (Fig. 9A: p<0.05). Hypro/DNA for FLC constructs increased with time (Fig. 9B: ANOVA, p<0.01) and peaked significantly at 311 days (Fig. 9B: p<0.05). Hypro/DNA for LC constructs did not significantly change with time (Fig 9B).
I FLC
Ovine
GAG/DNA
- LC 120 * 100 p<0.001 ANOVA 0 80 -60 S40 2011 0 82 89 120 131 133 207 311 117 158 208days in culture
Figure 9A: GAG/DNA of ovine constructs over time. * = p<0.05 * FLC
Ovine HYPRO/DNA
[ LC 20 p<0.05 ANOVA 15 10 5 0 82 133 89 120 131 133 207 311 117 158 208Human GAG and Collagen Content: Timecourse
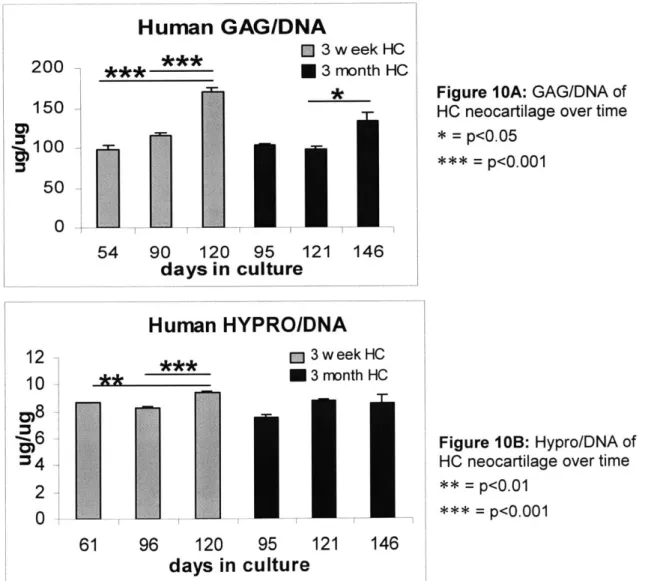
GAG/DNA in 3 week HC neocartilage increased significantly with time in culture (Fig.10A: p<0.001). GAG/DNA in 3 month HC construct also increased with time (Fig. 1OA: p<0.05), especially from day 121 to day 146 (Fig. 1OA: p< 0.05) but was
consistently less than 3 week HC constructs of the similar culture duration (Fig. 1OA: p<0.01). Hypro/DNA in 3 week HC neocartilage increased significantly with time in culture (Fig. 1OB: p<0.001), especially from days 61 and 96 to 120 (Fig. 1OB: p<0.01, p<0.001). Hypro/DNA in 3 month HC constructs did not change significantly with time (Fig. 1OB).
Human GAG/DNA
E] 3 week HC ____***U3
month HC * 121 146 95culture
54 90 120 days inFigure IOA: GAG/DNA of HC neocartilage over time * p<0.05 = p<0.001
Human
HYPRO/DNA
M 3 w eek HC ** 3 month HC 200 150 6100 50 0 12 10Biomechanical/Biochemical Correlations
We attempted to correlate biomechanical data to biochemical data, by plotting HA
vs. GAG/DNA; dynamic stiffness vs. GAG/DNA; ET vs. Hypro/DNA; HA, dynamic stiffness, and ET vs. dry weight; HA, dynamic stiffness, and ET vs. DNA. Some trends were
apparent; for instance, increasing HA and dynamic stiffness at 1 HZ seems to correlate with increasing GAG/DNA for FLC and 3 month HC neocartilage. However, there were not enough data points to make a truly meaningful regression. (see Appendix D)
Ovine Implants
Study 1
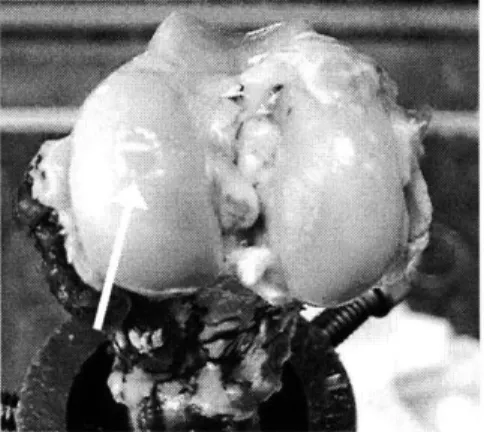
Both tissue transglutaminase (tTG) treated and untreated graft sites were visually different from the surrounding cartilage; the area was slightly depressed, with rough texture and soft consistency (Fig. 11). Great care was needed when removing the top layer of cartilage from the graft site.
Figure 11: Condyle with graft. Also note the rough surface on the lateral condyle, which occasionally appeared on
Stiffness of Ovine Tissue From Different Sites: Both Studies
The equilibrium modulus, dynamic stiffness, and shear stiffness of cartilage taken from areas near the graft site and from the contralateral control sites did not vary
significantly from each other in study 1 (ANOVA, Fig. 12A - Fig. 12C). The stiffness of cartilage sites from each sheep was pooled, and compared to the graft site. The graft site equilibrium modulus and dynamic stiffness were not significantly different from the the rest of the cartilage; however, the average shear stiffness of the graft sites was significantly lower than the surrounding cartilage (Fig. 12B: p<0.05).
In study 2, equilibrium modulus, shear stiffness, dynamic stiffness of surrounding cartilage also didn't vary from site to site (ANOVA, Fig. 12A - Fig. 12C). The stiffness of cartilage from each sheep was pooled, and compared to the graft site. On average, the graft site of study 2 animals was significantly softer in equilibrium modulus and dynamic stiffness (Fig. 12A, Fig 12C: p<0.001). Interestingly, the average shear stiffness for the graft sites in study 2 tends to be higher than other sites (Fig. 12B: p<0.01).
In general, cartilage from animals in study 2 had higher equilibrium modulus and dynamic stiffness than animals in study 1 (Fig. 12A, Fig. 12B: p<0.01) This trend
appeared to be reversed in shear stiffness: at 1 Hz, study 1 cartilage was stiffer in shear, than study 2 cartilage (Fig. 12B: p<0.05). However, the graft sites were significantly
HA of Ovine Tissue
*study 1 I study 2
~,
\;:M ~
Figure 12A: Equilibrium modulus of ovine cartilage sites. (graft is usually LMA site, except for two sheep in which the graft was at RMA. RMA and LMA in graph are cartilage explants, not graft site)
*** = p<0.001; ** = p<0.01 Shear Stiffness at 1 Hz CU 0.35 0.3 _ 0.25 -0.2 0.15 0.1 -0.05 0 -U study 1 0 study 2
T
* ** *I
Figure 12B: Shear Stiffness of ovine cartilage sites. (graft is usually LMA site, except for two sheep in which the graft was at RMA. RMA
300 250 200 a. 150 100 50 0
T
.*.*.I
Dynamic Stiffness at 1 Hz 3 m study 1 2.5 - study 2 2 IL 1.5 0.5 0
Figure 12C: Dynamic Stiffness of ovine cartilage sites. (graft is usually LMA site, except for two sheep in which the graft was at RMA. RMA and LMA in graph are cartilage explants, not graft site)
*** = p<0.001; ** = p<0.01
Stiffness of Ovine Tissue Sites in Study I
For both tTG treated sheep and non tTG treated sheep, there were no significant differences in stiffness between any non-graft cartilage site. Therefore, cartilage
stiffnesses were pooled for each sheep. For the pooled cartilage, there was no significant differences between tTG treated sheep and non tTG treated sheep. Grafts treated with tTG were also not significantly different from non tTG treated grafts (Fig.
and tTG treatment, although these trends could not be confirmed statistically (Fig. 14A -Fig. 14F) HA of ovine tissue 160 140 -120 -100 0- 80-60 40 -20 0 * tgt+ *
tgt-I
A
T
I
T
Figure 13A: Equilibrium modulus of study 1 ovine tissue.
Shear Stiffness at 1 Hz 0.3 0.25 A. 2-
T
0.15 0.1 0.05 0I
4 AT
IIo
9I
MU a. IDynamic Stiffness at 1 Hz
I
T
I
*tgt+ 0ltgt-T
T
-I
T
I
U
tT
0.4 -02Figure 13C: Dynamic Stiffness of study 1 ovine tissue.
A A
weight bearing tTG+ non weight bearing tTG+ weight bearing
non weight bearing
tTG1.6 -1.4 1.2 -1 0.8 0.6
HA of graft site over time (normalized by control) A
A
A
HA of graft site overtime (normalized by all cartilage)
1.4 1.2 1 0.8 0.6 0.4 A A A A 1.4 -1.2 -1 0.8 0.6 (U
* weight bearing tTG+ * non weight bearing tTG+ A weight bearing A non weight bearing tTG-Dynamic Stiffness (1 Hz) of graft
vs. time (normalized by control) 2.5
27
70 days
80 90
Figure 14C: Dynamic stiffness at 1 Hz (normalized by control site) of graft site over time. Note increase of stiffness with weight bearing for tTG+ grafts.
I A
1
Dynamic Stiffness (1 Hz) of graft vs. time (normalized by all
cartilage) 1.2 1 0.8A 0.6 0.4 0.2 0 0 60 A 70 80 90 days
Figure 14D: Dynamic stiffness at 1 Hz (normalized by all cartilage) of graft site over time. Note increase of modulus with weight bearing for tTG+ grafts. * weight bearing tTG+
O non weight bearing tTG+ A weight bearing
A non weight bearing tTG-Shear Stiffness (1 Hz) of graft vs.
time (normalized by control) 1.4 1.2 - 1-0.8 -0.6 -0.4 _ 0.2 - 0-60 A A
A*
70 days 80 90Shear Stiffness (1 Hz) of graft vs. time (normalized by all cartilage) 1.2
1H
0.8 0.6 0.4 0.2 0 -60 70 days AA#
80 90Figure 14E: Shear stiffness at 1 Hz Figure 14F: Shear stiffness at 1 Hz
A 1.5 1-0.5 -0 60
Effect of Tissue Transglutaminase and Weight Bearing Condition
For non-weight bearing samples, graft site stiffness normalized by stiffness of contralateral control sites (ie. if graft site was left medial a site, contralateral control was right medial a site), as well as by the average of the stiffness of all other cartilage samples taken from that particular sheep seemed to decrease with use of tTG, although there were no statistical significances for any of these trends. (Fig. 15A - Fig. 15C) Dynamic stiffness normalized by control site was significantly higher for weight bearing samples treated with tTG (Fig. 156: p<0.05). However, all n's were around 2 or 3, making this analysis somewhat inconclusive.
non-weight-bearing - normalized HA of graft site U Normalized by control
2 - Normalized by all cartilage
1.5
1 T
0.5 f
ttg+ ttg- ttg+
ttg-Figure 15A: Normalized Equilibrium Modulus of graft site from non weight bearing sheep
non-weight-wearing - normalized Dynamic Stiffness (1 Hz) of graft site
3 U Normalized by control
non weight bearing - normalized Shear Stiffness (1 Hz) of graft site
U Normalized by control El Normalized by all cartilage 0.4
0.2 0
ttg-ttg+ ttg- ttg+
Figure 15C: Normalized Shear Stiffness at 1 Hz of graft site from non weight bearing sheep
1.5
[
1 0.5
0
weight bearing - normalized HA of graft site * Normalized by control
E] Normalized by all cartilage -r
T
ttg+
ttg-ttg+
ttg-Figure 16A: Normalized Equilibrium Modulus of graft site from weight bearing sheep
weight bearing - normalized Dynamic Stiffness (1 Hz) of graft site 1.5 -1 015 0 ttg+ * * Normalized by control
E Normalized by all cartilage
ttg- ttg+
ttg-Figure 16B: Normalized Dynamic Stiffness at 1 Hz of
graft site from weight bearing sheep. * = p < 0.05
1 0.8 0.6
ttg-weight bearing - normalized Shear Stiffness (1 Hz) graft site
E Normalized by control
1.5 - El Normalized by all cartilage
1-0.5
-0
--ttg+ ttg- ttg+
ttg-Figure 16C: Normalized Shear Stiffness at 1 Hz of graft site from weight bearing sheep
Stiffness of Ovine Tissue Over Time: Both Studies
Stiffness of graft sites from all samples not treated with transglutaminase from both studies 1 and 2 were normalized by stiffness of contralateral control sites (ie. if graft site was left medial a site, contralateral control was right medial a site), as well as by the average of the stiffness of all other cartilage samples taken from that particular sheep.
Both the HA normalized by control site and HA normalized by all cartilage and decreased with time (Fig. 17A: ANOVA p<0.001, p<0.01) Dynamic stiffness normalized by control site and by all cartilage also decreased with time (Fig. 17B: ANOVA p<0.01, p<0.05).
However, shear stiffness normalized by all cartilage increased with time (Fig. 17C: ANOVA p<0.05).
T
Normal
* *
*
ized HA of graft site
EM normalized by control site * normalized by all cartilage 2-1.5 -1 0.5 -0 81 62
Healing Time (days)
Figure 17A: Normalized Equilibrium Modulus of graft sites not treated with transglutaminase. Grafts that healed for 62 and 81 days are from study 1, while grafts that healed for 182 days are from study 2.
*** = p < 0.001, * = p < 0.05
182
p<0.001 ANOVA p<0.01 ANOVA
Normalized Dynamic Stiffness (1 Hz) of graft site
E normalized by control site
E normalized by all cartilage
81 182
Healing Time (days)
p<0.01 ANOVA p<0.05 ANOVA
Figure 17B: Normalized Dynamic Stiffness at 1 Hz of graft sites not treated with transglutaminase. Grafts that healed for 62 and 81 days are from study 1, while grafts that healed for 182 days are from study 2.
*** = p < 0.001, * = p < 0.05 ** 3 2.5 2 1.5 1 0.5 0
L
1
* 62Normalized Shear Stiffness (1 Hz) of graft site
o normalized by control site M normalized by all cartilage 3 2.5
t
T
I
81Healing Time (days)
p<0.05 ANOVA
182
Figure 17C: Normalized Shear Stiffness at 1 Hz of graft sites not treated with transglutaminase. Grafts that healed for 62 and 81 days are from study 1, while grafts that healed for 182 days are from study 2.
* = p < 0.05
HA of grafts and controls
300 -250 -200 -0. 150 100 -50 -0 E graft *control o all cartilage 62 81 182
t
2 1.5 1 0.5 0 62Dynamic Stiffness (1 HZ) of grafts and controls
0 graft
U control
D all cartilage p<0.05 ANOVA
62 81 182
days
Figure 18B: Dynamic Stiffness at 1 Hz of graft,
control site, and all cartilage. Day 62 and 81 samples are tTG- sheep from study 1, day 182 samples are from study 2
Shear stiffness (1 HZ) of grafts and controls
I
62
0II graft p<0.05 ANOVA M control p<0.001 ANOVA 0 all cartilage
81 182
days
Figure 18C: Shear Stiffness at 1 Hz of graft, control site, and all cartilage. Day 62 and 81 samples are tTG- sheep from study 1, day 182 samples are from study 2 3, 2.5 2-1.5 -(U a. 1 0.5 0 (U 0.25 0.2 0.15 -0.1 -0.05 0
F-IChapter 4 - Discussion
Neocartilage - Effect of Donor Age
FLC neocartilage was almost always stiffer than LC: HA and Et were significantly higher in FLC than LC (Fig. 5A, Fig. 7A). Hypro/DNA was correspondingly higher in FLC than in LC (Fig. 8B). GAG/DNA was significantly higher in 3 week infant HC
neocartilage than in 3 month infant HC neocartilage (Fig. 8A). As the weight of DNA can be used as a measure of cell count, this seems to suggest that the younger the donor, the stiffer the resulting construct. Because of the "bubbly" quality of the 3 week infant HC neocartilage, further studies are needed to characterize the biomechanical
properties of 3 week HC and confirm this trend.
Neocartilage - Effect of Culture Duration
Data from ovine and 3 month HC constructs suggests that longer culture times result in stiffer constructs. FLC constructs exhibited increasing biomechanical (HA, Et; Fig. 5B, Fig.7B) and biochemical (GAG/DNA, Hypro/DNA; Fig.9A, Fig. 9B) properties with time in culture. Et and Hypro/DNA also increased in 3-week HC neocartilage with time in culture (Fig. 7C, Fig. 1OB). Dynamic stiffness of the fetal-8-year series of HC
Ovine Cartilage and Grafts
Study I - Effect of Tissue Transglutaminase and Weight Bearing Condition
There was little difference in stiffness between graft site and surrounding cartilage for both tTG treated and non treated sheep joints in study 1; only RMA was significantly higher than the graft site in tTG treated joints (Fig.13B). However, scatter plots of stiffness vs. time indicate that tTG treated grafts tended to become more stiff in compression (HA and dynamic stiffness) over time / weight bearing period (Fig. 14A
-Fig. 14D). Grafts treated with tTG had higher dynamic stiffness than those not treated (Fig. 16B). Additionally, non tTG treated grafts tended to become stiffer in shear with time/weight bearing period (Fig 14E, Fig.14F). It is difficult to draw a definitive
conclusion from these results. If tTG treatment did in fact aid in fixing the graft to the defect, then perhaps the graft integrated to the cartilage better, and increased GAG synthesis, which in turn increased compressive stiffness. The fact that shear stiffness
increased in non tTG treated grafts is suggestive of a more developed collagen network; however, it is not clear how this may be related to the treatment (no tTG)
Healing Duration - Effect on Graft and Surrounding Cartilage
The equilibrium modulus and 1 Hz dynamic stiffness of the graft site, when normalized by either contralateral control stiffness or stiffness of all cartilage, both decreased significantly with time (Fig. 17A, Fig. 17B), while shear stiffness at 1 Hz
decrease slightly with time. In contrast, the surrounding cartilage HA and dynamic stiffness increased, the graft shear stiffness tended to increase slightly, and the surrounding cartilage shear modulus decreased (Fig. 18A - Fig. 18C). These slight trends became statistically significant when the graft stifnesses were normalized to the time dependent stiffness of all surrounding normal cartilage.
In fact, when looking at the two studies separately, it appears that non-grafted cartilage from study 2 (in which the sheep healed for 182 days) had a higher HA and dynamic stiffness than cartilage from study 1 (in which the sheep healed for 62-82 days) (Fig. 12A, Fig. 12C). In study 1, HA of cartilage ranged from 50 to 75 kPa and dynamic stiffness ranged from 0.6-0.7 MPa; in study 2, HA of cartilage ranged from 110-190 kPa and dynamic stiffness at 1 Hz ranged from 1.0 - 1.9 MPa. Cartilage from a control sheep of the same age had HA - 200 kPa, and dynamic stiffness at 1 Hz - 2.4 MPa. Perhaps the defect creation and resulting damage affected both joints and adjacent cartilage surfaces, not just the defect site. It is possible that biomechanical and/or biochemical stimuli may have caused a drop in GAG synthesis in the surrounding cartilage areas, which was reflected in a drop of HA and dynamic stiffness from normal levels in cartilage from study 1 animals. Over time, GAG synthesis may have recovered, which was reflected in the higher compressive stiffness in cartilage from study 2 animals.
content, it is possible that after the operation, the defect and resulting damage may have caused an increase in collagen synthesis and remodeling, resulting in an increase in shear stiffness over normal levels in cartilage from study 1 animals. Over time, collagen synthesis may have dropped back down to normal levels, resulting in closer to normal shear stiffness in cartilage from study 2 animals.
Graft HA and dynamic stiffness did not differ significantly between the two studies. However, graft shear stiffness at 1 Hz was significantly higher in study 2 than in study 1, even though the surrounding cartilage was stiffer in shear in study 1. In fact, in study 2, the normal cartilage sites were significantly softer in shear than the graft (Fig 12B). It should be noted that for two animals in study two, it was observed at sacrifice that the graft tissue may have fallen out; the tissue in the defect was visibly of poor quality. However, this tissue was included in the biomechanical study and analysis. It is possible that this tissue was more fibrous than the grafts, resulting in a higher average shear stiffness for the graft sites.
Conclusions and Next Steps
Neocartilage
This pilot study seems to confirm our hypothesis that younger donor chondrocytes and longer culture durations result in mechanically stiffer and
biochemically more viable constructs. Further research is needed to confirm these results for human donors, and to confirm correlations between compressive stiffness and
These results also raise the interesting question of whether the neocartilage technique used here cannot be utilized for autologous transplant, as patients are most often mature adults. Even if neocartilage can be grown with chondrocytes from mature donors, growth of neocartilage requires a large number of cells, which is not easily obtainable through a biopsy. Therefore, the use of serum free media to passage chondrocytes and maintain their phenotype is a subject of importance, which should be studied further.
In general, from the biomechanical perspective, this method of creating scaffold free neocartilage seems to be promising. The neocartilage grafts in sheep healed and increased in compressive stiffness to 10-20% of the stiffness of the native adult ovine cartilage.
Ovine Implants
Study 1 data indicates that the ovine neocartilage graft heals to the defect site, tentatively confirming our hypothesis that the graft better integrates with the cartilage with use of tissue transglutaminase as a biological glue. This mechanical data needs to be confirmed with a larger study using more sheep.
look at the effects of weight bearing, as study 2 did not include non weight bearing controls.
Our data strongly indicate that the knee operation, creation of defect and
insertion of graft, and eight weeks spent with the leg in a sling may significantly affect the mechanical properties of the cartilage surrounding the defect site, as well as of the cartilage in the contralateral knee. Further studies of graft over time should also look at the surrounding cartilage to confirm this observation.
At the time of writing this document, data on biochemistry of ovine cartilage and grafts from studies 1 and 2 were not available. This data is important for verifying that the cartilage and grafts are biochemically similar to healthy, normal ovine cartilage. We hope to obtain this data in the near future, and correlate it with the biomechanical data.
References
1) Bayliss, M.T., Urban, J.P.G., Johnstone, B., and Holme, S. (1986) J. Ortho. Res. 4, 10-17
2) Gray, M.L., Pizzanelli, A.M., Grodzinsky, A.J., and Lee, R.C. (1988), J. Ortho.
Res. 6, 777-792
3) Gray, M.L., Pizzanelli, A.M., Lee, R.C., Grodzinsky, A.J., and Swann, D.A. (1989)
Biochem. Biophys. Acta 991, 415-425
4) Jones, I.L., Klamfeldt, D.D.S., and Sandstrom, T. (1982) Clin. Ortho. 165, 283-289
5) Palmoski, M.J., and Brandt, K.D. (1984) Arthritis Rheum. 27, 675-681
6) Sah, R.L., Kin, Y-J., Doong, J.H., Grodzinsky, A.J., Plaas, A.H.K., and Sandy, J.D. (1989) J. Ortho. Res. 7, 619-636
7) Sah, R.L., Grodzinsky, A.J., Plaas, A.H.K., and Sandy, J.D., (1990) Biochem. J. 267, 803-808
8) Parkkinen, J.J., Lammi, M.J., Helminen, H.J., and Tammi, M. (1992) J. Ortho.
Res. 10, 610-620
9) Sah, R.L., Doong, J.Y.H., Grodzinsky, A.J., Plaas, A.H.K., and Sandy, J.D. (1991)
Arch. Biochem. Biophys. 286, 20-299.
10) Cima LG, Vacanti JP, Vacanti C, Ingber D, Mooney D, Langer R (1991) J
Biomech Eng 113:143-151
11) Freed LE, Vunjak-Novakovic G, Langer R. (1994) J Cell Biochem; 51:257-264 12) Moran JM, Pazzano D, Bonassar LJ. (2003) Tissue Engineering 9: 63-70 13) Bergsma EJ, Brujn W, Rozema FR, Bos RM,Boering G. (1995) Biomaterials
16(1):25-31
14) Bergsma EJ, Rozema FR, Bos RM, Brujn W. (1993) J Maxillofac Surg 51:666-70 15) Bostmann 0, Hirvensalo E, Makinen J, Rokkanen P. (1990) J Bone Jt Surg
B72:592.
16) Rehm KE, Claes L, Helling HJ, Humacher D. In: Leung KS, Hung LK, Leung PC, editors. Biodegradable implants in fracture fixation. Hong Kong: World Scientific, 1994. p. 54
17) Buschmann MD, Gluzband YA, Grodzinsky AJ, Kimura JH, Hunziker EB. (1992)
21) Chang SCN, Rowley JA, Tobias G, Genes NG, Roy AK, Mooney DJ, Vacanti CA, Bonassar LJ. (2001) J Biomed Mater Res 55(4):503-511
22) Alsberg E, Anderson KW, Albeiruti A, Rowley JA, Mooney DJ. (2002) PNAS 99,19:12025 - 12030
23) Miralles G, Baudoin R, Dumas D, Baptiste D, Hubert P, Stoltz JF, Dellacherie E, Mainard D, Netter P, Payan E. (2001) J Biomed Mater Res. 57(2):268-278 24) Perka C, Spitzer RS, Lindenhayn K, Sittinger M, Schultz 0. (2000) J Biomed
Mater Res. 49(3):305-11
25) Marijnissen WJCM, van Osch GJVM, Aigner JA, van der Veen SW, Hollander AP, Verwoerd-Verhoef HL, Verhaar JAN. (2002) Biomaterials. 23, 26:1511-1517 26) Masuda K, Sah RL, Hejna MJ, Thonar EJ. (2003) J Orthop Res Jan;
21(1):139-48
27) Schuman, L., Buma, P., Versleyen, D., de Man, B., van der Kraan, P. M., van den Berg, W. B., & Homminga, G. N. (1995). Biomaterials 16, 809-814 .
28) Nehrer S, Breinan HA, Ramappa A, Shortkroff S, Young G, Minas T, Sledge CB, Yannas IV, Spector M. (1997) J Biomed Mater Res 38:95-104
29) Kamura S, Wakitani S, Kimura T, Maeda A, Caplan Al, ShinoK, Ochi T. (1998)
Acta Orthop Scand 69:56-62
30) Nehrer S, Breinan HA, Ramappa A, Hsu MP, Minas T, Shortkroff S, Sledge CB, Yannas IV, Spector M. (1998) Biomaterials 19:2313-28
31) Lee CR, Grodzinsky AJ, Hsu H-P, Spector M. (2003) J Orth Res. 21(2):272-281 32) Nehrer, S., Breinan, H. A., Ramappa, A., Shortkroff, S., Young, G., Minas, T.,
Sledge, C. B., Yannas, I. V., & Spector, M. (1997). J. Biomed. Mater. Res. 38, 95-104
33) Kisiday J, Jin M, Kurz B, Hung H, Semino C, Zhang, S, Grodzinsky AJ. Self (2002) Proc Nati Acad Sci U S A. Jul 23;99(15):9996-10001
34) Passaretti D, Silverman RP, Huang W, Kirchhoff CH, Ashiku S, Randolph MA, Yaremchuk MJ. (2001) Tissue Engineering. 7;6: 805-815
35) Buckner P, Hoerler I, Mendler M, et al. (1989) J Cell Biol; 109:2537-2545 36) Rosselot G, Reginato AM, Leach RM. (1992) /n Vitro Cell Dev Biol 28A:235-244 37) Dunham BP, Koch RJ. (1998) Arch Otolaryngol Head Neck Surg 124:1325-1330 38) Adkisson HD, Gillis MP, Davis EC, Maloney W, Hruska KA. (2001) Clin Orth Rel
Res 391 S: S280-S294
39) Frank EH, Grodzinsky AJ. (1987) J Biomech. 20(6):629-39
40) Frank EH, Jin M, Loening AM, Levenston ME, Grodzinsky AJ. (2000) J Biomech. 33(11):1523-7
41) Lu Y, Bogdanske J, Kalscheur V, Linden S, Adkisson D, Feder J, Hruska K, Markel MD. ICRS Poster, June 2002
Appendix A
-
Construct Biomechanics
Legend for Construct Biomechanics Data
Donor Abbreviations: LC = Lamb Chondrocyte FLC = Fetal Lamb Chondrocyte HC = Human Chondrocyte Core/Strip Abbreviations: c = core
s = strip
(see Figure 1 for core, strip definitions) Other Definitions
Eqmod = Equilibrium Compression Modulus (HA)
Dyn = dynamic compressive stiffness tension = tensile modulus (ET).
strip for tensile tests
3mm core for compressive tests
0
0
0
00
0
Figure 1. construct disk
N = number of disks
m = number of cores