Plasma Science and Fusion Center Massachusetts Institute of Technology
Cambridge MA 02139 USA
1Plasma Science and Fusion Center, MIT, Cambridge, MA 02139, USA 2CompX, Del Mar, CA 92014, USA
3Princeton Plasma Physics Lab, Princeton, NJ 08543, USA 4Assocation EURATOM-CEA, CEA, Cadarache, France
5Naka Fusion Research Establishment, JAERI, Ibaraki-ken, Japan 6Associazione EURATOM-ENEA, Frascati (Roma), Italy
7University of Wisconsin, Madison, WI 53706, USA 8Max Planck Institut für Plasmaphysik, Garching, Germany
This work was supported by the U.S. Department of Energy, Grant
DE-FC02-99ER54512. Reproduction, translation, publication, use and disposal, in whole or in part, by or for the United States government is permitted.
Submitted for publication to Nuclear Fusion.
PSFC/JA-06-33
Benchmarking of Lower Hybrid Current Drive Codes
with Applications to ITER-Relevant Regimes
P.T. Bonoli1, R.W. Harvey2, C. Kessel3, F. Imbeaux4, T. Oikawa5, M. Schneider4, E. Barbato6, J. Decker4, G. Giruzzi4, C.B.Forest7, S. Ide5, Y. Peysson4, A.E. Schmidt1, A.C.C. Sips8, A.P. Smirnov2,
J.C. Wright1
Benchmarking of Lower Hybrid Current Drive Codes with Application to
ITER-Relevant Regimes
P.T. Bonoli 1), R.W. Harvey 2), C. Kessel 3), F. Imbeaux 4), T. Oikawa 5), M. Schneider 4), E. Barbato 6), J. Decker 4), G. Giruzzi 4), C.B. Forest 7), S. Ide 5), Y. Peysson 4), A.E. Schmidt 1), A.C.C. Sips 8), A.P. Smirnov 2), and J.C. Wright 1)
1) Plasma Science and Fusion Center, MIT, Cambridge, MA 02139, USA. 2) CompX, Del Mar, CA 92014, USA.
3) Princeton Plasma Physics Laboratory, Princeton, NJ 08543, USA. 4) Association EURATOM-CEA, CEA, Cadarache, FRANCE.
5) Naka Fusion Research Establishment, JAERI, Ibaraki-ken, JAPAN. 6) Associazione EURATOM-ENEA, Frascati (Roma), ITALY.
7) University of Wisconsin, Madison, WI 53706, USA.
8) Max Planck Institut für Plasmaphysik, Garching, GERMANY. E-mail: Bonoli@psfc.mit.edu
Abstract. This paper discusses the results of a benchmark exercise in which the predictions of several
simulation models for lower hybrid current drive (LHCD) were compared using parameters typical of the steady state operating scenario in the ITER device (the so-called Scenario 4). The most complete LHCD simulation models that were used combined 2D velocity space Fokker Planck solvers with toroidal ray tracing packages. These models also predicted the highest LHCD efficiencies with 2.0 – 2.6 MA of driven current for 30 MW of coupled LHRF power. Codes that solved the Fokker Planck equation using a Green’s function approach and then computed the driven LH current using a wave induced RF flux based on 1D parallel velocity damping along ray trajectories were found to predict LH currents 35-40% lower than the 2D Fokker Planck models. This discrepancy is understood in terms of the approximate nature of the 1D wave induced flux that fails to properly capture 2D velocity space effects that occur in LHCD owing to the significant distortion of the electron
distribution function. We also used an orbit-following Monte Carlo code to study the possible parasitic damping of LH waves on fusion generated alpha particles. The effect of magnetic field ripple and fast ion anomalous transport on the alpha population was considered. It was found that for a large anomalous diffusion coefficient (1m2/s), the absorption on fusion alphas can be as high as 7.7% using a LHRF source frequency of 3.7 GHz. This result gives some confidence in the source frequency choice of 5.0 GHz in order to minimize the possibility of this parasitic interaction.
1. Introduction
Lower hybrid (LH) waves have the attractive property of damping strongly via electron Landau resonance on relatively fast tail electrons at (2.5 – 3)×vte, where vte = (2Te/me)1/2 is the electron thermal speed. Consequently these waves are well-suited to driving current in the plasma periphery where the electron temperature is lower, making lower hybrid current drive (LHCD) a promising technique for off – axis (r/a ≥ 0.60) current profile control in reactor grade plasmas. A central objective of LHCD on ITER is to supplement the bootstrap current in order to access attractive steady-state operating regimes, namely those with moderate or reversed shear, high bootstrap fraction (≥ 70%), high βn (~ 3) and good
confinement (HITER-89 ~ 2.5) [1]. Indeed, off-axis lower hybrid current drive has already been shown to be an effective tool for optimizing the current profile for access to advanced
tokamak operating modes in the JET [2] and JT-60U [3] tokamaks. In addition, the RF source frequency can be chosen high enough to minimize the parasitic interaction of LH waves with fusion-generated alpha particles. The relatively high phase speed also minimizes deleterious effects due to particle trapping which can become important in the periphery.
Given these physics considerations, we have undertaken a detailed benchmarking exercise in which we compared the predictions of several advanced simulation models for lower hybrid current drive using a test case based on a proposed steady state operating mode (Scenario #4) for the ITER device [4]. The plan of this paper is as follows. In Section 2 we review the physics models used in the different LHCD simulation models that comprise our
benchmarking exercise. In Section 3 we present parameters used for the benchmark exercise and comparisons of the driven current profiles and LHRF deposition profiles predicted by the different simulation models. We also discuss reasons for the different predictions among the various models. In Section 4 we examine the effects of parasitic absorption of the LH waves on fusion generated alpha particles using an orbit following Monte Carlo code. Finally in Section 5 we give conclusions and suggestions for future work.
2. Lower Hybrid Current Drive Physics Models
The most advanced models that we have used are the CQL3D-GENRAY [5, 6] and
DELPHINE [7] codes which combine a 3D (v⊥, v//, r) Fokker Planck calculation [see Eq.(1)] with a toroidal ray tracing package. The modules iterate to compute a self-consistent
nonthermal electron distribution function. These models have the advantage that they properly capture the complete 2D velocity space physics in the collision operator C(fe, p//, p⊥), including the (1) 1 ) ( + ) , , ( ) ( // // // // // // // r f r r r p p f eE p p f C p f p D p t f e F s e e e rf e
∂
∂
χ
∂
∂
δ
∂
∂
∂
∂
∂
∂
∂
∂
= + + Γ + ⊥effects of pitch angle scattering and momentum conserving corrections in the background collision operator. For the purposes of the present benchmark exercise, these codes find the steady state solution to Eq. (1) neglecting the DC electric field term (E//) and the fast electron diffusivity operator. Both CQL3D and DELPHINE include the effect of particle trapping which is important even for off-axis LHCD. Particle trapping in DELPHINE is computed using analytic bounce integrals based on circular concentric flux surfaces whereas CQL3D performs numerical bounce averaging in the actual noncircular tokamak geometry. Although the 2D and 3D solutions of Eq. (1) can be computationally expensive, the driven LH current is straightforward to compute from a simple velocity moment integral.
We have also included the LSC [8] and ACCOME [9] simulation models in the benchmark study. These codes employ a Green’s function treatment [10] of the Fokker Planck equation from which the driven current is formulated by convolving the resulting response function (χ) with the wave-induced RF flux (Γrf):
(2) 3 . p f D Γ , Γ p χ p d J || e QL rf rf rf ∂ ∂ ∂ ∂ • =− =
∫
This approach is computationally fast and the response function (χ) includes 2D velocity space effects, particle trapping, and momentum conserving corrections in the collision operator. However, the method relies on an estimate for the wave induced RF flux which is computed in both LSC and ACCOME from a 1D parallel velocity space solution of Eq. (1). The LSC model attempts to account for 2D velocity space effects in the dissipated power first reported in Ref. [11] by replacing the leading coefficient [(2+Zeff)/2] of the collision operator
in Eq. (1) with [(1+Zeff)/5] . A similar technique is also used in the FRTC code [12] where [(2+Zeff)/2] is replaced by [(5+Zeff)/10]. The ACCOME LHCD model used in the benchmark includes 2D velocity space effects in the collision operator by assuming the perpendicular dependence of the electron distribution function is Maxwellian with an effective
perpendicular electron temperature (T⊥) due to Fuchs [13]. Equation (1) is then integrated over perpendicular momentum retaining an arbitrary T⊥ in the collision operator integrals [14]. These methods employed in LSC, FRTC, and ACCOME for treating the 2D power dissipation are found to be inadequate, especially for ITER where the quasilinear plateau becomes narrow relative to present day experiments.
3. Results of LHCD Code Benchmark Study 3.1 Plasma equilibrium and LHRF Parameters
The plasma equilibrium used for the LHCD code benchmark is shown in FIG. 1. The equilibrium flux contours shown in Fig. 1(a) correspond to the steady state Scenario 4 [4] with R0 = 6.35m, a = 1.85m, B0 = 5.3 T, κsep = 1.97, δsep = 0.58, and βN = 2.57 (%-m-T/MA). The total plasma current in this case is 9 MA with weak reversed shear [q(0) = 3.44, q(min) = 2.58, and q(a) = 6.42]. The electron temperature and density profiles are shown in Fig. 1(b) with central values of 24 keV and 7.25 × 10¹⁹ m-3 respectively. Identical temperature profiles were used for the deuterons, tritons, and Be4 with central values of 25.2 keV in each case. The relative concentrations (ni / ne) of deuterium, tritium, and beryllium were respectively (0.416, 0.416, 0.042). A constant profile of Zeff was assumed with Zeff = 2.23. The 2D Fokker Planck solver (CQL3D) requires an up-down symmetric equilibrium. Thus the MHD equilibrium in Fig. 1(a) was first symmeterized and translated to the Z=0 plane and this representation was then used by all the codes.
R (m) Z(m) 0 5 10 15 20 25 0.0 0.2 0.4 0.6 0.8 1.0 Te ne
Normalized toroidal flux
T e [k eV ], n e [10 19 m -3 ]
FIG. 1(a): Magnetic flux surface geometry for the
The LHRF source frequency was taken to be 5.0 GHz and the coupled LH power was 30 MW. In CQL3D-GENRAY, DELPHINE, and ACCOME ray trajectories were launched from three vertical positions, Z = [-0.4m, +0.1m, +0.6m] to model the finite poloidal extent of the LH launcher. The LSC ray tracing code only allows rays to be launched from a single location, which was chosen to Z = +0.1m in this case. The coupled LH power spectrum was characterized in terms of the parallel refractive index (n// = k// c / ω) as:
(3) .) ( 2 , ) ( sin ) ( 0 // // min // max // 2 2 0 // n n n n x x x S n S ⎟⎟ − ⎠ ⎞ ⎜⎜ ⎝ ⎛ − = = π
The central parallel refractive index in the co-current drive (CD) direction was varied with n0// = (1.9, 2.0, 2.1), and in each case we took n//min = n0// - 0.10, and n//max = n0// + 0.10. The central n0// in the counter-CD direction was fixed at n0// = 3.8 during this scan. The
amplitudes S0 were chosen so that the power in the forward lobe divided by the total power was 0.87. This corresponds to a directionality that is higher than the proposed passive active multi-junction launcher for ITER [4].
3.2 Results of the LHCD Code Benchmark Study
The main results of the LHCD code benchmark study are summarized in Fig. 2. In that figure we have plotted the predicted LH current density in the left hand panels and the corresponding LH power density in the right hand panels for the CQL3D-GENRAY, DELPHINE, ACCOME, and LSC simulations, moving from the top to the bottom of the page. The integrated LH current has been included in the left hand panels. A general trend that is first apparent is that the predicted power dissipation for the forward lobe is peaked at a normalized rho (≈ r/a) of 0.6 in the CQL3D, DELPHINE, and ACCOME simulations. The forward lobe in the LSC simulation damps a bit farther out in radius at r/a ≅ 0.65. This could be caused by differences in the MHD equilibrium and / or plasma profiles used with LSC, as compared to those in Fig. 1. This would have occurred because the LSC results shown in Fig. 2 are part of a time dependent ITER simulation [15] where the plasma was being evolved using the tokamak simulation code TSC [16]. In all four simulations the reverse power lobe at high n// (= 3.8) can be seen to damp at a lower temperature at r/a > 0.9. An even more dramatic indication that the equilibrium – profile data was different in the LSC simulation is the high level of forward power that is damped off-axis at r/a = 0.9 for the n0// = 1.9 spectrum. Presumably the ray trajectories corresponding to n0// = 1.9 encountered a wave accessibility limit before damping most of their power via electron Landau resonance and propagated back to the plasma edge, underwent a radial reflection at that point and were absorbed close to the plasma edge. Some further indication that rays launched near n0
// = 1.9 are barely able to damp before becoming inaccessible can be seen in Fig. 3. There we have plotted rays from the CQL3D-GENRAY simulation in the range1.8 ≤ n0
// ≤ 2.0 (shown as green to blue) and in the range -3.9 ≤ n0
// ≤ -3.7 (shown as red to purple). A few of the dark blue rays below n0// = 1.9 are not absorbed and instead become inaccessible and propagate to the plasma edge. Although most of the forward power in the CQL3D-GENRAY simulation was damped at r/a ≈ 0.6, the ray behavior in Fig. 3 does suggest that the wave propagation and absorption is sensitive to details of the magnetic equilibrium and profiles, especially when the LH waves are propagating near the accessibility limit [in this case n//acc ≅ 1.6, assuming B0 ≈ 4.1T and
0.2 0.4 0.6 0.8 1.0 rho J LH (MA / m 2 ) 0 0.5 1.0 ILH = 1.44 MA ILHLH = 1.69 MA = 1.69 MA ILHLH = 1.99 MA = 1.99 MA
CQL3D
0.2 0.4 0.6 0.8 1.0 rho 0 0.1 0.2 0.3 0.4 S LH (MW/m 3) N//// = 2. = 2.0 N//// = 2. = 2.1CQL3D
N// // = 1.9= 1.9 0 0.2 0.4 0.6 0.8 1 0 0.2 0.4 0.6 0.8 1 1.2 1.4 n //=1.9, ILH=1.8 MA n //=2.0, ILH=2.5 MA n //=2.1, ILH=2.6 MADELPHINE
rho JLH (MA / m 2) 0 0.2 0.4 0.6 0.8 1 0 n // = 1.9 n // = 2.0 n // = 2.1 rhoDELPHINE
SLH (MW/m 3) 0.1 0.2 0.3 0 0.2 0.4 0.6 0.8 1 rho -0.1 0 0.1 0.2 0.3 0.4 0.5 0.6 IILHLH = 1.25 MA = 1.25 MA ILHLH = 1.21 MA = 1.21 MA ILHLH = 1.08 MA = 1.08 MA ILHLH = 0.95 MA = 0.95 MA j LH (MA / m 2 ) ACCOME 0 0.1 0.4 0.2 0.5 0.3 0 0.2 0.4 0.6 0.8 1 rho n n//// = 1.9 = 1.9 n//// = 2.0 = 2.0 n//// = 2.1 = 2.1 n//// = 2.2 = 2.2 S LH (MW/m 3 )ACCOME
0 0.103 0.207 0.310 0.2 0.6 1.0j
LH(MA/m2)
ILH = 0.87 MA = 0.98 = 1.10 = 1.05 rhoLSC
0.225 0.15 0.075 0 0.2 0.6 1.0P
LH(MW/m3)
n || = 1.9 = 2.0 = 2.1 = 2.2 rhoLSC
ne ≈ 4 × 10¹⁹ m-3 near r/a = 0.95]. The DELPHINE simulation in Fig. 2 also shows some fraction of forward power being damped near the edge for n0// = 1.9, although not as much as in the LSC simulation, consistent with the fact that DELPHINE used the equilibrium and profiles shown in Fig.1.
A second general trend seen in Fig.2 is that the more complete 2D (velocity space) codes predict higher currents [(1.44 – 2.6) MA for CQL3D and DELPHINE] than the codes employing a response function – ray tracing approach [(0.87 – 1.24) MA for ACCOME and LSC]. This discrepancy is thought to be due to the fact that the 2D velocity space dissipation is not modeled properly by the 1D parallel velocity space wave damping used in Eqs. (2) with the response function approach. In order to demonstrate there can be significant distortion of the distribution function in 2D velocity space, even for a relatively narrow quasilinear plateau we have plotted fe(v⊥, v//) from the CQL3D simulation for n0// = 1.9, at a radial location near the maximum in the absorption profile (r/a = 0.65) (see Fig. 4). Despite the narrow plateau width there is still noticeable distortion of fe due to pitch angle scattering of electrons into the perpendicular direction. Moreover, the trapped-passing boundary in the co-CD direction (solid black line in Fig. 4) now lies quite close to all plateau electrons that are pitch-angle scattered into the perpendicular plane. In fact, we know that trapping is an important effect in these simulations. We have re-run the CQL3D case for n0// = 1.9 with trapping turned off and found that the LH current increased by 40% from 1.99 MA to 2.8 MA, with the profile of driven current remaining the same. Thus it is possible in these simulations that details of how trapped particles are treated in the
various models can be important. Some indication that this may be the case is the difference in driven LH current in the CQL3D and
DELPHINE model predictions. Recall from Fig. 2 that DELPHINE predicts up to 2.5 MA of LH current for n0
// = 2.0, compared to 1.69 MA for CQL3D. Some of this
difference could be due to the different treatments of particle trapping in the two models, where DELPHINE employs analytic bounce integrals in circular flux surface geometry whereas CQL3D performs a numerical bounce averaging in the noncircular
2 4 6 8 10 -3 -2 -1 0 1 2 3
R (m)
Z(m)
FIG. 3: LH ray trajectories from CQL3D-GENRAY simulation, plotted in the poloidal cross-section.
FIG. 4: Nonthermal electron distribution contours from the CQL3D simulation for n0// = 1.9, at r/a = 0.65.
tokamak geometry. In addition, CQL3D formulates a bounce averaged quasilinear operator, whereas DELPHINE takes a more simplified approach in which the RF operator is not bounce averaged [7].
4. Lower Hybrid Wave Absorption on Fusion Alpha-Particles
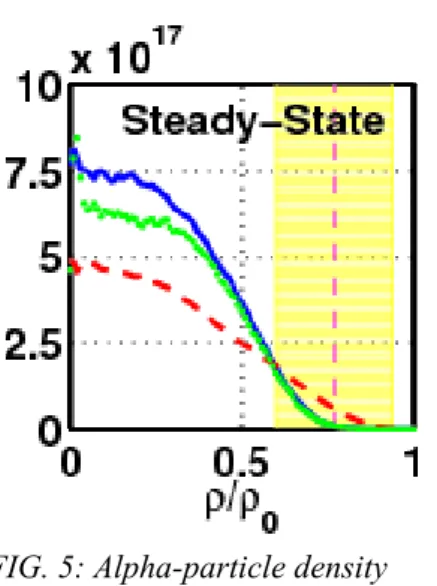
The question of parasitic absorption of LH waves on fusion generated alpha-particles is an important issue for ITER as it directly impacts the choice of source frequency. Although the choice of frequency is partly driven by the need to avoid parametric decay of the LH pump wave [17], the more critical need for ITER is to keep the LH wave phase speed high enough so as to minimize the interaction with energetic alpha particles. The spatial profile of fusion alpha particles is important to know when assessing this interaction. Recently [18] work has been done to assess the effects of toroidal field (TF) coil ripple and anomalous ion transport
on the spatial profile of fast alpha-particles in the steady state ITER Scenario 4. A simulation model that
combines the SPOT [19] orbit following Monte Carlo code with the DELPHINE Fokker Planck – ray tracing package [7] was modified [18] to include operators in the Monte Carlo package to account for spatial diffusion effects due to TF ripple and anomalous ion transport. The simulated fast alpha density profiles obtained with the modified Monte Carlo code are shown in Fig. 5. The reference alpha density profile without ripple or
anomalous transport effects is shown in blue in Fig.5. The spatial profile obtained by including a stochastic diffusion coefficient in the Monte Carlo operator to model the TF ripple is shown as the green curve in Fig. 5. Finally, the spatial profile resulting from an anomalous ion diffusion coefficient of 1 m2/s in the Monte Carlo operator is shown as the red curve. Clearly, the anomalous ion diffusion has the biggest effect on the spatial profile of alpha particles with the TF field ripple having little effect in the region where LH waves would be expected to damp, i.e. at r/a ≥ 0.6. The spatial profiles of alpha particle density in Fig. 5 were used in the DELPHINE code with a LH source frequency of 3.7 GHz. The percentage of power lost parasitically by the LH waves to the alpha-particles was then found to be 1.8%, 1.9%, and 7.7% for the reference alpha profile, the profile with magnetic ripple, and the profile with anomalous transport, respectively. Although the level of parasitic absorption was found to be non-negligible (7.7%) with the alpha profile resulting from anomalous diffusion, it should be pointed out that the diffusion coefficient magnitude used in this case probably represents an upper limit.
FIG. 5: Alpha-particle density (m-3) profiles for ITER Scenario 4 with magnetic field ripple effect (green), with anomalous transport (red), and reference case (blue).
5. Summary and Conclusions
In this paper four simulation models for LHCD were benchmarked against each other on a plasma equilibrium representative of the steady state ITER Scenario 4. It was found that the more complete 2D (velocity space) Fokker Planck – ray tracing models predicted the highest driven currents (2.0 -2.5 MA). It was found that the simulation models based on a response function – ray tracing approach predicted significantly less LH current and that this could be due to improper treatment of 2D velocity space effects in the wave absorption. Differences in
the driven current were also found among the 2D model predictions and may be related to differences in how the models treat particle trapping and bounce averaging of the RF operator. In the future, CQL3D and DELPHINE will be run on the same test case with particle trapping effects shut off. Also, the 2D models should be compared with the predictions of other advanced Fokker Planck treatments such as the DKE code [20]. The sensitivity observed in the LHRF deposition profiles at n0//=1.9 for codes using slightly different equilibria will necessitate a direct comparison of LH ray trajectories from the different ray tracing codes in future work. Also in future work the effect of reduced directionality in the LH coupler spectrum will be quantified. Finally, the orbit following Monte Carlo code SPOT was modified to include the effects of spatial diffusion on fast alpha particles due to TF coil ripple and anomalous ion transport. It was found that an anomalous diffusion coefficient of 1m2/s could cause enough spatial diffusion in the alpha density profile to increase the parasitic damping of LH waves at 3.7 GHz from 1.8% (with no transport) to 7.7%. Future work should include simulations with SPOT and DELPHINE at 5 GHz in order to confirm that the parasitic damping drops to negligible levels at the higher frequency. [1] JARDIN, S.C. et al, Fusion Engineering and Design 38, 27 (1997).
[2] SÖLDNER, F.X. et al., Plasma Physics and Controlled Fusion 39, B353-B369 (1997). [3] IDE, S., NAITO, O., OIKAWA, T. et al., 17th IAEA Conference on Fusion Energy (Yokohama, Japan, 1998), (IAEA, Vienna, 1998) Vol. 2 p. 567.
[4] ITER Technical Basis Document (IAEA, Vienna, 2001) Doc. No. GAO FDR 1 00-07-13 R1.0, Section 4.3.3.
[5] HARVEY, R.W. and McCOY, M.G., Proceedings of the IAEA Technical Committee Meeting on Advances in Simulation and Modeling of Thermonuclear Plasmas, Montreal, 1992, p. 489-526, IAEA, Vienna (1993); US DOC-NTCC Doc. No. DE93002962. [6] SMIRNOV, A.P. and HARVEY, R.W., Bull. Am. Phys. Soc. 40,1837 (1995). [7] IMBEAUX, F. and PEYSSON, Y., Plasma Physics and Controlled Fusion 47, 2041 (2005).
[8] IGNAT, D.W., Nuclear Fusion 34 837 (1994).
[9] DEVOTO, R.S., et al., Nuclear Fusion 32, 773 (1992).
[10] KARNEY, C.F.F. and FISCH, N.J., Physics of Fluids 28, 116(1985). [11] KARNEY, C.F.F. and FISCH, N.J., Physics of Fluids 22, 1817 (1979). [12] TALA, T.J.J. et al., Nuclear Fusion 40, 1635 (2000).
[13] FUCHS, V. et al., Physics of Fluids 28, 3619 (1985).
[14] BONOLI, P.T. and ENGLADE, R.C., Physics of Fluids 29, 2937 (1986).
[15] KESSEL, C. et al., 21st IAEA Fusion Energy Conference, (Chengdu, China, October 16 21, 2006) Paper IT/P1-7.
[16] JARDIN, S.C. et al., J.L., Journal of Computational Physics 66 481 (1986). [17] PORKOLAB, M., Physics of Fluids 20, 2058 (1977).
[18] SCHNEIDER, M., ERIKSSON, L.-G., BASIUK, V., and IMBEAUX, F., 33rd EPS Conference on Plasma Physics and Controlled Fusion (Roma, Italy, June 19-23, 2006). [19] SCHNEIDER, M. et al., Plasma Physics and Controlled Fusion 47, 2087 (2005). [20] DECKER, J. and PEYSSON, Y., Technical Report EUR-CEA-FC-1736 EURATOM CEA Cadarache, December, 2004.
This work was supported in part by the US DoE under contract Nos. DE-FC02 99ER54512 and DE-FC02-01ER54649.