Publisher’s version / Version de l'éditeur:
37th AMOP Technical Seminar on Environmental Contamination and Response, pp. 666-681, 2014-06-05
READ THESE TERMS AND CONDITIONS CAREFULLY BEFORE USING THIS WEBSITE.
https://nrc-publications.canada.ca/eng/copyright
Vous avez des questions? Nous pouvons vous aider. Pour communiquer directement avec un auteur, consultez la
première page de la revue dans laquelle son article a été publié afin de trouver ses coordonnées. Si vous n’arrivez pas à les repérer, communiquez avec nous à PublicationsArchive-ArchivesPublications@nrc-cnrc.gc.ca.
Questions? Contact the NRC Publications Archive team at
PublicationsArchive-ArchivesPublications@nrc-cnrc.gc.ca. If you wish to email the authors directly, please see the first page of the publication for their contact information.
NRC Publications Archive
Archives des publications du CNRC
This publication could be one of several versions: author’s original, accepted manuscript or the publisher’s version. / La version de cette publication peut être l’une des suivantes : la version prépublication de l’auteur, la version acceptée du manuscrit ou la version de l’éditeur.
Access and use of this website and the material on it are subject to the Terms and Conditions set forth at
Natural attenuation potential for oil in ice in the Canadian Arctic marine environment
Greer, Charles W.; Wyglinski, Joanne; Michel, Christine; Fortin, Nathalie; Sanschagrin, Sylvie; Niemi, Andrea; Whyte, Lyle G.; King, Thomas L.; Lee, Kenneth; Yergeau, Etienne
https://publications-cnrc.canada.ca/fra/droits
L’accès à ce site Web et l’utilisation de son contenu sont assujettis aux conditions présentées dans le site LISEZ CES CONDITIONS ATTENTIVEMENT AVANT D’UTILISER CE SITE WEB.
NRC Publications Record / Notice d'Archives des publications de CNRC: https://nrc-publications.canada.ca/eng/view/object/?id=1922a5d1-5a72-4f2f-a165-4013a8b54cb4 https://publications-cnrc.canada.ca/fra/voir/objet/?id=1922a5d1-5a72-4f2f-a165-4013a8b54cb4
Natural Attenuation Potential for Oil in Ice in the Canadian Arctic Marine Environment
Charles W. Greer1, Joanne Wyglinski1, Christine Michel2, Nathalie Fortin1, Sylvie Sanschagrin1, Andrea Niemi2, Lyle G. Whyte3, Thomas L. King4, Kenneth Lee5 and Etienne Yergeau1
1
National Research Council Canada, Energy, Mining and Environment, 6100 Royalmount Avenue, Montreal, Quebec, H4P 2R2, Canada; 2Fisheries and Oceans Canada, 501 University
Crescent, Winnipeg, Manitoba, R3T 2N6, Canada; 3McGill University, MacDonald Campus, 21,111 Lakeshore Road, Sainte-Anne-de-Bellevue, Quebec, H9X 3V9, Canada; 4Fisheries and
Oceans Canada, PO Box 1006, Dartmouth, Nova Scotia, B2Y 4A2, Canada; 5Commonwealth Scientific and Industrial Research Organisation (CSIRO), Australian Resources Research Centre,
Kensington WA 6151, Australia. E-mail: charles.greer@cnrc-nrc.gc.ca
Abstract
The exploration and exploitation of oil and gas resources in Canada’s Arctic carries with it certain risks that include the potential for oil spills and their effects on this fragile, yet extreme ecosystem. To develop an effective response strategy for an oil spill in an Arctic environment that would consist of a mixture of seawater and sea ice, a survey was conducted in the area of Cornwallis Island to develop baseline data on the natural microbial community structures and to determine whether these indigenous species possess the capacity to degrade petroleum
hydrocarbons.
Metagenomics and high throughput sequencing are relatively new approaches using modern genomics techniques to directly study communities of microorganisms in their natural environments, avoiding the need for traditional isolation and culturing. This provides more relevant ecological data, since the results directly relate to the population structure of the
microorganisms that are present as well as the functional potential of the community, such as, for example, its inherent capacity to degrade petroleum hydrocarbons.
Based on high-throughput sequencing of total community 16S rRNA gene amplicons and metagenomic sequencing, the indigenous bacterial populations in sea water were significantly different from those associated with the underside of the sea ice. Both sea water and sea ice were dominated by Bacteroidetes (Flavobacteria) but seawater was also abundant in Proteobacteria, primarily Alpha- and Gammaproteobacteria. The bottom of the sea ice demonstrated selective enrichment for Gammaproteobacteria, which contains numerous genera of obligate hydrocarbon degrading bacteria, such as Alkanivorax and Oleispira. There were both spatial and
physicochemical influences on the microbial population structures, indicating that variations in the local environment can shape the structure of the microbial community, findings that are supported by other studies on polar microbial communities. These results demonstrate that seawater and sea ice in the Canadian Arctic possess natural microbial communities with the inherent ability to degrade petroleum hydrocarbons.
Introduction
Global warming has accelerated the decline of Arctic sea ice and revised predictions suggest a near complete loss of Arctic summer sea ice by mid-century or sooner (AMAP, 2009; 2011). Effects on marine ecosystems are numerous and include primary production increases, changes in microbial community structures (Bowman et al., 2012; Kirchman et al., 2009;
Comeau et al., 2011), surface water freshening causing a decrease in salinity and increasing stratification. Ice melt and a displacement of first-year ice (FYI) with multiyear ice (MYI)
freshens the surface water, increasing stratification, opposing sinking occurrences and translating into possible changes in the microbial communities (Bowman et al., 2012).
Similar microbial community structures have been observed at both poles (Deming, 2010) with a prevalence of Proteobacteria (Gammaproteobacteria and Alphaproteobacteria) and Bacteroidetes (Flavobacteria) common to both sea ice and sea water. Clone library sequencing of microbial communities in various FYI layers in the Beaufort Sea (Collins et al., 2010) and 454 sequencing of the 16S rRNA gene of MYI communities near the north pole (Bowman et al., 2012) revealed similar diversity in the sea ice and surface water bacterial communities. In the Laptev Sea, a clone library study demonstrated the importance of
physicochemical forcings such as temperature and riverine input in shaping surface sea water bacterial communities (Kellogg and Deming 2010). These observations suggest that Arctic microbial community structure is influenced by physicochemical and spatial forcings, including at the Arctic sea ice-surface water interface. These phenomena have not yet been analyzed in depth using Next Generation Sequencing (NGS) methods.
The Canadian Arctic Archipelago constitutes an extensive Arctic continental shelf area, of high socio-economic and ecological importance due to its highly productive ice-associated ecosystem, its role as a refuge for multiyear ice, and as a northern route via the Northwest Passage (e.g. AMAP, 2011; McLaughlin et. al., 2004; Michel et al., 2012). The Canadian Arctic Archipelago is characterized by a diversity in oceanic conditions that vary regionally and
temporally (annually and interanually), with a variable influence of Pacific and Atlantic-origin waters (McLaughlin et al., 2004; Michel et al., 2006). Tidally and topographically-enhanced mixing modifies water masses in the Canadian Archipelago. Tidal currents, which are especially strong in the Barrow Strait, are important for nutrient replenishment at the ice-water interface, fueling ice algal production that would otherwise become nutrient-limited. A combination of light and nutrient availability through mixing and potential remineralization are key factors controlling primary production in the ice.
Despite available information, 16S rRNA gene amplicon sequencing studies conducted in the marine environment in the Canadian high Arctic are limited (Yergeau and Greer, 2012). This technique is required for a comprehensive assessment of microbial diversity as less than 0.1 % of marine microbes are estimated to have been successfully cultivated (Cowan, 2000). The novelty of this sequencing study is two-fold in that i) this study is the first of its kind in analyzing
microbial community composition and structure of the productive bottom sea ice community and underlying surface waters employing NGS and ii) metagenomic studies have never been
conducted in the marine Arctic environment in this region. The purpose of the present study was to employ NGS to perform a broad screening of sea ice and sea water bacterial communities in the area of Cornwallis Island, Nunavut, to develop a baseline of bacterial community structural variability. In addition metagenomic analysis was employed to evaluate the effects of a potential oil spill on the bacterial community structure and function, in particular on potential hydrocarbon degrading bacteria. The results will be essential to develop a broader knowledge of the microbial communities that are present in this sea ice and sea water environment and whether these
Materials and Methods Sample collection
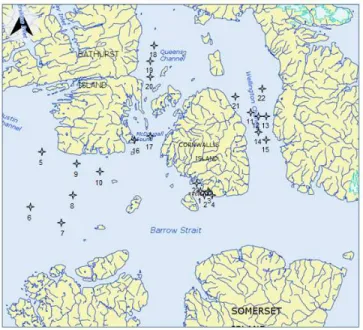
Surface water and ice bottom samples were collected at 23 stations surrounding Cornwallis Island, in Lancaster Sound, Wellington Channel and adjacent channels, between 74.10’ and 75.93’N and 92.64’ and 101.34’W (Figure 1). The sampling was carried out from during May, 2011, which corresponded to the period of the ice algal bloom. At each station, seven or eight ice cores were collected using a 9 cm diameter manually-driven ice core auger (Mark II coring system, Kovacs Enterprises, Lebanon, NH, USA). The bottom section of each core was cut using a clean stainless steel saw and brought back to the shore laboratory for analysis. Three or four cores, used for biomass measurements and metagenomic analyses, were pooled together and melted with the addition of filtered surface seawater collected at the time of sampling. The three other cores, used for chemical analyses, were placed in a sterile bag and melted without addition of seawater. Sterile gloves were worn at all times when manipulating the cores. The cores were slowly melted at cool temperatures in the dark. Surface water was
collected using a submersible pump attached to an under ice arm that was deployed at the sea ice-water interface. At the time of sampling, snow thickness and ice thickness were measured at 5 sites in the vicinity of core collection. Sea surface temperature and salinity was obtained with a Idronaut Ocean Seven 304 (Brugherio MB, IT) CTD (Conductivity, Temperature, Depth)
calibrated prior to the field program.
Sample Processing and Analyses:
Total DNA was obtained from duplicate sea ice bottom (50 - 100 ml) and surface sea water samples (1000 ml) filtered on sterile 0.22 µm nitrocellulose filters (Millipore, Billerica, MA, USA). The filters were immediately frozen and stored at -80°C until DNA was extracted, as detailed below.
Bottom ice and surface sea water samples were analyzed for chlorophyll a (chl a), bacterial abundance, particulate organic carbon (POC), dissolved organic carbon (DOC) and dissolved nitrogen (DN), DNA and RNA extractions, macro-nutrients (NO3 + NO2, PO4, SiOH4)
and salinity.
Chl a was measured on duplicate samples filtered onto Whatman GF/F 25 mm filters, extracted in 90% acetone at 4ºC in the dark during 24 h. Fluorescence was read on a 10AU Turner Design fluorometer calibrated using pure chl a extract (Sigma) and chl a concentrations were calculated according to Parsons et al. (1989). Bacterial abundance was measured by flow cytometry on samples pre-filtered through a 20 µm mesh, fixed with glutaraldehyde 0.1% final concentration and quickly frozen and stored at −80°C. For analysis, the frozen samples were quickly thawed in a 30 °C water bath and were stained with SYBR Green I (Invitrogen). Bacteria were counted with an Epics Altra flow cytometer (Beckman Coulter) fitted with a 488 nm laser operated at 15 mW. The green fluorescence of nucleic acid-bound SYBR Green I was measured at 525±5 nm. POC was measured on duplicate samples filtered on pre-combusted (450ºC for 24 h) Whatman GF/F 21 mm filters, kept frozen at -80ºC until analysis on a Carlo Erba NC2500 elemental analyzer.
Dissolved organic carbon and nitrogen were measured using a Shimadzu TOC-VCHP analyzer with a TNM-1 Total Nitrogen module, on duplicate samples filtered through pre-combusted Whatman GF/F filters and kept in acid-washed, pre-pre-combusted EPA amber glass vials with open-top caps and PTFE silicone septa. Analyses were systematically checked against low carbon water and deep Sargasso Sea reference water from Hansell’s Certified Reference
Materials (CRM). Nutrients were analyzed on samples pre-filtered through pre-combusted Whatman GF/F filters using an acid-washed sweenex, and kept at -80°C until analysis on a Smartchem 200 chemistry analyzer. Additional details on the methods can be found in Michel and Niemi (2009).
Mesocosm study
A mesocosm study was performed to examine the effects of oil and dispersant on the bacterial communities in seawater and sea ice. The mesocosm consisted of four equal volume chambers (capacity of 4 L each) contained within a water bath that was capable of maintaining an operating water temperature in the cells of -2°C (Figure 4). Each chamber was operated under different conditions as described in Table 2. The chambers received the appropriate treatments and were mixed at relatively slow rates for 14 days at an average temperature of -1°C. At the end of the incubation period the contents of each chamber were sacrificed and samples were
collected for chemical analysis and the water was filtered on 0.22 µm filters. The filters were stored at -20°C in 50 ml Falcon tubes until they were processed. The filters were processed using the Ausubel et. al. (2002) technique as described below to extract total nucleic acids for
sequencing.
DNA and RNA extraction
The Powerwater RNA Isolation Kit (MoBio Laboratories, Carlsbad, CA, U.S.A.) was used for surface water nucleic acid extraction of the 0.22 µm Millipore filters according to the manufacturer’s protocol, modified for the presence of lysis-resistant organisms and the omission of DNAse treatment for total nucleic acid extraction. DNA was quantified using the Picogreen method (Life Technologies, Invitrogen Branch, Grand Island, N.Y., U.S.A.) according to the manufacturer using a Tecan Magellan Fluorimeter (Tecan Group Ltd., Männedorf, CH).
The protocol for simultaneous DNA and RNA extraction of the bottom ice filters was based on a modified CTAB (cetyltrimethylammonium bromide) method of Ausubel et al. (2002) to address the excessive amounts of exopolymeric substances found on these filters. Volumes were tripled in comparison to the original protocol to ensure full submersion of filters. Filters were incubated in 0.5% SDS and 100 µg/ml proteinase K in TE (Tris-EDTA) for 1 h at 37ºC. NaCl was added to a final concentration of 0.75 M, as well as CTAB/NaCl (1% CTAB, 0.4% NaCl, final concentration) and the mixture was incubated at 65ºC for 10 minutes. To inactivate RNAses, one volume of 24:1 chloroform:isoamyl alcohol was added, vortexed and centrifuged for 10 minutes at 5000 rpm. After transferring the supernatant to a fresh Falcon tube, one volume of 25:24:1 phenol (pH 7.9 for total nucleic acid extraction):chloroform:isoamyl alcohol was added, vortexed and centrifuged under the same conditions. The supernatant was transferred to a fresh tube after which 0.6 volumes isopropanol were added with a final concentration of
glycogen of 100 ng/µl and precipitated overnight at -20ºC.
Samples were centrifuged at 13,100 x g on a Beckman Model J2-21M centrifuge
(Mississauga, ON) for 30 minutes at 4ºC, washed with 70% ethanol and resuspended in 200 µl of TE buffer. DNA was quantified by the Picogreen method, and all extracts were stored at -80ºC until further analysis.
Filters from the microcosms were treated for the extraction of total DNA using the Ausubel et al. (2002) method, as described above.
Amplification of the 16S rRNA gene
Amplification of the 16S rRNA gene was performed using primers designed to target the hypervariable V5 region, with the 198 bp product from each sample designated its own multiplex identifier (MID) on the Biorad Cycler (Bio-Rad, Hercules, CA, USA). For 16S rRNA gene amplification, we used the following primers: forward: 5’- CCA TCT CAT CCC TGC GTG TCT CCG ACT CAG XXX XXG ATT AGA TAC CCT GGT AG-3’ and reverse 5’- CCT CTC TAT GGG CAG TCG GTG ATC CGT CAA TTC CTT TRA GTT T -3’. The X’s represent the sample specific MID, the underlined sequence represents the template specific sequence and the remaining sequence is the Ion Torrent adapter A (forward) and adapter P1 (reverse). rTaq polymerase and reagents were purchased from GE Healthcare (Piscataway, NJ, USA). PCR amplification reactions had the following final concentrations (per 25 µl): 2.5 mM MgCl2, 0.4
mg/ml BSA, 0.5 µM each of forward (MID) and reverse primer, 0.2 mM dNTPs, 2.5 x 10⁻² U/µl rTaq polymerase and 1 µl of sample. The PCR program had an initial 5 minute denaturation step at 95ºC, followed by 26 cycles of a 30 second denaturation step at 95ºC, a 30 second annealing step at 55ºC, and a 45 second elongation step at 72ºC. A final extension was performed at 72ºC for 10 minutes, followed by a hold at 4ºC. After verification of successful amplification, products were analyzed by electrophoresis on a 2% gel and bands were excised for purification using the Qiagen Qiaquick Gel Extraction kit (Qiagen, Valencia, CA, USA) according to the
manufacturer’s protocol. DNA was eluted in 50 µl Ambion nuclease-free water (Life
Technologies, Invitrogen Branch, Grand Island, NY, USA) and quantified using the Picogreen method according to the manufacturer’s instructions. Samples were diluted to 5 x 10⁹
molecules/µl, and 10 µl of each was used for emulsion PCR.
Template preparation
Emulsion PCR was conducted according to the Ion XpressTM Template Kit User Guide (Life Technologies, Ion Torrent Branch, Guilford, CT, USA). The optimal library concentration (4:1) of 956 x 106 molecules per reaction was previously determined by a library titration. Quality assessment was done according to Ion Xpress™ Template Kit User Guide using the Qubit© 2.0 Fluorometer (Life Technologies, Guilford, CT, USA).
Ion Torrent amplicon sequencing
The sequencing was performed on the Ion Torrent Personal Genome Machine (Life Technologies, Ion Torrent Branch, Guilford, CT, USA) with an Ion 314R chip according to the Ion Sequencing Kit protocol. The total number of reads obtained for surface sea water and ice bottom samples was 186,086 (ca. 4,000 reads per sample). The average read lengths ranged from 101 to 112 bp for sea ice bottom and surface sea water samples, respectively.
Taxonomic assignments
Community composition assessment was performed using the RDP pyrosequencing pipeline (http://pyro.cme.msu.edu/), where sequences were separated based on their adapter, deconvoluted and binned according to their respective MIDs. Sequences were screened for a minimum length of 50 bp, the average Phred quality score was set at 15, maximum length of homopolymers was 6, and the RDP classifier confidence level was set at 0.25 for decreased stringency to minimize unclassified reads.
Statistical analyses
Community structure analysis was performed using the microbial ecology community software program Mothur (http://www.mothur.org/wiki/Download_mothur) (Schloss et al., 2009); the Schloss Standard Operating Protocol was used as a guideline. Unique RDP-trimmed sequences (see Taxonomic assignments section above) were aligned against the Silva compatible alignment database to obtain the highest possible identity using the Needleman-Wunsch
algorithm (Needleman and Wunsch, 1970; Schloss et al., 2009). Sequences were filtered for similar range of overlap. Pre-clustering was performed to remove reads due to sequencing errors, eliminating these at a 1 bp difference. Chimeras were not detected (UCHIME algorithm), after which a distance matrix was generated and clustering performed. Operational taxonomic units obtained were unique or 97% in similarity. Inverse Simpson’s indices (Simpson, 1949) and Chao1 richness was determined at each level of similarity. A paired t-test was performed using the t test function in R at a 95% confidence interval.
Statistical analyses for physicochemical/geographical forcings were conducted using R (The R foundation for Statistical Computing, Vienna, Austria). Spearman rank-order correlations (rs) were carried out using the “cor.test” function. Principal coordinate analyses (PCoA) were
carried out using the “cmdscale” function. Maximum correlation of points with averaged environmental variables was performed with the “envfit” function. Mantel tests based on Spearman correlations were performed using the “mantel” function. Geographical distances between sampling sites were derived from GPS coordinates using the “earth.dist” function of the “fossil” package. Weighted-normalized Unifrac distances between each sample pair were
calculated using the FastUnifrac website (Hamady et al., 2009) based on the GreenGene core dataset.
Results and Discussion
Physico-chemical characteristics of sea water and sea ice
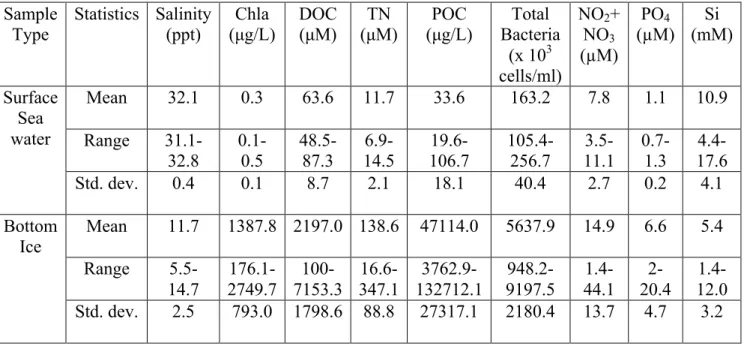
The analysis of the physico-chemical characteristics of the sea ice and sea water samples from the various stations is presented in Table 1. The sea ice bottom clearly had a much higher amount of biomass in comparison with the sea water, with concentrations of chlorophyll a, dissolved organic carbon, particulate organic carbon, total nitrogen and bacterial abundance were often one to several orders of magnitude higher than the sea water. Nutrients, such as nitrate and phosphate, were only marginally higher in the sea ice. The sea ice bottom represents a surface for microbial attachment, a preferential arrangement in aquatic systems, and therefore possesses higher populations of microorganisms and their associated biopolymers and nutrients.
Microbial Community Structure
The overall analysis and comparison of the sea water and sea ice microbial communities during the screening study indicated that the seawater species richness (Chao I) was three times higher that that for the sea ice and the diversity (Inverse Simpson’s index) was more than twice as high in sea water in comparison to sea ice (data not shown). This is perhaps not surprising considering that microorganisms that inhabit and thrive attached to sea ice are probably quite specialized for this particular niche, which has properties that are quite distinct from those of the adjacent sea water.
Analysis of the microbial community structure of sea water and sea ice demonstrated that both these environments were dominated by the bacterial phyla Proteobacteria and
Bacteroidetes (represented primarily by the class Flavobacteria), typically representing more
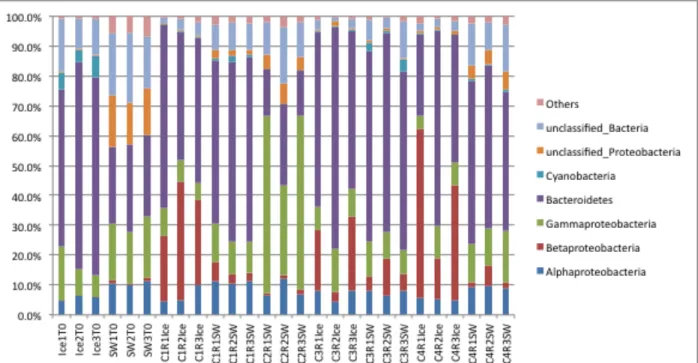
than half of the total bacterial sequences obtained. Figure 2 presents the bacterial community structure at the class level over all the sample locations (Fig. 1) for both sea water and sea ice (each station shows the average of duplicate sequence analyses, such that the total number of analyses performed was 46 for sea ice and 46 for sea water). Although there is some variability observed across all the analyses, the trends clearly demonstrate the dominant bacterial groups. Some of the variation appears to be related to the sampling location, where the influences of physico-chemical forcings were different. It is apparent that the Flavobacteria (Bacteroidetes) are present almost equally in both the sea water and the sea ice. The Alpha-proteobacteria are clearly more numerous in the sea water than in sea ice, whereas the Gamma-proteobacteria are more dominant in sea ice than in sea water, and Actinobacteria, which are consistently present in sea water are virtually non-detectable in sea ice. In a recent study by Bowman et al (2012), multi-year ice (MYI) at the north pole was found to have a lower relative abundance of
Alpha-proteobacteria in comparison to the surrounding sea water.
Community composition of surface water and ice bottom samples of this study were comparable to previous studies involving Arctic and Antarctic phylogenetic assessments of sea ice and surface sea water bacteria. Proteobacteria and Bacteroidetes were predominant in ice bottom samples in near equivalent abundances in this study, which is similar to the MYI findings of the whole core sampled at the North Pole in August 2010 (Bowman et al., 2012) and also consistent with a Norwegian Fjord study (Brakstad et al., 2008). Flavobacteria and
Gammaproteobacteria were equally as predominant at the ice bottom from all stations, also
similar to North Pole MYI, with the exception of elevated levels of Gammaproteobacteria in comparison to Flavobacteria in MYI. Even though both studies used next-generation
sequencing, the use of different regions of the 16S rRNA gene for amplification and sequencing may cause some confounding issues in comparing data between studies, as can other parameters that differ between studies such as age of the sea ice and time of the year.
Although present in the sea water and sea ice, obligate hydrocarbonoclastic bacteria (OHCB), such as Alcanivorax and Oleispira, comprised only a very small percentage of the sequence reads (typically <1%). This indicates that these bacteria are present in the sea water and sea ice, but their population densities are very low relative to other bacteria. Of importance is whether their presence at low numbers is sufficient to initiate an effective response should an oil spill occur. Several other genera including Polaribacter and Glaciecola were dominant in the sea ice, but barely detectable in sea water, again suggesting that the sea ice is an unique and selective environment.
Comparative analysis with other marine studies
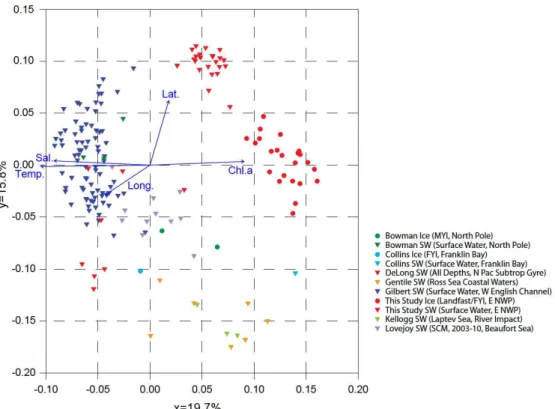
To confirm spatial influence on evolutionary distance, a meta-data analysis of several marine 16S rRNA sequencing studies was conducted and compared to this study using Principal Coordinate Analysis of UniFrac distances. The plot (Fig. 3) revealed distinct clustering
(ordination) along the x-axis for surface water and sea ice data from this study, indicating significant evolutionary distance from other studies. A clear separation between surface sea water and sea ice stations of this study was evident. Overall, samples of polar environments clustered on the positive side of the y-axis, while temperate studies tended to be located more on the negative side. A Mantel test of Spearman ranks of UniFrac data and geographical distance verified this finding (Mantel statistic r=0.65, P=1.5e-4). Vectors of environmental forcings revealed a strong correlation between sea ice samples and chl a, while surface sea water
community evolution was correlated more with latitude. Predominant bacterial classes of this study and the other studies used in the UniFrac analysis, indicate that there is considerable variability in microbial distribution, even among polar studies. There are numerous factors that could contributing to this variability such as temperature and nutrients, as well as the fact that different studies employed different 16S rRNA gene amplification primers which may have preferentially caused some shifts in population distribution amongst different bacterial phyla.
Metagenomic analysis of mesocosms
The mesocosm study examined the effects of oil and dispersant on the bacterial community structures in seawater and sea ice. The four chambers of the mesocosm each had different conditions as shown in Table 2. A metagenomic (sequence analysis of the total DNA extracted from the chamber contents) comparison of the starting sea water and sea ice with the chamber contents after incubation with oil plus Corexit dispersant (Chamber 1), oil alone without ice cores (Chamber 2), oil with filtered sea water (Chamber 3), or no oil (Chamber 4) was
performed (Figure 5). Although there was considerable variation amongst replicates, the
phylogenetic distribution for the starting sea water and sea ice was very similar to that observed in the initial screening study. Again, the Bacteroidetes and Proteobacteria were the dominant phyla, comprising typically >70% of the total population sequencing reads in both sea ice and sea water. Gammaproteobacteria were more abundant in the starting sea water than in sea ice, while the inverse was evident for Bacteroidetes. There was a major shift in the bacterial
population structure in the mesocosms following incubation (Fig. 5). In the sea ice in chamber 1,
Betaproteobacteria became more dominant, whereas they were almost undetectable in the
starting sea water and sea ice. In the sea water of chamber 1, Bacteroidetes became more abundant than in the starting sea water. In chamber 2, which contained only oil and no sea ice,
Gammaproteobacteria abundance increased significantly, while the Bacteroidetes population
decreased. In the sea water in chambers 3 and 4, Gammaproteobacteria decreased relative to the starting sea water and the Betaproteobacteria increased in relative abundance compared to their population densities in the starting sea water and sea ice. In these latter two chambers, while the abundance was variable, Bacteroidetes remained a relatively dominant phylum. One of the most significant differences in this comparison was with the Betaproteobacteria, which increased in the sea ice in all mesocosms.
A more detailed metagenomic analysis of the mesocosms at the bacterial genus level produced some very interesting results (Fig. 6). While the population density of many bacteria known to be hydrocarbon degrading bacteria appeared to be relatively unchanged between the starting sea water and sea ice relative to the mesocosm chambers, many of these bacteria increased dramatically in chamber 2, which was exposed to oil only and had no ice cores. The largest increase was with Colwellia, which increased from almost non-detectable to over 25 % of the bacterial population. In addition, other known hydrocarbon degrading bacteria, such as
Oceanospirillales, Pseudomonas, and to a lessor extent Marinobacter also increased
significantly.
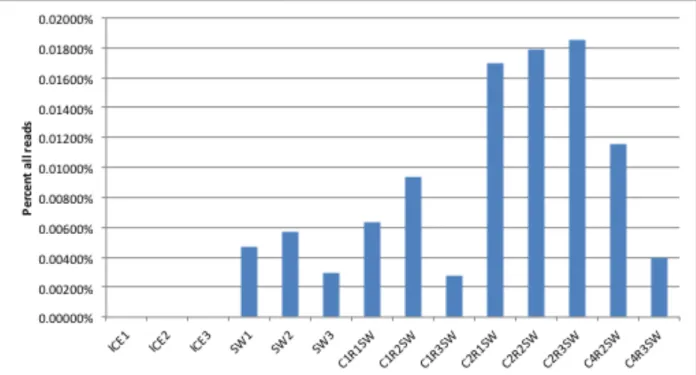
Metagenomic analysis of one of the key genes involved in alkane degradation, alkane monooxygenase, showed that mesocosm chamber 2 also demonstrated significant increases in this gene in relation to the starting sea water, sea ice and the other mesocosm chambers (Fig. 7). There was a substantial increase in the relative abundance of this gene in mesocosm 2 in
comparison to the abundance under the other conditions, which may be related to the increased abundance of the known hydrocarbon degraders although the percentage of the number of reads
was relatively low. These results suggest that the bacterial response to the presence of oil in chamber 2 was significantly greater than in the other mesocosm chambers. It would be interesting to determine if this response is directly related to the increased numbers of hydrocarbon degrading bacteria observed in Fig. 6. The presence of significant numbers of hydrocarbon degrading bacteria, in addition to their fairly broad phylogenetic diversity, suggests that the indigenous bacterial population has considerable hydrocarbon-degrading potential.
Conclusions
The present study provides a detailed screening of bacterial populations present in the Cornwallis Island area of the Canadian high Arctic marine environment. The results indicate that the indigenous marine bacterial populations in the sea ice and sea water are relatively consistent, with population structures similar to what has been observed in other studies. Although the natural communities possess hydrocarbon-degrading populations, they are relatively low. Exposure to oil clearly enhanced both the numbers and activity of hydrocarbon-degrading bacteria, in particular, members of the Gammaproteobacteria where a large number of diverse hydrocarbon-degrading bacteria reside, which bodes well for the potential of natural attenuation in an oil spill in Arctic waters. Additional details on the hydrocarbon degrading potential of these indigenous populations and the conditions needed to enhance their activity will be beneficial to any oil spill countermeasures that are under development for Arctic conditions.
Acknowledgements
This project was funded by the NRCan Program of Energy Research and Development (PERD). The authors gratefully acknowledge Jennifer Mason, Danielle Beaumier, Claude Mssson, Diane Labbé, Danielle Ouellette and Christine Maynard for their excellent technical assistance.
References
Arctic Monitoring and Assessment Program (AMAP), “Snow, Water, Ice and Permafrost in the Arctic (SWIPA): Climate Change and the Cryosphere”, Oslo, Norway, 2009.
Arctic Monitoring and Assessment Program (AMAP), “Snow, Water, Ice and Permafrost in the Arctic (SWIPA): Sea Ice”, Oslo, Norway, 2011.
Ausubel, F.M., “Preparation of Genomic DNA from Bacteria”, In Ausubel, F.M., R. Brent, R.E. Kingston, D.D. Moore, J.G. Seidman, J.A. Smith and K. Struhl (eds.), Short Protocols in
Molecular Biology, 5th edition, John Wiley & Sons Ltd, New York, USA, pp. 2-11, 2002. Belzile, C., S. Brugel, C. Nozais, Y. Gratton and S. Demers, “Variations of the abundance and nucleic acid content of heterotrophic bacteria in Beaufort Shelf waters during winter and spring”,
J. Mar. Syst. 74:946-956, 2008.
Bowman, J.S., S. Rasmussen, N. Blom, J.W. Deming, S. Rysgaard and T. Sicheritz-Ponten, “Microbial community structure of Arctic multiyear sea ice and surface seawater by 454 sequencing of the 16S RNA gene”, ISME J 6:11-20, 2012.
Brakstad, O.G., I. Nonstad, L.G. Faksness and P.J. Brandvik, “Responses of microbial
communities in Arctic Sea ice after contamination by crude petroleum oil”, Microb. Ecol. 55:540-552, 2008.
Cole, M., T. King and K. Lee, “Analytical technique for extracting hydrocarbons from water using sample container as extraction vessel in combination with a roller apparatus”, Canadian
Technical Report of Fisheries and Aquatic Sciences 2733, pp. 1-12, 2007.
Collins R.E., G. Rocap and J.W. Deming, “Persistence of bacterial and archaeal communities in sea ice through an Arctic winter”, Environ. Microbiol. 12:1828-1841, 2010.
Comeau A.M., W.K.W. Li, J.E. Tremblay, E.C. McLaughlin and C. Lovejoy. “Arctic Ocean Microbial Community Structure before and after the 2007 Record Sea Ice Minimum”, PLoS
ONE 6: e27492. doi:10.1371/journal.pone.0027492, 2011.
Cowan, D.A., “Microbial genomes- the untapped source”, Trends Biotechnol. 18:14-16, 2000. DeLong, E.F., C.M. Preston, T. Mincer, V. Rich, S.J. Hallam, N.U. Frigaard, A. Martinez, M.B. Sullivan, R. Edwards, B.R. Brito, S.W. Chisholm and D.M. Karl, “Community Genomics Among Stratified Microbial Assemblages in the Ocean’s Interior”, Science 311:496-503, 2006. Deming, J.W., “Sea Ice Bacteria and Viruses”, in Sea Ice, 2nd ed, D.N. Thomas and G.S. Dieckmann (eds.), Wiley Blackwell, Oxford, UK, pp. 247-282, 2010.
Gentile, G., L. Giuliano, G. D’Auria, F. Smedile, M. Azzaro, M. De Domenico and M.M. Yakimov, “Study of bacterial communities in Antarctic coastal waters by a combination of 16S rRNA and 16S rDNA sequencing”, Environ. Microbiol. 8:2150-2161, 2006.
Gilbert, J.A., D. Field, P. Swift, S. Thomas, D. Cummings, B. Temperton, K. Weynberg, S. Huse, M. Hughes, I. Joint, P.J. Somerfield and M. Mühling, “The Taxonomic and Functional Diversity of Microbes at a Temperate Coastal Site: A‘Multi-Omic’ Study of Seasonal and Diel Temporal Variation”, PloS ONE 5: e15545.doi:10.1371/journal.pone.0015545, 2010.
Hamady, M., C. Lozupone and R. Knight, “Fast UniFrac: facilitating high640 throughput phylogenetic analyses of microbial communities including analysis of 641 pyrosequencing and PhyloChip data”, ISME J. 4:17-27, 2009.
Kellogg C.T.E. and J.W. Deming, “Comparison of free-living, suspended particle, and
aggregate-associated bacterial and archaeal communities in the Laptev Sea”, Aquat. Microb.
Ecol. 57:1-18, 2009.
Kirchman, D.L., X.A.G. Morán and H. Ducklow, “Microbial growth in the polar oceans-role of temperature and potential impact of climate change”, Nat. Rev. Microbiol. 7:451-459, 2009. McLaughlin, F.A.,E.C. Carmack, R.G. Ingram, W.J. Williams and C. Michel, “Oceanography of
Studies and Syntheses, A.R. Robinson and K.H. Brink (eds.), Harvard University Press, 14:1211-1242, 2004.
Michel, C. and A. Niemi, “Field and Laboratory Methods for Biogeochemical Analyses of Sea Ice, Seawater and Particle Interceptor Trap Particles”, Canadian Technical Report of Fisheries
and Aquatic Sciences 2852, Central and Arctic Region, Department of Fisheries and Oceans
Canada, Winnipeg, Manitoba, 2009.
Michel, C., R.G. Ingram and L.R. Harris, “Variability in oceanographic and ecological processes in the Canadian Arctic Archipelago”, Prog. Oceanogr., 71:379-401, 2006.
Michel, C., B. Bluhm, V. Gallucci, A.J. Gaston, F.J.L. Gordillo, R. Gradinger, R. Hopcroft, N. Jensen, T. Mustonen, A. Niemi and T.G. Nielsen, “Biodiversity of Arctic Marine Ecosystems and Responses to Climate Change”, Biodiversity 13: 200-214, 2012.
Needleman, S.B. and C.D. Wunsch, “A General Method Applicable to the Search for Similarities in the Amino Acid Sequence of Two Proteins”, J. Mol. Biol. 48:443-453, 1970.
Parsons, T.R., Y. Maita and C.M. Lalli, A manual of chemical and biological methods for
seawater analysis, Pergamon Press, Toronto, ON, 173 p., 1989.
Schloss, P.D., S.L. Westcott, T. Ryabin, J.R. Hall, M. Hartmann, E.B. Hollister, R.A Lesniewski, B.B. Oakley, D.H. Parks, C.J. Robinson, J.W. Sahl, B. Stres, G.G. Thallinger, D.J. Van Horn and C.F. Weber, “Introducing mothur: open-source, platform independent, community-supported software for describing and comparing microbial communities”, Appl. Environ. Microbiol. 75:7537–7541, 2009.
Simpson, E.H. “Measurement of diversity”, Nature, 163:688, 1949.
Yergeau, E. and C.W. Greer, “Metagenomic Analysis of Polar Systems”, in Polar Microbiology:
Life in a Deep Freeze, R.V. Miller and L.G. Whyte (eds.), ASM Press, Washington, D.C., pp.
Table 1. Physico-chemical characterization of surface sea water and sea ice bottom at 23 stations, Canadian Arctic Archipelago, May 2011.
Sample Type Statistics Salinity (ppt) Chla (µg/L) DOC (µM) TN (µM) POC (µg/L) Total Bacteria (x 103 cells/ml) NO2+ NO3 (µM) PO4 (µM) Si (mM) Surface Sea water Mean 32.1 0.3 63.6 11.7 33.6 163.2 7.8 1.1 10.9 Range 31.1-32.8 0.1-0.5 48.5-87.3 6.9-14.5 19.6-106.7 105.4-256.7 3.5-11.1 0.7-1.3 4.4-17.6 Std. dev. 0.4 0.1 8.7 2.1 18.1 40.4 2.7 0.2 4.1 Bottom Ice Mean 11.7 1387.8 2197.0 138.6 47114.0 5637.9 14.9 6.6 5.4 Range 5.5-14.7 176.1-2749.7 100-7153.3 16.6-347.1 3762.9-132712.1 948.2-9197.5 1.4-44.1 2-20.4 1.4-12.0 Std. dev. 2.5 793.0 1798.6 88.8 27317.1 2180.4 13.7 4.7 3.2
Table 2. Mesocosm chamber contents.
Mesocosm chamber
Sea ice cores (3 per chamber)
Surface sea water (4L) Crude oil (4 mL) (Arabian light) Corexit EC9500A (1:25 disp:oil ) 1 X X X X 2 X X 3 X X* X 4 X X
Figure 1. Location of sampling stations in the Canadian Arctic Archipelago (Nunavut), May, 2011.
Figure 2. Taxonomic distribution (class) of bacteria for a) surface sea water, and b) sea ice bottom. Results are averages from duplicate samples at each station, based on 16S rRNA gene sequences.
Figure 3. Principal component analysis plot of UniFrac data originating from varying marine studies involving sequenced 16S rRNA genes.
Figure 4. Image of mesocosm chambers containing seawater and sea ice cores. Each chamber (4) was incubated at -1°C for 14 days with the contents as shown in Table 2.
1
2
3
4
Ice
core
Figure 5. Metagenomic analysis of the microbial community phylogeny in triplicate mesocosm samples and after 14 days incubation at -1°C in comparison to the starting seawater (SW) and sea ice (Ice). Initial seawater and sea ice samples (T0) are presented with samples for each
mesocosm cell (C1-C4) for seawater and ice.
Figure 6. Metagenomic analysis of specific microbial genera related to hydrocarbon degradation in mesocosm chambers after 14 days incubation at -1°C under the conditions identified in Table 2. Sample designations are as in Figure 5.
Figure 7. Metagenomic analysis of the alkane monooxygenase gene in mesocosm chambers following 14 days incubation at -1°C. Sample designations are as in Figure 5.