EUROPEAN ORGANISATION FOR NUCLEAR RESEARCH (CERN)
Submitted to: JHEP CERN-EP-2017-075
6th September 2017
Search for pair production of vector-like top quarks
in events with one lepton, jets, and missing
transverse momentum in
√
s
= 13 TeV pp collisions
with the ATLAS detector
The ATLAS Collaboration
The results of a search for vector-like top quarks using events with exactly one lepton, at least four jets, and large missing transverse momentum are reported. The search is optimised for pair production of vector-like top quarks in the Z(→νν) t+X decay channel. LHC pp collision data at a centre-of-mass energy of √s = 13 TeV recorded by the ATLAS detector in 2015 and 2016 are used, corresponding to an integrated luminosity of 36.1 fb−1. No significant excess over the Standard Model expectation is seen and upper limits on the production cross-section of a vector-like T quark pair as a function of the T quark mass are derived. The observed (expected) 95% CL lower limits on the T mass are 870 GeV (890 GeV) for the weak-isospin singlet model, 1.05 TeV (1.06 TeV) for the weak-isospin doublet model and 1.16 TeV (1.17 TeV) for the pure Zt decay mode. Limits are also set on the mass as a function of the decay branching ratios, excluding large parts of the parameter space for masses below 1 TeV.
c
2017 CERN for the benefit of the ATLAS Collaboration.
Reproduction of this article or parts of it is allowed as specified in the CC-BY-4.0 license.
1 Introduction
A number of theories beyond the Standard Model (SM) of particle physics address the naturalness prob-lem [1] and offer mechanisms through which the quadratic divergences, which arise from the radiative corrections to the Higgs boson mass, are resolved. A straightforward extension of the SM is the in-clusion of a heavy fourth generation. However, fourth-generation quarks with SM-like chiral couplings are excluded as they contribute through loops to the couplings of the Higgs boson, altering the Higgs boson production cross-sections to values incompatible with observation [2, 3]. These constraints on chiral quarks can be evaded by vector-like quarks (VLQs) [4,5], hypothetical spin-1/2 coloured particles whose left-handed and right-handed states have the same electroweak coupling. Vector-like quarks could dampen the unnaturally large quadratic corrections to the Higgs boson mass by contributing significantly to loop corrections. They appear mainly in the “Little Higgs” [6,7] and “Composite Higgs” [8] classes of models.
In this analysis, a vector-like top quark partner (T ) with a charge of Q = +2/3|e| is searched for. When
assuming couplings to only the third generation of quarks [9], as favoured by their large masses [10], the three possible decay modes are T → Zt, T → Ht, and T → Wb. For T quark masses above about 0.8 TeV the branching ratios converge to B (T → Wb) ' 50% and B (T → Zt) ' B (T → Ht) ' 25% for a weak-isospin singlet model and to B (T → Zt) ' B (T → Ht) ' 50% for a model with a weak-weak-isospin doublet of vector-like quarks. The doublet prediction is valid for a (X5/3, T ) doublet, where the superscript refers to the charge of the particle, as well as for a (T, B−1/3) doublet, as long as the generalised CKM (Cabibbo-Kobayashi-Maskawa) matrix elements fulfil |VT b| |VBt| [9, 11]. In addition to these two models, the
case of arbitrary branching ratios of the three possible decay modes is considered.
T
¯
T
g
g
Z, H, W
t, t, b
Z, H, W
¯
t, ¯
t, ¯
b
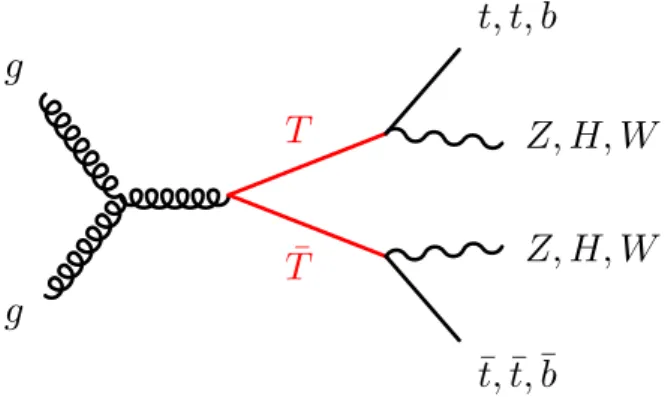
Figure 1: Representative diagram for the production and decay of a vector-like top quark pair.
Vector-like top (VLT) quarks could be produced singly or in pairs at the CERN Large Hadron Collider (LHC) [12]. This analysis targets the pair production pp → T ¯T channel, as shown in Figure 1. The production cross-section is predicted to be 0.044 ± 0.005 pb for a T quark mass of 1 TeV, calculated at leading order (NNLO) in quantum chromodynamics (QCD) including next-to-next-to-leading logarithmic (NNLL) soft-gluon resummation using Top++ 2.0 [13–18]. Previous searches for pair-produced vector-like T quarks by the ATLAS and CMS collaborations at centre-of-mass energies of 8 TeV [19–22] and 13 TeV [23] set lower limits on the VLT mass in the range of 550–900 GeV, at the 95% confidence level (CL), depending on the branching ratio considered.
This analysis focuses on the channel T ¯T → Zt+ X, where the Z boson decays into a neutrino pair and ex-actly one charged lepton is produced in either the top quark decay or from the other leg of the VLT pair
cay. This channel gives rise to a final state with one lepton, multiple jets and a high missing transverse mo-mentum (EmissT ) mainly due to the invisibly decaying Z boson. A single-bin signal region (SR) is defined by an event selection that maximises the sensitivity to this particular channel. Control regions (CRs) and validation regions (VRs) are defined that are enriched in the various background processes. They are or-thogonal to the SR and oror-thogonal to each other. The statistical interpretation is based on a simultaneous fit to the CRs and the SR, in which the background normalisations and a possible signal contribution are determined, while taking into account the experimental and theoretical systematic uncertainties.
2 ATLAS detector and data sample
The ATLAS detector [24] is a multi-purpose particle detector at the LHC with nearly 4π coverage around the collision point.1 Closest to the beam is the inner detector (ID), which provides charged-particle track-ing in the range |η| < 2.5. Durtrack-ing the LHC shutdown between Run 1 and Run 2, a new innermost layer of silicon pixels was added, which improves the track impact parameter resolution and vertex position resolution performance [25, 26]. The ID is surrounded by a superconducting solenoid providing a 2 T axial magnetic field, followed by an electromagnetic lead/liquid-argon (LAr) sampling calorimeter and a hadronic (steel/scintillator-tile) calorimeter. The endcap and forward regions are instrumented with LAr calorimeters for both the electromagnetic and hadronic energy measurements up to |η| = 4.9. The outer part of the detector consists of a muon spectrometer (MS) with high-precision tracking chambers for coverage up to |η|= 2.7, fast detectors for triggering over |η| < 2.4, and three large superconducting toroidal magnets with eight coils each. Events are selected by a two-level trigger system consisting of a hardware-based trigger for the first level and a software-based system for the second level [27].
The data used in this analysis were recorded in 2015 and 2016, corresponding to an integrated lumin-osity of 36.1 fb−1in total, with an uncertainty of 3.2%, derived following a methodology similar to that in Ref. [28]. The data were collected using triggers that select events with high missing transverse mo-mentum, with online thresholds of 70 GeV in 2015 and 90 GeV to 110 GeV in 2016. The triggers have an efficiency greater than 99% for an offline Emiss
T requirement of at least 300 GeV.
3 Signal modelling and Monte Carlo simulation
Monte Carlo (MC) simulated events are used for the description of the backgrounds and to model the VLT signals. Signal samples are generated at leading order (LO) with Protos v2.2 [9,11], interfaced with Py-thia 8.186 [29] for the parton shower (PS) and hadronisation. The samples are produced assuming vector-like T quark couplings according to the weak-isospin singlet model, but with equal branching ratios into each of the three decay modes (Zt, Ht, Wb). Desired branching ratios are obtained by reweighting the samples based on generator information. To test potential kinematic biases from the assumed couplings, a comparison to a sample in which the T quark is in a weak-isospin doublet was carried out. For a T quark mass of 950 GeV a relative acceptance increase of 10% is observed in the doublet case. This effect is neglected in the analysis and results in slightly more conservative limits for the doublet model.
1 ATLAS uses a right-handed coordinate system with its origin at the nominal interaction point (IP) in the centre of the
detector and the z-axis along the beam pipe. The x-axis points from the IP to the centre of the LHC ring, and the y-axis points upward. Cylindrical coordinates (r,φ) are used in the transverse plane, φ being the azimuthal angle around the beam pipe. The pseudorapidity is defined in terms of the polar angle θ as η= − ln tan(θ/2). Angular distance is measured in units of ∆R = p(∆η)2+ (∆φ)2.
For the background samples, several matrix element event generators are combined with parton shower and hadronisation programs. Powheg-Box v2 [30–33] interfaced to Pythia v6.428 [34] is used to simulate t¯tproduction as well as single-top production in association with a W boson, while electroweak t-channel single-top quark events are generated using the Powheg-Box v1 generator. Events containing W bosons with associated jets (W+jets) are simulated using the Sherpa v2.2.0 event generator [35–37], while for diboson events Sherpa v2.1.1 is used. For the simulation of t¯t events with additional vector bosons (t¯t+V) the MadGraph5_aMC@NLO v2.3.2 [38] event generator interfaced with Pythia 8 is used.
All MC samples are normalised using the highest-order inclusive cross-sections available at √s= 13 TeV. The dominant backgrounds t¯t and W+jets are available at NNLO in QCD [13,39]. The parton distribution function (PDF) sets used are CT10 [40] for the Powheg-Box and Sherpa v2.1.1 generators, NNPDF 3.0 NNLO [41] for Sherpa v2.2.0, and NNPDF 2.3 LO [42] for Protos and MadGraph5_aMC@NLO.
The samples produced with Protos, MadGraph5_aMC@NLO and Powheg-Box use EvtGen v1.2.0 [43]
for the modelling of b-hadron decays. All simulated samples are processed with the full simulation of the ATLAS detector [44] using Geant 4 [45], and with varying numbers of simulated minimum-bias interactions generated with Pythia 8 overlaid on the hard-scattering event to account for the multiple pp interactions in the same or nearby bunch crossings (pile-up). The average number of interactions per bunch crossing in simulation matches the distribution in data. Additional details of the simulation set-up can be found in Refs. [46–49].
4 Event reconstruction and object selection
Events are required to have at least one vertex candidate with at least two tracks with pT > 500 MeV. The
primary vertex is taken to be the vertex candidate with the largest sum of squared transverse momenta of all associated tracks. Two sets of quality and kinematic requirements are imposed on physics objects in this analysis, labelled baseline and signal requirements, where the latter label describes a tighter selection than the former.
Electron candidates are reconstructed from cell clusters in the electromagnetic calorimeter which are matched to ID tracks. Baseline electrons are required to have pT > 7 GeV, |η| < 2.47, and satisfy
‘VeryLoose’ likelihood identification criteria, defined following the methodology described in Ref. [50]. Signal electrons must pass all baseline requirements, have pT > 28 GeV, and satisfy the ‘Tight’ likelihood
identification criteria [50]. In addition, the distance of closest approach to the beam in the transverse plane (d0) and the longitudinal distance of this point to the primary vertex along the beam direction
(z0) are required to satisfy |z0sin θ| < 0.5 mm and |d0|/σd0 < 5, where σd0 is the uncertainty in d0.
Furthermore, signal electrons must be isolated, requiring that the scalar pT sum of all tracks in a cone of
size∆R < 10 GeV/peT around the electron momentum, with a maximum cone size of 0.2, is lower than 6% of the electron pT.
Muon candidates are reconstructed from combined tracks that are formed from ID and MS tracks, ID tracks matched to MS track segments, standalone MS tracks, or ID tracks matched to a calorimeter energy deposit compatible with a minimum-ionising particle (referred to as calo-tagged muons) [51]. Baseline muons are required to have pT > 6 GeV, |η| < 2.7, and satisfy the ‘Loose’ identification criteria [51].
Signal muons must satisfy the ‘Medium’ identification criteria, are required to have pT > 28 GeV, and
impact parameters |z0sin θ| < 0.5 mm and |d0|/σd0 < 3. In addition, they must be isolated, requiring that
the scalar pT sum of all tracks in a cone of size∆R < 10 GeV/pµT around the muon momentum, with a
maximum cone size of 0.3, is lower than 6% of the muon pT.
Jet candidates are reconstructed from topological clusters [52, 53], built from energy deposits in the calorimeters calibrated to the electromagnetic scale, using the anti-kt algorithm with radius parameter
R = 0.4 [54]. Baseline (signal) jets are required to have pT > 20 GeV (pT > 25 GeV) and |η| < 4.4
(|η| < 2.5). To reject jets originating from pile-up collisions, signal jets with pT < 60 GeV and |η| < 2.4
are required to satisfy jet vertex tagger criteria [55]. In order to suppress detector noise and non-collision backgrounds [56], 0.3% of the events are vetoed as a baseline jet in an event does not pass the ‘Loose’ jet quality requirements of Ref. [57]. A b-tagging algorithm based on multivariate techniques is used to identify jets containing b-hadrons, so-called b-jets [58,59]. The working point used provides an average tagging efficiency of 77% for b-jets in simulated t¯t events, as well as a rejection factor of about 130 for light-quark flavour (u, d, s) and gluon jets and about 6 for charm jets.
Jets and associated tracks are also used to identify hadronically decaying τ leptons using the ‘Loose’ identification criteria described in Ref. [60]. The τ candidates are required to have one or three associated tracks, with total electric charge opposite to that of the selected electron or muon, pT > 20 GeV, and
|η| < 2.5.
The missing transverse momentum is reconstructed from the negative vector sum of the transverse mo-menta of baseline electrons, muons, jets, and a soft-term built from high-quality tracks that are associated with the primary vertex but not with the baseline physics objects [61,62].
Energy deposits reconstructed as two different particle candidates are resolved by removing one of the candidates according to the following procedure:
1. Electron/jet: if a baseline electron and a baseline jet are found within ∆R < 0.2 the overlapping jet is removed.
2. Muon/jet: if a baseline muon overlaps with a baseline jet within ∆R < 0.4 the overlapping jet is removed if the jet has fewer than three tracks with pT> 500 MeV.
3. Jet/lepton:
• If a jet that passes the previous steps overlaps with a muon in a cone of size ∆R = 0.04 + 10 GeV/pµT, up to a maximum size of 0.4, the muon is removed.
• If a jet that passes the previous steps overlaps with an electron in a cone of size∆R = 0.4, the electron is removed.
4. Electron/τ: if an electron that passes the previous steps overlaps with a τ candidate in a cone of size ∆R = 0.1, the τ is removed.
Large-radius jets are constructed from signal jets using the anti-kt algorithm with R = 1.0. Constituent
small-radius jets with pT less than 5% of the large-radius jet pT are removed, mainly in order to reduce
the impact of soft radiation.
5 Event selection and background estimation
Events are required to have exactly one signal lepton (L=e, µ), at least four signal jets and EmissT >300 GeV. A veto on events with a second lepton, fulfilling the baseline requirements, is used to suppress t¯t events with two leptons in the final state (dileptonic t¯t). Further event selection is performed using objects fulfilling the signal requirements described in the previous section. The azimuthal angles between the
missing transverse momentum vector ~ETmissand both the leading ( j1) and sub-leading ( j2) jets, ordered in
pT, must satisfy the condition |∆φ( ji, ~EmissT )| > 0.4 with i ∈ {1, 2}, which rejects events with EmissT arising
from mismeasured jets. In addition, at least one b-tagged jet is required.
After applying these requirements, the dominant backgrounds are single-lepton plus jets (1L) t¯t events, where the lepton originates either directly from the W decay or from a subsequent τ decay, and W+jets production. This can be seen in Figure2, which shows a comparison of data and SM expectation as a function of ETmissand mW
T at the so-called preselection level as defined in Table1. Here m W
T is defined
as the transverse mass2of the signal lepton and the missing transverse momentum. Requiring mWT to be well above the W boson mass strongly reduces 1L t¯t events and W+jets production as can be seen from the right panel of Figure2. The remaining events at large mWT are mostly from t¯t production where both Wbosons decay leptonically. The two cases of either two leptons (2L) and one lepton and a hadronically decaying τ (1L 1τ) are shown separately.
[GeV] miss T E 300 400 500 600 700 800 900 1000 Data/Pred. 0.5 1 1.5 [GeV] miss T E Events / 20 GeV 1 10 2 10 3 10 4 10 Data Total pred. 2L t t τ 1L1 t t 1L t t Single top W+jets Diboson +V t t ATLAS -1 = 13 TeV, 36.1 fb s Preselection [GeV] W T m 100 200 300 400 500 Data/Pred. 0.5 1 1.5 [GeV] W T m Events / 20 GeV 10 2 10 3 10 4 10 Data Total pred. 2L t t τ 1L1 t t 1L t t Single top W+jets Diboson +V t t ATLAS -1 = 13 TeV, 36.1 fb s Preselection
Figure 2: Comparison of data and prediction in the Emiss
T distribution (left) and the m W
T distribution (right) after the
preselection. The lower panels show the ratio of the data to the prediction. The error bands include statistical and systematic uncertainties. The last bin contains the overflow events.
Additional variables are used to reduce these dileptonic t¯t backgrounds. The mT2variable [63] is a
gener-alisation of the transverse mass applied to signatures where two or more particles are not directly detec-ted [64,65], defined as
mT2 ≡ min
~qTa+~qTb= ~ETmiss
{max(mTa, mTb)} .
In this formula, mTa and mTb are transverse masses calculated using two sets of one or more visible
particles, denoted a and b, respectively, and all possible combinations of missing transverse momenta ~qTa and ~qTb, with ~qTa+ ~qTb = ~EmissT . This analysis uses two specific choices for the sets of visible particles
aand b, and the corresponding variables are referred to as amT2 and mτT2. The amT2 variable is used to
2The transverse mass mW
T is defined as m W T =
q
2plepT Emiss
T [1 − cos(∆φ)], where ∆φ is the azimuthal angle between the lepton
and the missing transverse momentum direction and plepT is the transverse momentum of the charged lepton.
suppress dileptonic t¯t events where one lepton goes undetected. Thus, the sets of visible particles for the amT2are combinations of the identified lepton and the two jets with the highest b-tagging weights, where
the lepton is combined with either jet and the combination with the lowest resulting amT2 is taken. For
dileptonic t¯t events amT2 has a kinematic endpoint at the top quark mass but is expected to extend much
higher for processes with additional sources of EmissT . The mτT2 variable targets t¯t events where one of the W bosons decays via a hadronically decaying τ. It is only constructed in events where a hadronically decaying τ candidate is found. The τ candidate and the signal lepton are used as the two visible particles. For these events, mτT2is required to be greater than 80 GeV as it has a kinematic endpoint at the W boson mass for t¯t events. If fulfilled, the τ candidate is no longer used and instead the jet candidate, from which the τ is identified, is considered for the rest of the computations.
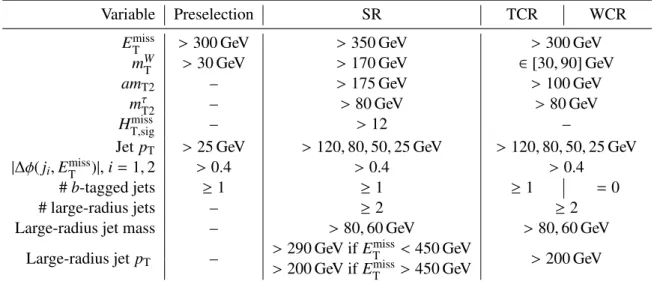
Table 1: Overview of the event selections for the signal region (SR) and the background control regions for t¯t (TCR) and W+jets (WCR) processes. For jet pTand large-radius jet masses the numbers refer to the objects ordered in pT.
Variable Preselection SR TCR WCR
EmissT > 300 GeV > 350 GeV > 300 GeV
mWT > 30 GeV > 170 GeV ∈ [30, 90] GeV
amT2 – > 175 GeV > 100 GeV
mτT2 – > 80 GeV > 80 GeV
HT,sigmiss – > 12 –
Jet pT > 25 GeV > 120, 80, 50, 25 GeV > 120, 80, 50, 25 GeV
|∆φ( ji, EmissT )|, i= 1, 2 > 0.4 > 0.4 > 0.4
# b-tagged jets ≥ 1 ≥ 1 ≥ 1 = 0
# large-radius jets – ≥ 2 ≥ 2
Large-radius jet mass – > 80, 60 GeV > 80, 60 GeV
Large-radius jet pT –
> 290 GeV if Emiss
T < 450 GeV > 200 GeV
> 200 GeV if Emiss
T > 450 GeV
The HT,sigmiss [66] variable is used to reduce the number of events with mis-reconstructed EmissT . It is defined as HT,sigmiss ≡ (HTmiss− 100 GeV)/σHmiss
T , where the exact value of the constant has no impact on this analysis
and was optimised for the search mentioned above [67]. Here HTmiss is the magnitude of the vectorial sum of the signal lepton and jets transverse momenta and σHmiss
T is the approximate resolution of H
miss
T ,
computed using the per-event jet energy resolution [68].
5.1 Signal region selection
The signal region selection is optimised to target a benchmark signal with a T quark mass of 1 TeV, a branching ratio for the T → Zt decay of 80%, and equal branching ratios for the other two decay modes (T → Ht, T → Wb). This benchmark signal was chosen due to its mass being at the expected sensitivity reach of this analysis, and its high branching ratio into the required Zt decay mode, while at the same time allowing for decays into other final states. A summary of the SR selection is given in Table1. Due to the invisible decay of the Z boson, a high-EmissT requirement of at least 350 GeV is set. As discussed above, the mWT and amT2 variables are used to reduce the t¯t and W+jets backgrounds. The properties of
large-radius jets are used to exploit the structure of the high-mass VLT decay. At least two large-radius jets with high pT and large mass are required. These target a hadronically decaying top quark, or the
subsequent hadronic W boson decay, as well as a second, hadronically decaying massive boson. At very high EmissT the backgrounds are sufficiently reduced to allow looser requirements on the large-radius jet pT. For the benchmark signal, 13.4 ± 0.5 events are expected in the SR, with 95% of them containing an invisibly decaying Z boson. This number decreases to 75% for the singlet model with a T quark mass of 1 TeV, where B (T → Zt) ' 25%. The efficiency of the full event selection for the benchmark signal is 1%, taking all decay modes into account. For events with Z → ν¯ν and one leptonically decaying W boson from a top quark decay, the selection efficiency is about 10%.
5.2 Background estimation
The dominant background in the SR is due to t¯t production, followed by about equal contributions from W+jets and single-top production. In order to derive the normalisation of the t¯t and W+jets processes from data, dedicated control regions are defined and referred to as TCR and WCR, respectively. The back-ground normalisation and a possible signal contribution are determined simultaneously in a maximum-likelihood fit to the event yields in the signal region and the control regions.
The CRs are defined by modifying the requirement on mWT to a window around the W boson mass, ensuring orthogonality between the CRs and the SR. Requirements on ETmiss, amT2, HT,sigmiss and the large-R
jet pT are loosened in order to increase the statistical power of the CRs. In the W+jets control region,
a veto on b-tagged jets is used to enrich the W+jets contribution and make the selection orthogonal to the t¯t control region. Table1 details the CR selection in comparison to the SR requirements. The normalisation factors, obtained in a fit to the control regions, for t¯t and W+jets are µt¯t= 1.05 ± 0.17 and
µW+jets = 0.70 ± 0.10, where the error includes both the statistical and systematic uncertainties. Applying
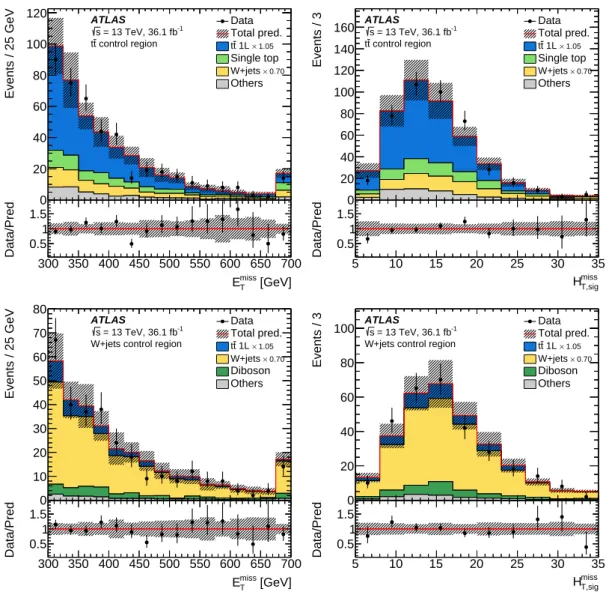
these normalisation factors, a comparison of data and simulation in the EmissT and HT,sigmiss distributions is shown in both CRs in Figure3. The normalisation factors, in particular the one for W+jets, are tested further as described in Section5.3and Section6.
The single-top background is taken from simulation. Additional backgrounds considered in the analysis are diboson production as well as t¯t production in association with a vector boson. These backgrounds make a small contribution to the SR and are also taken from simulation. Rare backgrounds, such as the associated production of t¯t with a Higgs boson, contribute less than 1% to the total expected background in the SR and are not considered further. The contribution of multi-jet events is negligible after the requirements on ETmissand |∆φ( ji, ~ETmiss)|.
5.3 Background validation
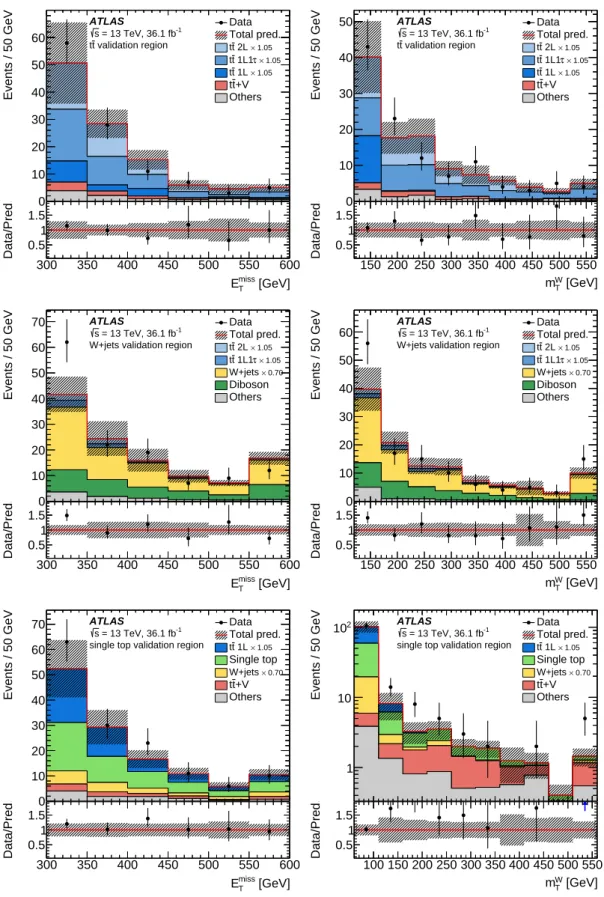
The background estimates are tested in validation regions, which are not included in the maximum-likelihood fit. The background normalisation factors determined in the CRs are applied in the VRs. All VRs are defined by requiring exactly one large-radius jet, to ensure orthogonality with the event selection defining the signal and control regions. Furthermore, some SR requirements are relaxed in order to increase the statistical power. Three VRs are defined, for the t¯t, single-top and W+jets processes. The definitions are summarised in Table2. No indication of mismodelling is observed in any of the VRs. For example, the EmissT and mWT distributions are shown in Figure4.
[GeV] miss T E 300 350 400 450 500 550 600 650 700 Data/Pred. 0.5 1 1.5 [GeV] miss T E Events / 25 GeV 0 20 40 60 80 100 120 Data Total pred. 1.05 × 1L t t Single top 0.70 × W+jets Others ATLAS -1 = 13 TeV, 36.1 fb s control region t t miss T,sig H 5 10 15 20 25 30 35 Data/Pred. 0.5 1 1.5 miss T,sig H Events / 3 0 20 40 60 80 100 120 140
160 DataTotal pred.
1.05 × 1L t t Single top 0.70 × W+jets Others ATLAS -1 = 13 TeV, 36.1 fb s control region t t [GeV] miss T E 300 350 400 450 500 550 600 650 700 Data/Pred. 0.5 1 1.5 [GeV] miss T E Events / 25 GeV 0 10 20 30 40 50 60 70 80 Data Total pred. 1.05 × 1L t t 0.70 × W+jets Diboson Others ATLAS -1 = 13 TeV, 36.1 fb s
W+jets control region
miss T,sig H 5 10 15 20 25 30 35 Data/Pred. 0.5 1 1.5 miss T,sig H Events / 3 0 20 40 60 80
100 DataTotal pred.
1.05 × 1L t t 0.70 × W+jets Diboson Others ATLAS -1 = 13 TeV, 36.1 fb s
W+jets control region
Figure 3: Comparison of data and prediction in the Emiss
T distribution (left) and the H miss
T,sigdistribution (right) in the
t¯t(top) and the W+jets control regions (bottom). The t¯t and W+jets normalisation factors are applied as indicated in the legend. The lower panels show the ratio of the data to the prediction. The error bands include statistical and systematic uncertainties. The last bin contains the overflow events. For the Hmiss
T,sig distributions the first bin also
contains underflow events.
6 Systematic uncertainties
Systematic uncertainties from experimental sources and from the theoretical predictions affect the signal and background estimates. They are included as nuisance parameters with Gaussian constraints and are profiled in the likelihood fits that determine the background normalisation factors and the possible signal contribution. The uncertainties are not constrained further in the fits as the analysis has as many bins as free parameters. The uncertainties in the t¯t and W+jets backgrounds in the SR result from the relative difference of each systematic source in the SR to the respective CR due to the normalisation in the fit. In general the systematic uncertainties are smaller than the statistical uncertainties.
[GeV] miss T E 300 350 400 450 500 550 600 Data/Pred. 0.5 1 1.5 [GeV] miss T E Events / 50 GeV 0 10 20 30 40 50 60 Data Total pred. 1.05 × 2L t t 1.05 × τ 1L1 t t 1.05 × 1L t t +V t t Others ATLAS -1 = 13 TeV, 36.1 fb s validation region t t [GeV] W T m 150 200 250 300 350 400 450 500 550 Data/Pred. 0.5 1 1.5 [GeV] W T m Events / 50 GeV 0 10 20 30 40 50 Data Total pred. 1.05 × 2L t t 1.05 × τ 1L1 t t 1.05 × 1L t t +V t t Others ATLAS -1 = 13 TeV, 36.1 fb s validation region t t [GeV] miss T E 300 350 400 450 500 550 600 Data/Pred. 0.5 1 1.5 [GeV] miss T E Events / 50 GeV 0 10 20 30 40 50 60 70 Data Total pred. 1.05 × 2L t t 1.05 × τ 1L1 t t 0.70 × W+jets Diboson Others ATLAS -1 = 13 TeV, 36.1 fb s
W+jets validation region
[GeV] W T m 150 200 250 300 350 400 450 500 550 Data/Pred. 0.5 1 1.5 [GeV] W T m Events / 50 GeV 0 10 20 30 40 50
60 DataTotal pred.
1.05 × 2L t t 1.05 × τ 1L1 t t 0.70 × W+jets Diboson Others ATLAS -1 = 13 TeV, 36.1 fb s
W+jets validation region
[GeV] miss T E 300 350 400 450 500 550 600 Data/Pred. 0.5 1 1.5 [GeV] miss T E Events / 50 GeV 0 10 20 30 40 50 60 70 Data Total pred. 1.05 × 1L t t Single top 0.70 × W+jets +V t t Others ATLAS -1 = 13 TeV, 36.1 fb s
single top validation region
[GeV] W T m 100 150 200 250 300 350 400 450 500 550 Data/Pred. 0.5 1 1.5 [GeV] W T m Events / 50 GeV 1 10 2 10 Data Total pred. 1.05 × 1L t t Single top 0.70 × W+jets +V t t Others ATLAS -1 = 13 TeV, 36.1 fb s
single top validation region
Figure 4: Comparison of data and prediction in the Emiss
T distribution (left) and the m W
T distribution (right) in the
t¯t(top), W+jets (middle) and single-top validation regions (bottom). The t¯t and W+jets normalisation factors are applied as indicated in the legend. The lower panels show the ratio of the data to the prediction. The error bands include statistical and systematic uncertainties. The last bin contains the overflow events.
Table 2: Overview of the event selections for the t¯t (TVR), W+jets (WVR) and single-top (STVR) validation regions, compared to the signal region. For jet pT and large-radius jet masses the numbers refer to the objects
ordered in pT.
Variable Signal Region TVR WVR STVR
EmissT > 350 GeV > 300 GeV
mWT > 170 GeV > 120 GeV > 60 GeV
amT2 > 175 GeV ∈ [100, 200] GeV > 100 GeV > 200 GeV
mτT2 > 80 GeV > 80 GeV
HmissT,sig > 12 –
Jet pT > 120, 80, 50, 25 GeV > 120, 80, 50, 25 GeV
|∆φ( ji, EmissT )|, i= 1, 2 > 0.4 > 0.4
# b-tagged jets ≥ 1 ≥ 1 = 0 ≥ 2
# large-radius jets ≥ 2 = 1
Large-radius jet mass > 80, 60 GeV > 80 GeV
Large-radius jet pT
> 290 GeV if Emiss
T < 450 GeV > 200 GeV
> 200 GeV if Emiss
T > 450 GeV
Dominant experimental uncertainties come from imperfect knowledge of the scale and resolution of both jet energies and masses as well as the modelling of the b-tagging efficiency for b-jets, c-jets and light-flavour jets. The jet energy scale uncertainty is split into three components [69]. The relative uncertainty in the estimated background yields in the SR from these sources is 1%–5%. In addition, the uncertainty in the mass scale and the resolution of the small-radius jets is considered. It has a small effect on the background, but affects the signal because hadronically decaying Z and W bosons can be reconstructed as a single small-radius jet. Additional small experimental uncertainties are due to the scale and resolution of the ETmiss soft-term, which captures all tracks not associated with calibrated objects in the event, the modelling of lepton-related quantities, the trigger efficiency, as well as the uncertainty in the integrated luminosity and the pile-up profile.
The uncertainties in the modelling of the t¯t background come from the choice of MC event generator, the hadronisation and fragmentation modelling, and the amount of initial- and final-state radiation. The MC generator uncertainty is estimated by comparing events produced with Powheg-Box and with Mad-Graph5_aMC@NLO, both in conjunction with Herwig++ [70], and is the dominant uncertainty in the t¯t modelling, amounting to an uncertainty of 17% in the total background yield in the SR. The hadronisation and fragmentation uncertainty is about 13%, assessed by comparing events generated with Powheg-Box and hadronised with either Pythia or Herwig++. Powheg-Box–Pythia samples with different parton-shower radiation settings, different settings of QCD radiation at NLO accuracy, and factorisation and renormalisation scales varied by factors of 0.5 and 2 [48] yield an uncertainty of 11%.
The uncertainty in the modelling of the W+jets process is estimated by comparing the nominal simulation to a MadGraph5_aMC@NLO simulation. In addition, the effects of independently varying the scales for the renormalisation, factorisation, and resummation by factors of 0.5 and 2 are taken into account. Also, the scale of the matching scheme related to the merging of matrix elements and parton showers is varied between 15 GeV and 30 GeV. Since the W+jets background is normalised in a CR with a veto on b-tagged jets, additional uncertainties of about 30% in the flavour composition of the W+jets events are applied in all regions requiring at least one b-tagged jet. These uncertainties are based on the measurement reported
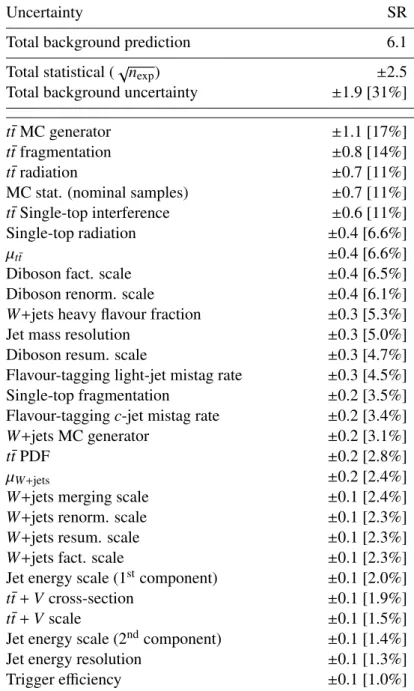
Table 3: Breakdown of the leading systematic uncertainties in the total background prediction in the signal region. The statistical precision is included in uncertainties derived from the comparison of MC samples. The individual uncertainties are correlated, and do not necessarily add in quadrature to the total background uncertainty.
Uncertainty SR
Total background prediction 6.1
Total statistical (√nexp) ±2.5
Total background uncertainty ±1.9 [31%]
t¯tMC generator ±1.1 [17%]
t¯tfragmentation ±0.8 [14%]
t¯tradiation ±0.7 [11%]
MC stat. (nominal samples) ±0.7 [11%]
t¯tSingle-top interference ±0.6 [11%]
Single-top radiation ±0.4 [6.6%]
µt¯t ±0.4 [6.6%]
Diboson fact. scale ±0.4 [6.5%]
Diboson renorm. scale ±0.4 [6.1%]
W+jets heavy flavour fraction ±0.3 [5.3%]
Jet mass resolution ±0.3 [5.0%]
Diboson resum. scale ±0.3 [4.7%]
Flavour-tagging light-jet mistag rate ±0.3 [4.5%]
Single-top fragmentation ±0.2 [3.5%]
Flavour-tagging c-jet mistag rate ±0.2 [3.4%]
W+jets MC generator ±0.2 [3.1%]
t¯tPDF ±0.2 [2.8%]
µW+jets ±0.2 [2.4%]
W+jets merging scale ±0.1 [2.4%]
W+jets renorm. scale ±0.1 [2.3%]
W+jets resum. scale ±0.1 [2.3%]
W+jets fact. scale ±0.1 [2.3%]
Jet energy scale (1stcomponent) ±0.1 [2.0%]
t¯t+ V cross-section ±0.1 [1.9%]
t¯t+ V scale ±0.1 [1.5%]
Jet energy scale (2ndcomponent) ±0.1 [1.4%]
Jet energy resolution ±0.1 [1.3%]
Trigger efficiency ±0.1 [1.0%]
in Ref. [71], extrapolated to higher jet multiplicities. As a further check, a region with at least one b-tagged jet is defined, which is enriched in, though not dominated by, the W+jets contribution. Good agreement between data and SM expectation is found when applying the normalisation factors obtained in the CRs. The total uncertainty in the W+jets modelling in the SR is about 40%, resulting in a 6% uncertainty in the total background estimate.
The dominant uncertainty in the single-top processes stems from the modelling of the interference between the t¯t and Wt processes at NLO, leading to an uncertainty of 11% in the total background yield in the SR. The uncertainty is estimated using inclusive WWbb events, generated using MadGraph at LO, which are compared with the sum of the t¯t and Wt processes. To account for the different orders in αS, the number
of events in the inclusive WWbb sample is scaled to the sum of the t¯t and Wt events after an event selec-tion requiring only EmissT > 200 GeV, four jets and exactly one lepton. Uncertainties from the MC event generator, the hadronisation and fragmentation modelling, and the amount of initial- and final-state radi-ation are estimated in the same way as for t¯t. Additionally, an uncertainty of 5.3% [72] in the single-top cross-section is taken into account, amounting to an uncertainty of less than 1% in the total background yield in the SR.
Since the diboson and t¯t+ V backgrounds are not normalised in control regions, the analysis is sensitive to their respective cross-section uncertainties. Additionally, the effects of varying the renormalisation, factorisation and resummation scales are taken into account. These uncertainties have a negligible impact on the final results.
The effect of PDF uncertainties on the acceptance for the signal and the t¯t background is included but found to be negligible. A breakdown of the leading systematic uncertainties is summarised in Table3.
7 Results
The number of events observed in the SR, CRs and the VRs is shown in Table4, together with the back-grounds estimated in the simultaneous fit. The results are also summarised in the left panel of Figure5. Good agreement of data and simulation is observed in the VRs. No significant excess above the SM background is found in the SR. The EmissT distribution in the SR for data and SM expectation is presented in the right panel of Figure5, where the additional contribution from a T quark signal with a mass of 1.1 TeV is shown. For this particular choice of signal, an additional nine events would be expected. The largest signal contribution is expected at about half the T mass.
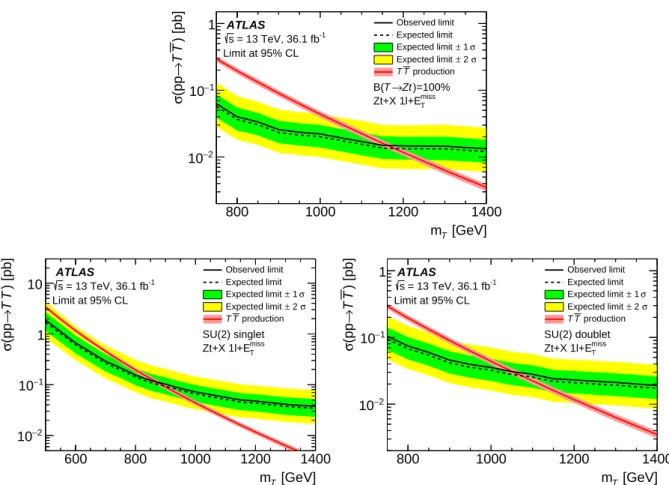
Upper limits on the signal cross-section as a function of the VLT mass are derived at 95% CL using profile-likelihood ratio tests following the CLsprescription [73–75]. They are calculated for the
weak-isospin singlet and doublet models, which feature mass-dependent branching ratios [4], as well as for pure T → Ztdecays, using MC samples generated for 15 different VLT masses between 500 GeV and 1.4 TeV. The contribution from additional vector-like quarks, in particular from the X or B quark in the (X5/3, T ) or (T, B) doublets, is neglected. This results in conservative limits in the case of the doublet model, where the X or B quarks are expected to always decay to a Wt final state [9], leading to about 50% more events in the SR for the case of a T quark mass of 1 TeV and a second X or B quark with the same mass. The additional contribution in the TCR is less than 10%.
The cross-section times branching ratio limits as a function of mass are shown in Figure6for the pure T → Ztdecay, as well as for the singlet and doublet cases. Comparing the cross-section limits to the theoretical expectation, lower limits on the T quark mass can be derived. The limits are summarised in
Table 4: Number of events observed in the signal, control and validation regions, together with the estimated SM backgrounds. The normalisation factors determined in the simultaneous fit are applied. The uncertainties include all statistical and systematic sources. The individual uncertainties are correlated, and do not necessarily add in quadrature to the total background uncertainty.
Region SR TCR WCR TVR WVR STVR
Observed events 7 437 303 112 131 143
Fitted bkg events 6.1 ± 1.9 437 ± 21 303 ± 17 109 ± 35 127 ± 31 125 ± 27
Fitted t¯t events 2.5 ± 1.7 280 ± 40 38 ± 15 90 ± 40 15 ± 8 53 ± 23
Fitted W+ jets events 1.1 ± 0.7 70 ± 28 224 ± 27 3.5 ± 2.0 77 ± 30 15 ± 7
Fitted singletop events 1.1 ± 0.7 63 ± 24 10 ± 5 4.2 ± 2.6 3.3+3.5−3.3 46 ± 17
Fitted t¯t+ V events 0.91 ± 0.20 9.7 ± 1.6 1.03 ± 0.30 7.0 ± 1.4 1.9 ± 0.7 8.3 ± 1.4
Fitted diboson events 0.6 ± 0.6 11 ± 5 30 ± 12 1.3 ± 1.3 31 ± 9 1.7 ± 1.1
MC exp. bkg events 6.5 450 398 106 160 129 TVR WVR STVR SR tot σ exp - n obs n −1 0 1 Events 0 20 40 60 80 100 120 140 160 180 200 220 1.05 × 2L t t 1.05 × τ 1L1 t t 1.05 × 1L t t 0.70 × W+jets Single top +V t t Diboson Data Total pred. 0 5 10 15 20 ATLAS -1 = 13 TeV, 36.1 fb s [GeV] miss T E 400 600 800 1000 1200 Events / 100 GeV 0 2 4 6 8
10 Data Total pred.
1.05 × 2L t t tt 1L1τ× 1.05 1.05 × 1L t t Single top 0.70 × W+jets Diboson +V t t )=(0.8,0.1,0.1) Zt,Ht,Wb B( =1.1 TeV T m ATLAS -1 = 13 TeV, 36.1 fb s Signal region
Figure 5: Left panel: Comparison of the observed data (nobs) with the predicted background (nexp) in the VRs and
SR. The bottom panel shows the significance of the difference between data and predicted background, where the significance is based on the total uncertainty (σtot). Right panel: Comparison of data and prediction in the ETmiss
distribution in the SR. The error bands include statistical and systematic uncertainties. The expected shape for a signal with mT = 1.1 TeV and B (T → Zt) = 80% is added on top of the SM prediction.
Table5. The sensitivity to the singlet model is lower due to the low B (T → Zt), which approaches 25% in the high-mass limit.
Figure 7 shows the 95% CL observed and expected lower limits on the signal mass as a function of the decay branching ratios. The highest sensitivity is found in the region of B (T → Zt) ' 100%. The sensitivity to the mixed ZtHt decay mode is larger than to the ZtWb decay mode. As an example, masses of mT < 1 TeV are excluded for B (T → Ht) < 65% (70% expected) in the former decay mode and for
B (T → Wb) < 45% (50% expected) in the latter.
[GeV] T m 800 1000 1200 1400 ) [pb] T T → (pp σ 2 − 10 1 − 10 1 Observed limit Expected limit σ 1 ± Expected limit σ 2 ± Expected limit production T T ATLAS -1 = 13 TeV, 36.1 fb s Limit at 95% CL )=100% Zt → T B( miss T Zt+X 1l+E [GeV] T m 600 800 1000 1200 1400 ) [pb] T T → (pp σ 2 − 10 1 − 10 1 10 Observed limit Expected limit σ 1 ± Expected limit σ 2 ± Expected limit production T T ATLAS -1 = 13 TeV, 36.1 fb s Limit at 95% CL SU(2) singlet miss T Zt+X 1l+E [GeV] T m 800 1000 1200 1400 ) [pb] T T → (pp σ 2 − 10 1 − 10 1 Observed limit Expected limit σ 1 ± Expected limit σ 2 ± Expected limit production T T ATLAS -1 = 13 TeV, 36.1 fb s Limit at 95% CL SU(2) doublet miss T Zt+X 1l+E
Figure 6: Observed and expected 95% CL upper limit on the cross-section times branching ratio for VLT pair production as a function of the T mass for B (T → Zt) = 100% (top) and for branching ratios according to the singlet model (bottom left) and the doublet model (bottom right). Contributions from the X or B quark in the (X5/3, T ) or (T, B) doublet models are neglected, leading to conservative limits. The thickness of the theory curve
represents the theoretical uncertainty from PDFs, scale and the strong coupling constant αS.
Table 5: Observed and expected 95% CL lower limits on the T quark mass for the pure T → Zt, the singlet model and the doublet model. Contributions from the X or B quark in the (X5/3, T ) or (T, B) doublet models are neglected, leading to conservative limits.
Signal Obs. 95% CL Exp. 95% CL
lower mass limit lower mass limit
T → Zt 1.16 TeV 1.17 TeV
Singlet 0.87 TeV 0.89 TeV
Doublet 1.05 TeV 1.06 TeV
Wb) → B(T 0 0.2 0.4 0.6 0.8 1 Ht) → B(T 0 0.2 0.4 0.6 0.8 1
Expected 95% CL mass limit [GeV]
500 600 700 800 900 1000 1100 1200 800 900 1000 1100 SU(2) singlet SU(2) doublet ATLAS -1 = 13 TeV, 36.1 fb s miss T Zt+X 1l+E Wb) → B(T 0 0.2 0.4 0.6 0.8 1 Ht) → B(T 0 0.2 0.4 0.6 0.8 1
Observed 95% CL mass limit [GeV]
500 600 700 800 900 1000 1100 1200 800 900 1000 1100 SU(2) singlet SU(2) doublet ATLAS -1 = 13 TeV, 36.1 fb s miss T Zt+X 1l+E
Figure 7: Expected (left) and observed (right) 95% CL lower limit on the T quark mass as a function of the decay branching ratios into Wb and Ht. The markers indicate the branching ratios in the singlet and doublet models for masses above about 0.8 TeV, where they are approximately independent of the T quark mass.
8 Conclusion
A search for the pair production of vector-like top quarks in final states with exactly one lepton, at least four jets and high missing transverse momentum is presented. The analysis follows a cut and count strategy, with a single-bin signal region and dedicated control regions for the t¯t and W+jets backgrounds. The search is based on 36.1 fb−1of √s= 13 TeV LHC pp collision data recorded by ATLAS in 2015 and 2016. No significant excess above the SM background is observed in the signal region and 95% CL limits are set on the vector-like top quark mass. For the singlet and doublet models, masses below 870 GeV (890 GeV expected) and 1.05 TeV (1.06 TeV expected), respectively, are excluded. For the pure Zt decay, lower limits are set on the mass at 1.16 TeV (1.17 TeV expected). Limits are also set on the mass as a function of the decay branching ratios, excluding large parts of the parameter space for masses below 1 TeV.
Acknowledgements
We thank CERN for the very successful operation of the LHC, as well as the support staff from our institutions without whom ATLAS could not be operated efficiently.
We acknowledge the support of ANPCyT, Argentina; YerPhI, Armenia; ARC, Australia; BMWFW and FWF, Austria; ANAS, Azerbaijan; SSTC, Belarus; CNPq and FAPESP, Brazil; NSERC, NRC and CFI, Canada; CERN; CONICYT, Chile; CAS, MOST and NSFC, China; COLCIENCIAS, Colombia; MSMT CR, MPO CR and VSC CR, Czech Republic; DNRF and DNSRC, Denmark; IN2P3-CNRS, CEA-DSM/IRFU, France; SRNSF, Georgia; BMBF, HGF, and MPG, Germany; GSRT, Greece; RGC, Hong Kong SAR, China; ISF, I-CORE and Benoziyo Center, Israel; INFN, Italy; MEXT and JSPS, Ja-pan; CNRST, Morocco; NWO, Netherlands; RCN, Norway; MNiSW and NCN, Poland; FCT, Portugal; MNE/IFA, Romania; MES of Russia and NRC KI, Russian Federation; JINR; MESTD, Serbia; MSSR, Slovakia; ARRS and MIZŠ, Slovenia; DST/NRF, South Africa; MINECO, Spain; SRC and Wallen-berg Foundation, Sweden; SERI, SNSF and Cantons of Bern and Geneva, Switzerland; MOST, Taiwan;
TAEK, Turkey; STFC, United Kingdom; DOE and NSF, United States of America. In addition, indi-vidual groups and members have received support from BCKDF, the Canada Council, CANARIE, CRC, Compute Canada, FQRNT, and the Ontario Innovation Trust, Canada; EPLANET, ERC, ERDF, FP7, Horizon 2020 and Marie Skłodowska-Curie Actions, European Union; Investissements d’Avenir Labex and Idex, ANR, Région Auvergne and Fondation Partager le Savoir, France; DFG and AvH Foundation, Germany; Herakleitos, Thales and Aristeia programmes co-financed by EU-ESF and the Greek NSRF; BSF, GIF and Minerva, Israel; BRF, Norway; CERCA Programme Generalitat de Catalunya, Generalitat Valenciana, Spain; the Royal Society and Leverhulme Trust, United Kingdom.
The crucial computing support from all WLCG partners is acknowledged gratefully, in particular from CERN, the ATLAS Tier-1 facilities at TRIUMF (Canada), NDGF (Denmark, Norway, Sweden), CC-IN2P3 (France), KIT/GridKA (Germany), INFN-CNAF (Italy), NL-T1 (Netherlands), PIC (Spain), ASGC (Taiwan), RAL (UK) and BNL (USA), the Tier-2 facilities worldwide and large non-WLCG resource pro-viders. Major contributors of computing resources are listed in Ref. [76].
References
[1] L. Susskind, Dynamics of Spontaneous Symmetry Breaking in the Weinberg-Salam Theory, Phys. Rev. D 20 (1979) 2619.
[2] A. Djouadi and A. Lenz, Sealing the fate of a fourth generation of fermions, Phys. Lett. B 715 (2012) 310, arXiv:1204.1252 [hep-ph].
[3] O. Eberhardt et al., Impact of a Higgs boson at a mass of 126 GeV on the standard model with three and four fermion generations,Phys. Rev. Lett. 109 (2012) 241802,
arXiv:1209.1101 [hep-ph].
[4] J. A. Aguilar-Saavedra, R. Benbrik, S. Heinemeyer and M. Pérez-Victoria,
Handbook of vectorlike quarks: Mixing and single production,Phys. Rev. D 88 (2013) 094010, arXiv:1306.0572 [hep-ph].
[5] L. Panizzi, Vector-like quarks: t0and partners,Nuovo Cim. C 037 (2014) 69. [6] N. Arkani-Hamed, A. G. Cohen and H. Georgi,
Electroweak symmetry breaking from dimensional deconstruction,Phys. Lett. B 513 (2001) 232, arXiv:hep-ph/0105239.
[7] M. Schmaltz and D. Tucker-Smith, Little Higgs review,Ann. Rev. Nucl. Part. Sci. 55 (2005) 229, arXiv:hep-ph/0502182.
[8] K. Agashe, R. Contino and A. Pomarol, The Minimal composite Higgs model, Nucl. Phys. B 719 (2005) 165, arXiv:hep-ph/0412089.
[9] J. A. Aguilar-Saavedra, Identifying top partners at LHC,JHEP 11 (2009) 030, arXiv:0907.3155 [hep-ph].
[10] F. del Aguila and M. J. Bowick, The possibility of new fermions with∆ I = 0 mass, Nucl. Phys. B 224 (1983) 107.
[11] J. A. Aguilar-Saavedra, ‘Protos - PROgram for TOp Simulations’,
url:https://jaguilar.web.cern.ch/jaguilar/protos/.
[12] L. Evans and P. Bryant, LHC Machine,JINST 3 (2008) S08001. [13] M. Czakon and A. Mitov,
Top++: A program for the calculation of the top-pair cross-section at hadron colliders, Comput. Phys. Commun. 185 (2014) 2930, arXiv:1112.5675 [hep-ph].
[14] M. Cacciari, M. Czakon, M. Mangano, A. Mitov and P. Nason, Top-pair production at hadron colliders with next-to-next-to-leading logarithmic soft-gluon resummation,
Phys. Lett. B 710 (2012) 612, arXiv:1111.5869 [hep-ph].
[15] P. Bärnreuther, M. Czakon and A. Mitov, Percent Level Precision Physics at the Tevatron: First Genuine NNLO QCD Corrections to q¯q → t¯t+ X,Phys. Rev. Lett. 109 (2012) 132001,
arXiv:1204.5201 [hep-ph].
[16] M. Czakon and A. Mitov, NNLO corrections to top-pair production at hadron colliders: the all-fermionic scattering channels,JHEP 12 (2012) 054, arXiv:1207.0236 [hep-ph]. [17] M. Czakon and A. Mitov,
NNLO corrections to top pair production at hadron colliders: the quark-gluon reaction, JHEP 01 (2013) 080, arXiv:1210.6832 [hep-ph].
[18] M. Czakon, P. Fiedler and A. Mitov,
Total Top-Quark Pair-Production Cross Section at Hadron Colliders Through O(α4S), Phys. Rev. Lett. 110 (2013) 252004, arXiv:1303.6254 [hep-ph].
[19] ATLAS Collaboration, Analysis of events with b-jets and a pair of leptons of the same charge in pp collisions at √s= 8 TeV with the ATLAS detector,JHEP 10 (2015) 150,
arXiv:1504.04605 [hep-ex].
[20] ATLAS Collaboration, Search for pair and single production of new heavy quarks that decay to a Z boson and a third-generation quark in pp collisions at √s= 8 TeV with the ATLAS detector, JHEP 11 (2014) 104, arXiv:1409.5500 [hep-ex].
[21] ATLAS Collaboration, Search for production of vector-like quark pairs and of four top quarks in the lepton-plus-jets final state in pp collisions at √s= 8 TeV with the ATLAS detector,
JHEP 08 (2015) 105, arXiv:1505.04306 [hep-ex].
[22] CMS Collaboration,
Search for vector-like charge 2/3 T quarks in proton-proton collisions at sqrt(s) = 8 TeV, Phys. Rev. D 93 (2016) 012003, arXiv:1509.04177 [hep-ex].
[23] ATLAS Collaboration, Search for top squarks in final states with one isolated lepton, jets, and missing transverse momentum in √s= 13 TeV pp collisions with the ATLAS detector,
Phys. Rev. D 94 (2016) 052009, arXiv:1606.03903 [hep-ex].
[24] ATLAS Collaboration, The ATLAS Experiment at the CERN Large Hadron Collider, JINST 3 (2008) S08003.
[25] ATLAS Collaboration, ATLAS Insertable B-Layer Technical Design Report, ATLAS-TDR-19,
2010, url:https://cds.cern.ch/record/1291633,
ATLAS Insertable B-Layer Technical Design Report Addendum, ATLAS-TDR-19-ADD-1, 2012,
URL:https://cds.cern.ch/record/1451888.
[26] ATLAS Collaboration,
Early Inner Detector Tracking Performance in the 2015 Data at √s= 13 TeV,
ATL-PHYS-PUB-2015-051, 2015, url:https://cds.cern.ch/record/2110140.
[27] ATLAS Collaboration, Performance of the ATLAS Trigger System in 2015, (2016), arXiv:1611.09661 [hep-ex].
[28] ATLAS Collaboration,
Luminosity determination in pp collisions at √s= 8 TeV using the ATLAS detector at the LHC, Eur. Phys. J. C 76 (2016) 653, arXiv:1608.03953 [hep-ex].
[29] T. Sjöstrand, S. Mrenna and P. Z. Skands, A brief introduction to PYTHIA 8.1, Comput. Phys. Commun. 178 (2008) 852, arXiv:0710.3820 [hep-ph].
[30] S. Alioli, P. Nason, C. Oleari and E. Re, A general framework for implementing NLO calculations in shower Monte Carlo programs: the POWHEG BOX,JHEP 06 (2010) 043,
arXiv:1002.2581 [hep-ph]. [31] S. Frixione, P. Nason and G. Ridolfi,
A Positive-weight next-to-leading-order Monte Carlo for heavy flavour hadroproduction, JHEP 09 (2007) 126, arXiv:0707.3088 [hep-ph].
[32] E. Re,
Single-top Wt-channel production matched with parton showers using the POWHEG method, Eur. Phys. J. C 71 (2011) 1547, arXiv:1009.2450 [hep-ph].
[33] S. Alioli, P. Nason, C. Oleari and E. Re,
NLO single-top production matched with shower in POWHEG: s- and t-channel contributions, JHEP 09 (2009) 111, [Erratum: JHEP 02 (2010) 011], arXiv:0907.4076 [hep-ph].
[34] T. Sjöstrand, S. Mrenna and P. Z. Skands, PYTHIA 6.4 physics and manual,JHEP 05 (2006) 026, arXiv:hep-ph/0603175.
[35] T. Gleisberg, S. Höche, F. Krauss, M. Schönherr, S. Schumann et al.,
Event generation with SHERPA 1.1,JHEP 02 (2009) 007, arXiv:0811.4622 [hep-ph]. [36] T. Gleisberg and S. Höche, Comix, a new matrix element generator,JHEP 12 (2008) 039,
arXiv:0808.3674 [hep-ph].
[37] F. Cascioli, P. Maierhofer and S. Pozzorini, Scattering Amplitudes with Open Loops, Phys. Rev. Lett. 108 (2012) 111601, arXiv:1111.5206 [hep-ph].
[38] J. Alwall et al., The automated computation of tree-level and next-to-leading order differential cross sections, and their matching to parton shower simulations,JHEP 07 (2014) 079,
arXiv:1405.0301 [hep-ph].
[39] S. Catani, L. Cieri, G. Ferrera, D. de Florian and M. Grazzini,
Vector boson production at hadron colliders: a fully exclusive QCD calculation at NNLO, Phys. Rev. Lett. 103 (2009) 082001, arXiv:0903.2120 [hep-ph].
[40] H.-L. Lai et al., New parton distributions for collider physics,Phys. Rev. D 82 (2010) 074024, arXiv:1007.2241 [hep-ph].
[41] R. D. Ball et al., Parton distributions for the LHC Run II,JHEP 04 (2015) 040, arXiv:1410.8849 [hep-ph].
[42] R. D. Ball et al., Parton distributions with LHC data,Nucl. Phys. B 867 (2013) 244, arXiv:1207.1303 [hep-ph].
[43] D. J. Lange, The EvtGen particle decay simulation package, Nucl. Instrum. Meth. A 462 (2001) 152.
[44] ATLAS Collaboration, The ATLAS Simulation Infrastructure,Eur. Phys. J. C 70 (2010) 823, arXiv:1005.4568 [hep-ex].
[45] S. Agostinelli et al., GEANT4 – a simulation toolkit,Nucl. Instrum. Meth. A 506 (2003) 250. [46] ATLAS Collaboration, Multi-boson simulation for 13 TeV ATLAS analyses,
ATL-PHYS-PUB-2016-002, 2016, url:https://cds.cern.ch/record/2119986.
[47] ATLAS Collaboration, Monte Carlo Generators for the Production of a W or Z/γ∗Boson in Association with Jets at ATLAS in Run 2, ATL-PHYS-PUB-2016-003, 2016,
url:https://cds.cern.ch/record/2120133.
[48] ATLAS Collaboration,
Simulation of top-quark production for the ATLAS experiment at √s= 13 TeV,
ATL-PHYS-PUB-2016-004, 2016, url:https://cds.cern.ch/record/2120417.
[49] ATLAS Collaboration,
Modelling of the t¯tH and t¯tV(V = W, Z) processes for √s= 13 TeV ATLAS analyses,
ATL-PHYS-PUB-2016-005, 2016, url:https://cds.cern.ch/record/2120826.
[50] ATLAS Collaboration, Electron efficiency measurements with the ATLAS detector using the 2015 LHC proton–proton collision data, ATLAS-CONF-2016-024, 2016,
url:https://cds.cern.ch/record/2157687.
[51] ATLAS Collaboration, Muon reconstruction performance of the ATLAS detector in proton–proton collision data at √s= 13 TeV,Eur. Phys. J. C 76 (2016) 292, arXiv:1603.05598 [hep-ex].
[52] ATLAS Collaboration,
Topological cell clustering in the ATLAS calorimeters and its performance in LHC Run 1, (2016), arXiv:1603.02934 [hep-ex].
[53] ATLAS Collaboration, Jet energy scale measurements and their systematic uncertainties in proton-proton collisions at √s= 13 TeV with the ATLAS detector, (2017),
arXiv:1703.09665 [hep-ex].
[54] M. Cacciari, G. P. Salam and G. Soyez, The anti-ktjet clustering algorithm,JHEP 04 (2008) 063,
arXiv:0802.1189 [hep-ph].
[55] ATLAS Collaboration, Performance of pile-up mitigation techniques for jets in pp collisions at√ s= 8 TeV using the ATLAS detector,Eur. Phys. J. C 76 (2016) 581,
arXiv:1510.03823 [hep-ex].
[56] ATLAS Collaboration, Characterisation and mitigation of beam-induced backgrounds observed in the ATLAS detector during the 2011 proton–proton run,JINST 8 (2013) P07004,
arXiv:1303.0223 [hep-ex].
[57] ATLAS Collaboration,
Selection of jets produced in13 TeV proton–proton collisions with the ATLAS detector,
ATLAS-CONF-2015-029, 2015, url:https://cds.cern.ch/record/2037702.
[58] ATLAS Collaboration, Performance of b-Jet Identification in the ATLAS Experiment, JINST 11 (2016) P04008, arXiv:1512.01094 [hep-ex].
[59] ATLAS Collaboration, Optimisation of the ATLAS b-tagging performance for the 2016 LHC Run,
ATL-PHYS-PUB-2016-012, 2016, url:https://cds.cern.ch/record/2160731.
[60] ATLAS Collaboration, Reconstruction, Energy Calibration, and Identification of Hadronically Decaying Tau Leptons in the ATLAS Experiment for Run-2 of the LHC,
ATL-PHYS-PUB-2015-045, 2015, url:https://cds.cern.ch/record/2064383.
[61] ATLAS Collaboration, Expected performance of missing transverse momentum reconstruction for the ATLAS detector at √s= 13 TeV, ATL-PHYS-PUB-2015-023, 2015,
url:https://cds.cern.ch/record/2037700.
[62] ATLAS Collaboration, Performance of missing transverse momentum reconstruction with the ATLAS detector in the first proton–proton collisions at √s= 13 TeV, ATL-PHYS-PUB-2015-027,
2015, url:https://cds.cern.ch/record/2037904.
[63] C. G. Lester and D. J. Summers,
Measuring masses of semi-invisibly decaying particles pair produced at hadron colliders, Phys. Lett. B 463 (1999) 99, arXiv:hep-ph/9906349.
[64] A. J. Barr, B. Gripaios and C. G. Lester,
Transverse masses and kinematic constraints: from the boundary to the crease, JHEP 11 (2009) 096, arXiv:0908.3779 [hep-ph].
[65] P. Konar, K. Kong, K. T. Matchev and M. Park,
Dark matter particle spectroscopy at the LHC: generalizing MT2to asymmetric event topologies, JHEP 04 (2010) 086, arXiv:0911.4126 [hep-ph].
[66] B. Nachman and C. G. Lester, Significance variables,Phys. Rev. D 88 (2013) 075013, arXiv:1303.7009 [hep-ph].
[67] ATLAS Collaboration,
Search for top squark pair production in final states with one isolated lepton, jets, and missing transverse momentum in √s= 8 TeV pp collisions with the ATLAS detector,JHEP 11 (2014) 118, arXiv:1407.0583 [hep-ex].
[68] ATLAS Collaboration, Jet Calibration and Systematic Uncertainties for Jets Reconstructed in the
ATLAS Detector at √s= 13 TeV, ATL-PHYS-PUB-2015-015, 2015,
url:https://cds.cern.ch/record/2037613.
[69] ATLAS Collaboration, A method for the construction of strongly reduced representations of ATLAS experimental uncertainties and the application thereof to the jet energy scale,
ATL-PHYS-PUB-2015-014, 2015, url:https://cds.cern.ch/record/2037436.
[70] M. Bahr et al., Herwig++ physics and manual,Eur. Phys. J. C 58 (2008) 639, arXiv:0803.0883 [hep-ph].
[71] ATLAS Collaboration, Measurement of the cross-section for W boson production in association with b-jets in pp collisions at √s= 7 TeV with the ATLAS detector,JHEP 06 (2013) 084, arXiv:1302.2929 [hep-ex].
[72] N. Kidonakis,
Two-loop soft anomalous dimensions for single top quark associated production with a W- or H-, Phys. Rev. D 82 (2010) 054018, arXiv:1005.4451 [hep-ph].
[73] A. L. Read, Presentation of search results: The CL(s) technique,J. Phys. G 28 (2002) 2693. [74] G. Cowan, K. Cranmer, E. Gross and O. Vitells,
Asymptotic formulae for likelihood-based tests of new physics,
Eur. Phys. J. C 71 (2011) 1554, [Erratum: Eur. Phys. J. C 73 (2013) 2501],
arXiv:1007.1727 [physics.data-an].
[75] M. Baak et al., HistFitter software framework for statistical data analysis, Eur. Phys. J. C 75 (2015) 153, arXiv:1410.1280 [hep-ex].
[76] ATLAS Collaboration, ATLAS Computing Acknowledgements 2016–2017,
ATL-GEN-PUB-2016-002, url:https://cds.cern.ch/record/2202407.
The ATLAS Collaboration
M. Aaboud137d, G. Aad88, B. Abbott115, O. Abdinov12,∗, B. Abeloos119, S.H. Abidi161,
O.S. AbouZeid139, N.L. Abraham151, H. Abramowicz155, H. Abreu154, R. Abreu118, Y. Abulaiti148a,148b, B.S. Acharya167a,167b,a, S. Adachi157, L. Adamczyk41a, J. Adelman110, M. Adersberger102, T. Adye133, A.A. Affolder139, T. Agatonovic-Jovin14, C. Agheorghiesei28c, J.A. Aguilar-Saavedra128a,128f,
S.P. Ahlen24, F. Ahmadov68,b, G. Aielli135a,135b, S. Akatsuka71, H. Akerstedt148a,148b, T.P.A. Åkesson84, E. Akilli52, A.V. Akimov98, G.L. Alberghi22a,22b, J. Albert172, P. Albicocco50, M.J. Alconada Verzini74, S.C. Alderweireldt108, M. Aleksa32, I.N. Aleksandrov68, C. Alexa28b, G. Alexander155,
T. Alexopoulos10, M. Alhroob115, B. Ali130, M. Aliev76a,76b, G. Alimonti94a, J. Alison33, S.P. Alkire38, B.M.M. Allbrooke151, B.W. Allen118, P.P. Allport19, A. Aloisio106a,106b, A. Alonso39, F. Alonso74,
C. Alpigiani140, A.A. Alshehri56, M. Alstaty88, B. Alvarez Gonzalez32, D. Álvarez Piqueras170, M.G. Alviggi106a,106b, B.T. Amadio16, Y. Amaral Coutinho26a, C. Amelung25, D. Amidei92,
S.P. Amor Dos Santos128a,128c, A. Amorim128a,128b, S. Amoroso32, G. Amundsen25, C. Anastopoulos141,
L.S. Ancu52, N. Andari19, T. Andeen11, C.F. Anders60b, J.K. Anders77, K.J. Anderson33, A. Andreazza94a,94b, V. Andrei60a, S. Angelidakis9, I. Angelozzi109, A. Angerami38,
A.V. Anisenkov111,c, N. Anjos13, A. Annovi126a,126b, C. Antel60a, M. Antonelli50, A. Antonov100,∗, D.J. Antrim166, F. Anulli134a, M. Aoki69, L. Aperio Bella32, G. Arabidze93, Y. Arai69, J.P. Araque128a, V. Araujo Ferraz26a, A.T.H. Arce48, R.E. Ardell80, F.A. Arduh74, J-F. Arguin97, S. Argyropoulos66, M. Arik20a, A.J. Armbruster32, L.J. Armitage79, O. Arnaez161, H. Arnold51, M. Arratia30, O. Arslan23, A. Artamonov99, G. Artoni122, S. Artz86, S. Asai157, N. Asbah45, A. Ashkenazi155, L. Asquith151, K. Assamagan27, R. Astalos146a, M. Atkinson169, N.B. Atlay143, K. Augsten130, G. Avolio32, B. Axen16, M.K. Ayoub119, G. Azuelos97,d, A.E. Baas60a, M.J. Baca19, H. Bachacou138, K. Bachas76a,76b,
M. Backes122, M. Backhaus32, P. Bagnaia134a,134b, M. Bahmani42, H. Bahrasemani144, J.T. Baines133, M. Bajic39, O.K. Baker179, E.M. Baldin111,c, P. Balek175, F. Balli138, W.K. Balunas124, E. Banas42, A. Bandyopadhyay23, Sw. Banerjee176,e, A.A.E. Bannoura178, L. Barak32, E.L. Barberio91, D. Barberis53a,53b, M. Barbero88, T. Barillari103, M-S Barisits32, J.T. Barkeloo118, T. Barklow145, N. Barlow30, S.L. Barnes36c, B.M. Barnett133, R.M. Barnett16, Z. Barnovska-Blenessy36a, A. Baroncelli136a, G. Barone25, A.J. Barr122, L. Barranco Navarro170, F. Barreiro85,
J. Barreiro Guimarães da Costa35a, R. Bartoldus145, A.E. Barton75, P. Bartos146a, A. Basalaev125, A. Bassalat119, f, R.L. Bates56, S.J. Batista161, J.R. Batley30, M. Battaglia139, M. Bauce134a,134b, F. Bauer138, H.S. Bawa145,g, J.B. Beacham113, M.D. Beattie75, T. Beau83, P.H. Beauchemin165, P. Bechtle23, H.P. Beck18,h, H.C. Beck57, K. Becker122, M. Becker86, M. Beckingham173, C. Becot112, A.J. Beddall20e, A. Beddall20b, V.A. Bednyakov68, M. Bedognetti109, C.P. Bee150, T.A. Beermann32, M. Begalli26a, M. Begel27, J.K. Behr45, A.S. Bell81, G. Bella155, L. Bellagamba22a, A. Bellerive31, M. Bellomo154, K. Belotskiy100, O. Beltramello32, N.L. Belyaev100, O. Benary155,∗, D. Benchekroun137a, M. Bender102, K. Bendtz148a,148b, N. Benekos10, Y. Benhammou155, E. Benhar Noccioli179, J. Benitez66, D.P. Benjamin48, M. Benoit52, J.R. Bensinger25, S. Bentvelsen109, L. Beresford122, M. Beretta50, D. Berge109, E. Bergeaas Kuutmann168, N. Berger5, J. Beringer16, S. Berlendis58, N.R. Bernard89, G. Bernardi83, C. Bernius145, F.U. Bernlochner23, T. Berry80, P. Berta131, C. Bertella35a,
G. Bertoli148a,148b, F. Bertolucci126a,126b, I.A. Bertram75, C. Bertsche45, D. Bertsche115, G.J. Besjes39, O. Bessidskaia Bylund148a,148b, M. Bessner45, N. Besson138, C. Betancourt51, A. Bethani87,
S. Bethke103, A.J. Bevan79, J. Beyer103, R.M. Bianchi127, O. Biebel102, D. Biedermann17, R. Bielski87, K. Bierwagen86, N.V. Biesuz126a,126b, M. Biglietti136a, T.R.V. Billoud97, H. Bilokon50, M. Bindi57, A. Bingul20b, C. Bini134a,134b, S. Biondi22a,22b, T. Bisanz57, C. Bittrich47, D.M. Bjergaard48, C.W. Black152, J.E. Black145, K.M. Black24, R.E. Blair6, T. Blazek146a, I. Bloch45, C. Blocker25,
A. Blue56, W. Blum86,∗, U. Blumenschein79, S. Blunier34a, G.J. Bobbink109, V.S. Bobrovnikov111,c,
S.S. Bocchetta84, A. Bocci48, C. Bock102, M. Boehler51, D. Boerner178, D. Bogavac102,
A.G. Bogdanchikov111, C. Bohm148a, V. Boisvert80, P. Bokan168,i, T. Bold41a, A.S. Boldyrev101,
A.E. Bolz60b, M. Bomben83, M. Bona79, M. Boonekamp138, A. Borisov132, G. Borissov75, J. Bortfeldt32, D. Bortoletto122, V. Bortolotto62a,62b,62c, D. Boscherini22a, M. Bosman13, J.D. Bossio Sola29,
J. Boudreau127, J. Bouffard2, E.V. Bouhova-Thacker75, D. Boumediene37, C. Bourdarios119, S.K. Boutle56, A. Boveia113, J. Boyd32, I.R. Boyko68, J. Bracinik19, A. Brandt8, G. Brandt57, O. Brandt60a, U. Bratzler158, B. Brau89, J.E. Brau118, W.D. Breaden Madden56, K. Brendlinger45, A.J. Brennan91, L. Brenner109, R. Brenner168, S. Bressler175, D.L. Briglin19, T.M. Bristow49, D. Britton56, D. Britzger45, F.M. Brochu30, I. Brock23, R. Brock93, G. Brooijmans38, T. Brooks80, W.K. Brooks34b, J. Brosamer16, E. Brost110, J.H Broughton19, P.A. Bruckman de Renstrom42, D. Bruncko146b, A. Bruni22a, G. Bruni22a, L.S. Bruni109, BH Brunt30, M. Bruschi22a, N. Bruscino23, P. Bryant33, L. Bryngemark45, T. Buanes15, Q. Buat144, P. Buchholz143, A.G. Buckley56, I.A. Budagov68, F. Buehrer51, M.K. Bugge121, O. Bulekov100, D. Bullock8, T.J. Burch110, S. Burdin77, C.D. Burgard51, A.M. Burger5, B. Burghgrave110, K. Burka42, S. Burke133, I. Burmeister46, J.T.P. Burr122, E. Busato37, D. Büscher51, V. Büscher86, P. Bussey56, J.M. Butler24, C.M. Buttar56, J.M. Butterworth81, P. Butti32, W. Buttinger27, A. Buzatu35c, A.R. Buzykaev111,c, S. Cabrera Urbán170, D. Caforio130,
V.M. Cairo40a,40b, O. Cakir4a, N. Calace52, P. Calafiura16, A. Calandri88, G. Calderini83, P. Calfayan64, G. Callea40a,40b, L.P. Caloba26a, S. Calvente Lopez85, D. Calvet37, S. Calvet37, T.P. Calvet88,
R. Camacho Toro33, S. Camarda32, P. Camarri135a,135b, D. Cameron121, R. Caminal Armadans169, C. Camincher58, S. Campana32, M. Campanelli81, A. Camplani94a,94b, A. Campoverde143,
V. Canale106a,106b, M. Cano Bret36c, J. Cantero116, T. Cao155, M.D.M. Capeans Garrido32, I. Caprini28b, M. Caprini28b, M. Capua40a,40b, R.M. Carbone38, R. Cardarelli135a, F. Cardillo51, I. Carli131, T. Carli32, G. Carlino106a, B.T. Carlson127, L. Carminati94a,94b, R.M.D. Carney148a,148b, S. Caron108, E. Carquin34b, S. Carrá94a,94b, G.D. Carrillo-Montoya32, J. Carvalho128a,128c, D. Casadei19, M.P. Casado13, j,
M. Casolino13, D.W. Casper166, R. Castelijn109, V. Castillo Gimenez170, N.F. Castro128a,k, A. Catinaccio32, J.R. Catmore121, A. Cattai32, J. Caudron23, V. Cavaliere169, E. Cavallaro13, D. Cavalli94a, M. Cavalli-Sforza13, V. Cavasinni126a,126b, E. Celebi20a, F. Ceradini136a,136b,
L. Cerda Alberich170, A.S. Cerqueira26b, A. Cerri151, L. Cerrito135a,135b, F. Cerutti16, A. Cervelli18, S.A. Cetin20d, A. Chafaq137a, D. Chakraborty110, S.K. Chan59, W.S. Chan109, Y.L. Chan62a, P. Chang169, J.D. Chapman30, D.G. Charlton19, C.C. Chau161, C.A. Chavez Barajas151, S. Che113,
S. Cheatham167a,167c, A. Chegwidden93, S. Chekanov6, S.V. Chekulaev163a, G.A. Chelkov68,l, M.A. Chelstowska32, C. Chen67, H. Chen27, S. Chen35b, S. Chen157, X. Chen35c,m, Y. Chen70, H.C. Cheng92, H.J. Cheng35a, A. Cheplakov68, E. Cheremushkina132, R. Cherkaoui El Moursli137e, E. Cheu7, K. Cheung63, L. Chevalier138, V. Chiarella50, G. Chiarelli126a,126b, G. Chiodini76a,
A.S. Chisholm32, A. Chitan28b, Y.H. Chiu172, M.V. Chizhov68, K. Choi64, A.R. Chomont37, S. Chouridou156, V. Christodoulou81, D. Chromek-Burckhart32, M.C. Chu62a, J. Chudoba129,
A.J. Chuinard90, J.J. Chwastowski42, L. Chytka117, A.K. Ciftci4a, D. Cinca46, V. Cindro78, I.A. Cioara23, C. Ciocca22a,22b, A. Ciocio16, F. Cirotto106a,106b, Z.H. Citron175, M. Citterio94a, M. Ciubancan28b, A. Clark52, B.L. Clark59, M.R. Clark38, P.J. Clark49, R.N. Clarke16, C. Clement148a,148b, Y. Coadou88, M. Cobal167a,167c, A. Coccaro52, J. Cochran67, L. Colasurdo108, B. Cole38, A.P. Colijn109, J. Collot58, T. Colombo166, P. Conde Muiño128a,128b, E. Coniavitis51, S.H. Connell147b, I.A. Connelly87,
S. Constantinescu28b, G. Conti32, F. Conventi106a,n, M. Cooke16, A.M. Cooper-Sarkar122, F. Cormier171, K.J.R. Cormier161, M. Corradi134a,134b, F. Corriveau90,o, A. Cortes-Gonzalez32, G. Cortiana103,
G. Costa94a, M.J. Costa170, D. Costanzo141, G. Cottin30, G. Cowan80, B.E. Cox87, K. Cranmer112, S.J. Crawley56, R.A. Creager124, G. Cree31, S. Crépé-Renaudin58, F. Crescioli83, W.A. Cribbs148a,148b, M. Cristinziani23, V. Croft108, G. Crosetti40a,40b, A. Cueto85, T. Cuhadar Donszelmann141,