TITLE:
1
Plant resistance to drought relies on early stomatal closure
2
AUTHORS:
3
Martin-StPaul N
1, Delzon S
2; Cochard H
34
AFFILIATIONS:
5
1-
URFM, INRA, 84000 Avignon, France
6
2-
BIOGECO, INRA, Univ. Bordeaux, 33615 Pessac, France
7
3-
PIAF, INRA, UCA, 63000 Clermont-Ferrand, France
8
9
ABSTRACT:
10
Plant resistance to drought has long been thought to be associated with the ability to maintain
11
transpiration and photosynthesis longer during drought, through the opening of stomata. This premise
12
is at the root of most current framework used to assess drought impacts on land plants in vegetation
13
models. We examined this premise by coupling a meta-analysis of functional traits of stomatal response
14
to drought (i.e. the water potential causing stomatal closure,
ψ
close) and embolism resistance (the water
15
potential at the onset of embolism formation,
Ψ
12), with simulations from a soil-plant hydraulic model.
16
We found that
ψ
closeand
Ψ
12were equal (isometric) only for a restricted number of species, but as
Ψ
1217
decreases, the departure from isometry increases, with stomatal closure occurring far before embolism
18
occurs. For the most drought resistant species (
Ψ
12<-4.2 MPa),
Ψ
closewas remarkably independent of
19
embolism resistance and remained above -4.5 MPa, suggesting the existence of a restrictive boundary
20
by which stomata closure must occur. This pattern was supported by model simulations. Indeed,
21
coordinated decrease in both
ψ
closeand
ψ
12leads to unsuspected accelerated death under drought for
22
embolism resistant species, in contradiction with observations from drought mortality experiments.
23
Overall our results highlight that most species have similarity in stomatal behavior, and are highly
24
conservative in terms of their water use during drought. The modelling framework presented here
25
provides a baseline to simulate the temporal dynamic leading to mortality under drought by accounting
26
for multiple, measurable traits.
27
28
29
30
31
INTRODUCTION
32
Recent drought episodes have been identified as the triggers for widespread plant mortality
33
events around the world [1–3]
.They have had huge consequences for the productivity of the land [4]
34
and have undoubtedly affected a panel of ecosystem services
[5]. Identifying the mechanisms and traits
35
underlying drought resistance is essential to understanding and predicting the impact of widespread
36
droughts over many land areas. Experimental studies have provided empirical evidence that the failure
37
of the water transport system is tightly linked to tree dehydration and mortality in drought conditions.
38
This was confirmed by a recent study reporting that global patterns of mortality was predictable from
39
hydraulic safety margins[6]. Two key types of traits shaping the trade-off between drought resistance
40
and the maximization of carbon dioxide assimilation have been identified: hydraulic traits ensuring the
41
integrity of the hydraulic system under drought [7], and stomatal traits controlling gas exchanges at the
42
leaf surface [8]. However, efforts to model tree mortality in response to drought is still hindered by a lack
43
of understanding of how these traits interact to define physiological dysfunctions under drought stress
44
[9]. In this study, we analyzed the overall connections between these two types of traits for the full range
45
of drought resistance, with a soil-plant hydraulic model.
46
The stomata have two key functions: controlling transpiration, which supplies nutrients and
47
regulates leaf temperature, and controlling the entry of CO
2into the leaf. Stomatal closure in response
48
to water deficit is the primary limitation to photosynthesis [10], and constitutes a key cost in terms of
49
plant growth and leaf temperature under drought conditions. However, stomatal closure also limits
50
excessive decreases in water potential (quantified as a negative pressure,
ψ) in the plant, thereby
51
ensuring that the water demand from the leaves does not exceed the supply capacity of the hydraulic
52
system, which would lead to embolism of the vascular system and complete dehydration of the plant.
53
These key, but opposing roles of stomata in regulating CO
2influx and H
2O loss pose a dilemma that has
54
occupied scientists for centuries
1and has led to the view that plant stomata probably operate at the
55
edge of the supply capacity of the plant’s hydraulic system, to balance different cost such as productivity
56
leaf temperature regulation during drought [11,12].
57
Conversely, maintenance of the supply capacity of the hydraulic system depends on the ability
58
of a species to sustain high negative pressure to limit embolism. Embolism resistance is usually
59
quantified by the value of
ψ causing 50% embolism (Ψ
50), and the rate of embolism spread per unit drop
60
in water potential (slope). From these two traits the
Ψ at the onset embolism formation can be computed
61
(
Ψ
12, see equations 1 to 3), which give a more conservative functional limit to the hydraulic system.
62
Embolism resistance varies considerably between species and with the dryness of species habitat
63
[7,13,14]. A recent study has suggested that hydraulic systems highly resistant to embolism have
64
evolved in response to the selective pressure associated with increasing drought levels during a
65
paleoclimatic crisis [15]. Some contemporary plants have extremely drought-resistant vascular systems,
66
with
Ψ
50values reaching -19 MPa [16].
67
These findings have led to the suggestion that an efficient match between the capacity of the
68
hydraulic system to sustain water deficit (i.e. embolism resistance) and the regulation of demand by the
69
stomata is a prerequisite for the maximization of gas exchanges without dehydration [11,17–19]. This
70
notion naturally leads to the hypothesis that stomatal behavior and embolism resistance have followed
71
a similar evolutionary trajectory under drought constraints, and that plants have increased their intrinsic
72
embolism resistance to allow stomata to close later during drought, thereby maximizing plant productivity
73
[8,12,20]. The coordination of stomatal and hydraulic traits and their role in shaping drought resistance
74
has yet to be addressed on a global scale. This would help to clarify the interplay between mechanisms
75
and plant traits in defining the physiological dysfunctions occurring under drought stress, whic h remains
76
one of the principal challenge faced in the modeling of tree mortality in response to drought.
77
In this study we gathered stomatal regulation traits and embolism resistance traits for different
78
species. We compiled
ψ
12,
ψ
50and slope values derived from stem vulnerability curves published by us
79
during the past 20 years, representing 151 species from different biomes (Tables S1). Recent direct
80
observations of embolism formation by mean of X-ray tomography [21–24] confirmed the reliability of
81
these values. For those species, we performed a seach for data of water potential causing stomatal
82
closure (
Ψ
close). We used concurrent measurements of gas exchange and leaf water potential, from
83
which the
Ψ value at 90% stomatal closure was calculated following [8,20]. Stomatal opening increases
84
with guard cell turgor pressure [25–27], thus, we also used leaf water potential at turgor loss (Ψ
tlp) as a
85
surrogate for
Ψ
close. We then explored the range of variation and the coordination between
Ψ
closeand
86
Ψ
50. Finally, we used a soil-plant water transport model to elucidate how different associations between
87
Ψ
closeand
Ψ
50determine the time until hydraulic failure during drought (see Methods). We validated
88
model predictions using empirical data for time to shoots death collected in drought mortality
89
experiments[28–31]
(see Methods and Appendix 1).
90
RESULTS AND DISCUSSION
91
Embolism resistance (taken as the
Ψ
50)
ranged between -1.3 and -19 MPa (Figure 1 A). The
92
large variations of
Ψ
50were partly related to changes of the slope which was non linearly related to the
93
Ψ
50(Figure 1 A, insert). Both the
Ψ
50and slope determined the value of the water potential causing the
94
onset of embolism (
Ψ
12, equation 3). This more conservative indicator of embolism resistance ranged
95
between -0.7 and -14 MPa. The two indicators of water potential causing stomatal closure (
Ψ
close) were
96
significantly related between each other with a slope close to one as previously reported [20]
97
(p.value<0.01 Figure 1b insert).
Ψ
closewas thus taken as the average value when the two traits were
98
found. By contrast to embolism resistance,
Ψ
closevaried from -1. to -4.3MPa, spanning a three times
99
lower range of variation than embolism resistance (Figure 1 A & B), in agreement with recent
meta-100
analysis [20].
101
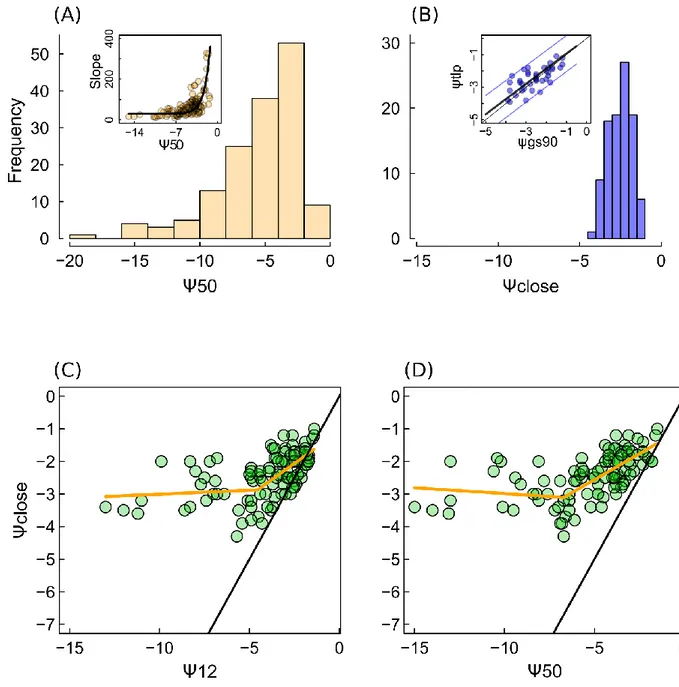
102
Figure 1: Range of variation of embolism resistance (
Ψ
50) and stomatal response to drought (
Ψ
close),
103
and their covariation, showing that these two traits do not covary isometrically. (A) Distribution of
104
embolism resistance (
Ψ
50) among plants. The insert shows the relationship between the slope of the
105
vulnerability curve (%/MPa, equation 2) and
Ψ
50, that allows to compute
Ψ
12(MPa). The best fit was
106
obtained with slope= 16+e
(ψ50)x1092, the fitted parameters were significatly different from 0
107
(P.value<0.01). (B) Distribution of the water potential causing stomatal closure (
Ψ
close). The relationship
108
between the two different traits for
Ψ
close(the water potential causing 90% stomatal closure,
Ψ
gs90) and
109
the water potential causing leaf turgor loss (
Ψ
tlp) is shown in the inset with fitted line (ψ
tlp=0.97×ψ
gs90,
110
p.value<0.01, R²=0.4) and the 95% confidence interval. (C) The relationship between
Ψ
closeand
Ψ
12,and
111
(D) relationship between
Ψ
closeand
Ψ
50. Points are individual species and the orange line is the best fit
112
with a segmented regression, showing a significant break point for
Ψ
50of -5.9 MPa or
Ψ
12of -4.2MPa
113
corresponding to an average
Ψ
closeof ca. -3 MPa (± 1.5MPa, 95%CI).
114
115
The relationship between
Ψ
12and
Ψ
closedid not follow the isometric line (i.e. the 1:1 line, Figure
116
1c), but had a slope lower than unity : 0.4 for species with low embolism resistance (
Ψ
12>-4.2) and null
117
for drought resistant species (For
Ψ
12<-4.2, p.value=0.4). This contradicts the expected match between
Ψ
12and
Ψ
closeand indicates that the departure between
Ψ
12and
Ψ
closeincrease with increasing embolism
119
resistance. These results were confirmed when we used
Ψ
50as an indicator of embolism resistance
120
(Figure 1 D, Table S2). The relationship between
Ψ
closeand embolism resistance (
Ψ
50,
Ψ
12) presented
121
a marked interruption (i.e. for
Ψ
12of -4.2 or
Ψ
50ca.-6 MPa) corresponding to
Ψ
close=-3Mpa on average
122
(Figure 1 C, Figure 1 D and Table S2). Overall, these results indicate that stomatal closure always occurs
123
at much higher water potential value than the one triggering embolism and that the difference between
124
Ψ
closeand
Ψ
50increases continuously with increasing embolism resistance. Contrasting the
125
hypothesized coordination between stomatal closure and embolism resistance, our finding supports a
126
similarity in stomatal behavior particularly among embolism resistant species, and indicates that most
127
species are highly conservative in terms of their water use during drought.
128
The similarity of stomatal behavior between species suggests that keeping stomata open is not
129
beneficial in terms of fitness, particularly for survival under drought conditions. To get more insights into
130
the relationship between stomatal function and plant resilience to drought, we developped a soil plant
-131
hydraulic model (see Methods) computing the survival times under drought conditions (i.e. the time to
132
hydraulic failure) for the range of hypothetical species covering the full spectrum of embolism resistance.
133
We used three different postulates to assess stomatal behavior (Figure 2 A, see Methods and Appendix
134
2). Firstly (hypothesis 1), we assumed that stomata do not close to regulate transpiration (E) during
135
drought (i.e. stomata are maintained open whatever the soil and plant water potential). Secondly, we
136
assumed (hypothesis 2) that stomata regulate water losses to maintain plant water potential (
Ψ
plant)
137
above the water potential resulting in the onset of embolism (i.e.
Ψ
12), according to the premise that the
138
integrity of the hydraulic system is functionally linked to stomatal closure in response to drought. This
139
was done by reducing E to a residual term (E
min) when
Ψ
plantapproached
Ψ
12(Appendix 4). Finally
140
(hypothesis 3), we assumed that
Ψ
closevaried with
Ψ
50until -3 MPa, independently of the hydraulic
141
properties of the vascular system (orange line in Figure 2c), in accordance with the empirical average
142
trend observed in our dataset (Figure 1 C). We simulated the E decline due to the progressive loss of
143
turgor as water deficit increases, by inverting the pressure volume curve equations[32] (Appendix 3). At
144
turgor loss point, E was reduced to E
min, as for hypothesis 2. We report on Figure 2b the relationships
145
between survial time (time to hydraulic failure) and
Ψ
50modeled for each of the three hypothesis. As a
146
mean of validation, we compared these relationships with results from drought mortality experiments in
147
which survival time increased with
Ψ
50(Figure 2 C).
149
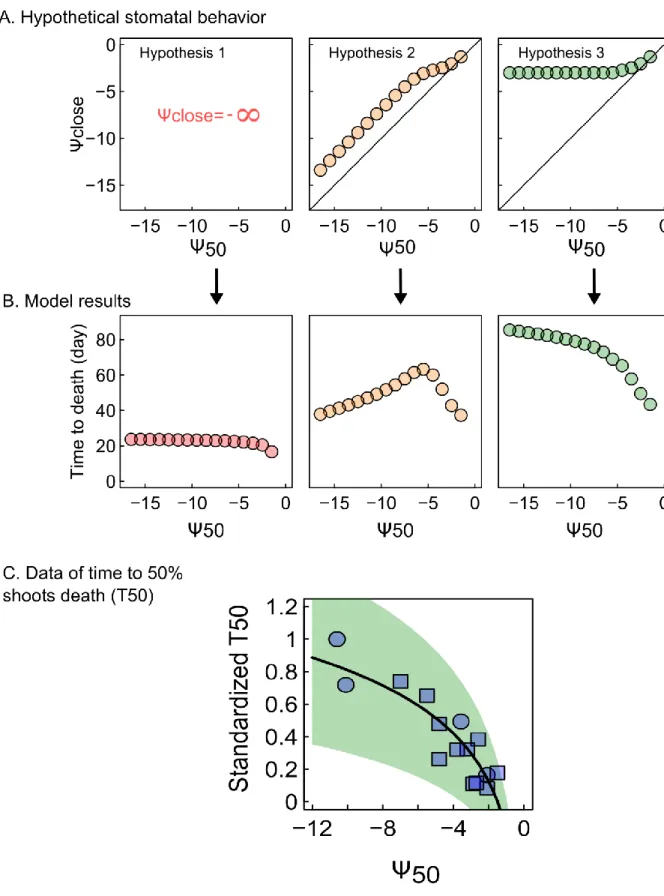
Figure 2: Model simulations of the survival time for the range of embolism resistance, under three
150
different hypothesis of stomata behaviour. (A) Representation of the parameters combinations for
Ψ
close151
and
Ψ
50used to represent the three hypothesis tested in the model: (Hypothesis 1) Stomata never close
152
(i.e. plants maintain maximal rates of transpiration at all soil and plant water potentials whatever their
153
Ψ
50). (hypothesis 2) Stomata regulate water losses to maintain plant water potential above the water
154
potential resulting in the onset of embolism (i.e stomata close when water potential reaches
Ψ
12).
155
(hypothesis 3) Stomata closure and embolism resistance were not coordinated untill -3MPa as indicated
156
by our empirical results (Figure 1c,d). (B) Simulated relationship between survival time (time until
157
hydraulic failure) and
Ψ
50for each hypothesis tested. (C) Normalized time to 50% shoot death (T
50) as
158
a function of
Ψ
50for 15 species. The data were gathered from four different studies and normalized to
159
account for differences in soil and climate conditions across experiments (see Methods). The logarithmic
160
relationship fitted on absolute values (0.42×log(|
ψ
50|)-0.16, slope p.val<0.001) is shown (line) with 95%
161
CI (green area).
162
163
Hypotheses 1 and 2 were not consistent with the empirical observation that survival time
164
increased with embolism resistance (Figure 2 C). By contrast, simulations imposing early stomatal
165
closure (hypothesis 3) resulted in an increase in sur vival with embolism resistance (Figure 2 B).
166
Under hypothesis 1, plants would die very rapidly from hydraulic failure, with only a slight
167
increase in survival when
Ψ
50decreased from -1 to -6 MPa (Figure 2 C ). For
Ψ
50values below -6 MPa,
168
increasing embolism resistance was not associated with a further increase in survival time, suggesting
169
that increasing embolism resistance per se had only a marginal impact on survival under drought
170
conditions. If water loss regulation was imposed to maintain
Ψ
plantjust above the level triggering
171
embolism (hypothesis 2), survival time was much higher (Figure 2 B), and increased markedly with
172
embolism resistance until
Ψ
50reached -6 MPa. However, beyond this value, survival decreased
173
substantially (Figure 2B), contrary to the trend observed in analyses of experimental induced mortality
174
(Figure 2B). This increase in survival for at high
Ψ
50(
Ψ
50>-6MPa), is in fact due to the maintenance of
175
Ψ
12(and thus of stomatal closure) at a constant of ca. -3 MPa because of the slope of the VC decrease
176
with decreasing
Ψ
50(Appendix A2-4, Figure A2-6). If the slope of the VC was maintained at a constant
177
average value of 45%/MPa for all the
Ψ
50tested, the model would simulate a consistant decrease of
178
survival with embolism resistance under this assumption (Appendix 2-2, Figure A2-2).
179
The survival peak simulated at a
Ψ
50of -6 MPa (Figure 2 B) under this hypothesis, implies that
180
Ψ
closeis about -3 MPa, corresponding to the mean limit for
Ψ
closein our database. Consequently,
181
assuming that
Ψ
closedoes not covary with embolism resistance beyond
Ψ
close= -3 MPa (hypothesis 3),
182
a positive relationship between survival and embolism resistance was predicted over the entire range of
183
Ψ
50(Figure 2 B), consistent with the empirical trend observed in drought mortality experiments (Figure
184
2 A). These simulations provided support for the view that embolism resistance cannot increase survival
185
unless the difference between embolism resistance and
Ψ
closealso increases.
186
An analysis of the modeled dynamics of soil and plant dehydration for two species with
187
contrasting level of embolism resistance identified the physical mechanisms making early stomata
188
closure a prerequisite for the avoidance of drought-induced mortality, even for embolism-resistant
189
species (Figure 3). The relationship between soil water potential (
Ψ
soil) (and, hence, plant water
190
potential) and soil water content (Θ) becomes nonlinear at relatively high value of Ψ
soil(Figure 3a and
191
3b). Thus, the longer transpiration is maintained the sharpest are the rates of soil and plant water
192
potential drops, leading to rapid death through hydraulic failure. The nonlinearity of the
Ψ
soil(Θ)
193
relationship results from long-established physical laws [33,34] describing the changes in
Ψ
soiland soil
194
conductivity with soil water content. These laws are globally conserved among soil types (Appendix A4,
195
Figure A4-1), providing support for the global scope of our findings.
196
197
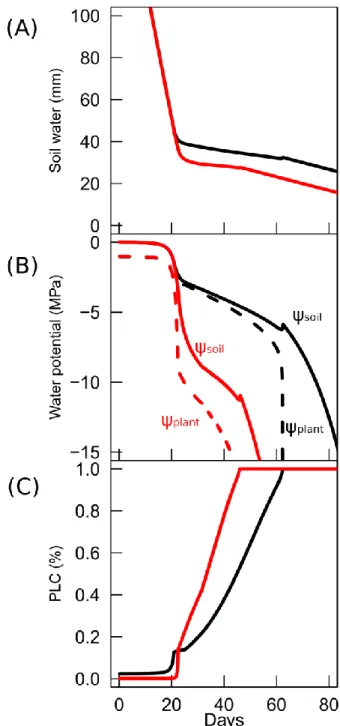
Figure 3: Simulated temporal dynamics of soil and plant dehydration assuming that stomata close when
198
water potential reaches
Ψ
12(hypothesis 2 in the text) for two contrasted species. (A) soil water content,
199
(B) soil and plant water potential and (C) the percent loss of conductivity caused by embolism.
200
Simulations were performed for two hypothetic plants (plant A and plant B) which traits are given in MPa
201
on the plot. The time to death by hydraulic failure (i.e. 100% embolism) is also indicated. Simulations
202
show that high levels of embolism resistance, and thus stomatal closure at lower water potential
203
accelerated death, because of faster water potential drops. More detailed simulation results are given
204
Appendix 2.
205
206
The vascular system of terrestrial plants has evolved toward very high levels of embolism
207
resistance (
Ψ
50values down to -19 MPa) allowing the colonization of dry environments
21. Stomatal
208
closure was thought to have evolved along similar lines, to keep carbon assimilation levels for longer
209
periods, even at low xylem water potential. Different recent studies have moreover reported tight
co-210
variations between stomatal closure to drought and embolism resistance, but for relatively low drought
211
resistant species [8,12,20]. Our results highlight that the range of variation of
Ψ
closeappears much
212
reduced when seen in the light of the full range of embolism resistance. Such uncoupling between
213
stomata closure and the failure of the vascular system may be the result of selection pressures that have
214
favored survival under extreme water scarcity over growth under mild drought.
215
These findings provide a complementary view to the widely accepted framework for drought
216
response strategies based on the water to carbon trade-off that plants have to face(e.g[35]
,[36]).
217
According to this framework, plant drought response strategies fall in between two extreme categories
218
called isohydric and anisohydric [8,35,37,38]. Isohydric plants close their stomata rapidly in response to
219
drought, thereby maintaining a high water potential to limit embolism, but at the risk of death due to
220
carbon starvation. Conversely, anisohydric plants keep their stomata open at low water potential,
221
maintaining carbon assimilation levels, but at the cost of damage to the water transport system through
222
embolism. This framework has been the focus of many scientific studies on drought-induced mortality in
223
recent decades and has underpinned our understanding and modeling of drought induced plant mortality
224
[35,36,39]. The fact that plants among the most drought resistant close their stomata at much higher
225
potential than embolism can occur, indicates that resisting drought may not involve achieving further gas
226
exchanges during drought conditions, but demonstrates on the contrary, that plants have to limit water
227
potential drops as confirmed by the modelling analysis (Figure 2b).
228
The relative consistency of
Ψ
closeamong plants may appear contradictory with the large
229
variations in minimum water potential reported by different studies[6,7,38]. However, this may highlight
230
the importance of accounting for the multiple traits driving the demand for water when stomata are close,
231
if we want to represent water potential decline and thus, plant dehydration. For instance, the minimum
232
conductance (i.e. when stomata are closed) or the leaf area must be important traits driving plant water
233
potential decline. The hydraulic model presented is consistent with this view. Accordingly, model
234
simulations indicated that there are two main stages defining the temporal sequence leading to plant
235
dehydration in situations of water scarcity (Figure 3). The first step is defined by the time between the
236
start of water shortage and stomatal closure. Its duration depends principally on the rate of water uptake,
237
given the relative constancy of
Ψ
closein plants and the competition between plants for water in community
238
ecosystems. The second stage is defined by the time between stomatal closure and plant death (100%
239
embolism). The duration of this stage depends on a set of drought resistance traits allowing plant tissues
240
to retain water under very high tension, to decrease water loss when the stomata are closed and to limit
241
the decrease in water potential during embolism through deeper rooting or the release of water for
242
internal stores. It remains to be seen how these other different traits covary with embolism resistance,
243
are coordinated and have coevolved in plants to shape the spectrum of drought adaptation strategies.
244
Overall, the model analysis presented in this study, demonstrates that multiple measurable
245
drought resistance traits can be integrated into a consistent and thermodynamically reliable formal
246
framework to define hydraulic failure. This modelling approach must be validated carefully against
247
temporal dynamics of water potential, hydraulic conductance, proper embolism data and experimental
248
and field mortality for different species. However, it constitutes an important step towards assessing the
249
consequences of drought in land plants and the effects of climate change on terrestrial ecosystem
250
functions. It could also be a powerful tool for taking multiple traits into account in breeding strategies.
251
MATERIALS AND METHODS
253
1- Data Meta-analysis
254
In this study we compiled embolism resistance traits and stomatal regulation traits from different
255
species.
We first compiled
ψ
12,
ψ
50and slope values derived from stem vulnerability curves
(i.e. the
256
curve that relates the percent loss of conductivity to the xylem water potential)
published by us during
257
the past 20 years, representing 150 species from different biomes. Recent direct observations of
258
embolism formation by mean of X-ray tomography confirmed the reliability of these values [21–23,40].
259
All stem vulnerability curves were fitted with a sigmoidal function [41]:
260
𝑃𝐿𝐶 =
1
1 + 𝑒
(𝑎(𝛹𝑝𝑙𝑎𝑛𝑡 −𝜓50))(1)
Where
𝑃𝐿𝐶 is the percent loss of embolism ψ
is the xylem water potential,
ψ
50is the water
261
potential causing 50% loss of plant hydraulic conductivity and a is a shape parameter related to the rate
262
of embolism spread per water potential drop. Equation 1 allows computing the 2 other parameters used
263
in this study (
ψ
12, Slope). A more intuitive way to represent a is to relate it to the derivative of the function
264
at the inflexion point of the VC, in other word, the slope of the linear portion of the VC:
265
𝑆𝑙𝑜𝑝𝑒 =
𝑎 × 100
4
(1)
Where slope is expressed in %.MPa
-1. From the slope and the
ψ
50
, the water potential at the
266
onset of embolism, as defined by the xylem water pressure causing 12% loss of embolism, can also be
267
computed:
268
𝜓
12= 𝜓
50+
50
𝑠𝑙𝑜𝑝𝑒
(2)
We managed to reassemble
ψ
50,
ψ
12and slope parameters for 150 species (see Table S1). We
269
did not considered root and leaf vulnerability curves, because it is still unclear what mechanism is
270
responsible for the decline in hydraulic conductance measured with classical methods on these organs
271
[42–45]. Therefore we focused our study on stem embolism that we consider being the main
272
mechanisms responsible for extreme-drought induced mortality. We therefore neglected possible
273
variations in embolism resistance among plant
organs as we still don’t know how general is this
274
mechanism [20,44,46].
275
For all the species with available stem embolism resistance traits, we collected different traits
276
indicating the level of plant water deficit (
Ψ) causing most stomatal closure (called Ψ
closein the main
277
paper and hereafter). A first group of indicators was derived directly from gas exchange or transpiration
278
measurements along with water potential data. A second indicator of
Ψ
closewas the bulk leaf water
potential causing turgor loss [27,47,48] that was derived from pressure volume curves or from osmotic
280
pressure at full turgor.
281
We searched the litterature for concurrent measurements of stomata conductance (g
s) and leaf
282
(or xylem) water potential to build g
s(
Ψ) curves, following the approach of [8]. We then computed the
283
water potential corresponding to 90% of stomatal closure (
Ψ
90gs). Most of our g
s(
Ψ) were based on
284
diurnal dynamic of leaf water potential of g
sand
Ψ
leafor
Ψ
xylemmeasurements over a drought period. In
285
a few cases, however, we used data of concurrent measurements of water potential (leaf or xylem) and
286
transpiration assessed through gravimetric methods (i.e. mass loss on detached leaves [49] or on potted
287
plants [50] over a dehydration period obtained under constant relative humidity. To select the relevent
288
literature, we primarily used the references provided in [8]. For each species individually, we also perform
289
a google scholar search by using the key words “stomatal conductance” or “transpiration” AND “water
290
potential” or “drought” or “water deficit” and the Latin name of the given species. We obtained in total,
291
66 species for this trait. We then searched the litterature for
ψ
tlpvalues. Most of them were derived from
292
pressure volume curves [51,52], but for 10 species for which we no pressure volume curves available
293
were found, we computed
ψ
tlpfrom the osmotic potential at full turgor (π
0) using a linear relationship
294
between
π
0and
ψ
tlpfollowing [53,54]. Overall, 40% of
ψ
tlpdata (48 over 101 species) came from a
295
previously published database[52], and the rest was collected from different published literature. We
296
searched these data in google scholar, for each species for which no data were available from[52], we
297
used the key words “osmotic potential” or “pressure volume curves” or “turgor loss point” AND the Latin
298
name of the species. When only π
0was measured at different time of the season only the driest date
299
(i.e the lowest value of π
0)
was retained.
300
We studied the statistical associations between the different traits by using R (version 3.3.1),
301
following a two-step procedure. First, we fitted a segmented regression to the scatter plot of
Ψ
close(or its
302
component
Ψ
tlpor
Ψ
gs90) versus embolism resistance
(Ψ
50or
Ψ
12) by using the package segmented.
303
Then we identified (i) the break points in the x axis (i.e. the embolism resistance value at which there is
304
a change in the co-variation between
Ψ
closeand embolism resistance) and the y axis intercept for this
305
break point (i.e. the global limit for
Ψ
close). Second, we computed the correlation value as well as the
306
linear regression between
Ψ
closeand embolism resistance for the data on either side of the break point.
307
In addition to the results developed in the main manuscript, we provided a separate analysis per group
308
(gymnosperm and angiosperm) and per trait (
ψ
50,
ψ
12,
ψ
gs90,
ψ
tlp) in Table S2. All parameters used in
309
this study are given in a supplementary Excel file.
310
2 Model: description, simulation and validation
311
We used a simplify discrete-time-hydraulic-model (called Sur_Eau) to simulate the time until
312
hydraulic failure for the spectrum of embolism resistance reported in our database, and according to
313
different hypothesis regarding the stomatal regulation of transpiration. Sur_Eau relies on the principle of
314
the original Sperry's model [19] but has been simplified to consider only two resistances (rhizosphere
315
and plant). This simplicity makes easier its applicability with only one stem VC and avoids making
316
assumptions on hydraulic segmentation, a phenomenon that depends on mecha nisms that are still
317
controversial.
318
2.1 Description of the Sur_Eau model
319
Sur_Eau assumes that liquid water flow through the soil-plant system is exactly compensated
320
by gaseous water losses at the plant foliage surface (i.e. steady state condition) which is true at large
321
time steps (>1day) or for small plants. The assumption is also made that leaf and air temperatures are
322
roughly equal, which is reasonable in well coupled canopies. We can then write :
323
𝐸 = 𝑔
𝑙× 𝑉𝑃𝐷 = 𝑘
𝑠𝑙× (𝛹
𝑠𝑜𝑖𝑙− 𝛹
𝑝𝑙𝑎𝑛𝑡)
(2)
where g
lis the leaf conductance to vapor water, VPD is the vapor pressure deficit at the leaf
324
surface,
ψ
soilis the soil water potential,
ψ
plantis plant water potential, and 𝐾
𝑠𝑙is the plant leaf area specific
325
hydraulic conductance over the soil to leaf pathway. g
lincludes both the stomatal, cuticular and boundary
326
layer conductances of the leaf. The control of E through stomata has been treated through different
327
assumptions that are described below (Appendix 3). k
slwas computed as the result of two conductances
328
in series:
329
𝑘
𝑠𝑙=
1
1
𝑘
𝑠𝑜𝑖𝑙+
1
𝑘
𝑝𝑙𝑎𝑛𝑡(3)
where
𝑘
𝑠𝑜𝑖𝑙is the hydraulic conductance of the soil to root surface pathway and
𝑘
𝑝𝑙𝑎𝑛𝑡the
330
hydraulic conductance of the whole plant (i.e. from the roots to the leaves).
331
𝑘
𝑝𝑙𝑎𝑛𝑡was allowed to vary only to account for loss of hydraulic conductivity caused by xylem
332
embolism [55] :
333
𝑘
𝑝𝑙𝑎𝑛𝑡= 𝑘
𝑃𝑖𝑛𝑖(1 − 𝑃𝐿𝐶)
(4)
where 𝑘
𝑃𝑖𝑛𝑖is the initial (i.e pre-drought) plant hydraulic conductance, and PLC is the percent
334
loss of plant hydraulic conductance due to xylem embolism. PLC is computed at each time step by using
335
the sigmoidal function for the vulnerability curve (VC) to embolism (see equations 1 to 3).
336
The model considers the capacitive effect of xylem embolism and symplasm dehydration. The
337
water freed by air filling of the apoplastic reservoir feeds the water stream of the system and thus dampen
338
the water potential decrease [56]. Following
24, we considered that any change in PLC is followed by a
339
proportional change of the water volume that is freed back to the system:
340
Where W
xvis the amount of water freed to the system and 𝑉
𝑋is the total water filled xylem
341
volume of the plant (m
3) and PLC is defined in Equation 1. 𝑉
𝑋
was computed as:
342
𝑉
𝑋= 𝐸
𝑚𝑎𝑥× 𝐺 × α
𝑓(6)
Where E
maxis the maximum diurnal transpiration, α
𝑓is the apoplasmic fraction of the plant and
343
G is the ratio of the total amount of water in the xylem conduits of a tree (i.e. apoplasmic volume) to the
344
maximum diurnal transpiration. The capacitive effect of cavitation on plant survival is mainly sensitive to
345
G factor and its range of variation. The effect of G on cavitation dynamics is discussed in
24. We also
346
accounted for the capacitive effect of symplasm dehydration (i.e. the water released by the symplasmic
347
tissue
𝑊
𝑠𝑣) by using the same formulation as for cavitation (Equation 6). Computations were based on
348
the symplasmic fraction (1- α
𝑓) of the plant and PLC was replaced by the relative water content of the
349
symplasm (R
s). R
swas computed from
ψ
leafby using the pressure volume curve equations (Appendix
350
3).
351
The variations of the soil and the rhizophere conductance (𝑘
soil), as well as the mean soil water
352
potential in the root zone are computed with Van-Genuchten-Mualem equations [33,57] from the
353
unsaturated hydraulic conductivity of the soil, scaled to the rhizophere according to the Gardner-Cowan
354
formulation [58,59]. The rhizophere conductance (𝑘
soil) can be expressed as:
355
𝑘
soil= 𝐵 ∙ 𝐾
soil(𝛩)
(7)
where K
soilis the unsaturated hydraulic conductivity of the soil at given water content (𝛩) or water
356
potential (see below), and B is the root density conductance factor that accounts for the length and
357
geometry of the root system. B is based on the implicit assumption of a uniform roots distribution in a
358
soil layer following the Gardner-Cowan formulation
28. B is also called the “single root” approach [60] as
359
it is equivalent to assuming that plant water uptake occurs from a unique cylindrical root that has access
360
to a surrounding cylinder of soil :
361
𝐵 =
2𝜋𝐿
𝑎ln (
𝑏
𝑟
)
with 𝑏 = 1
√𝜋 𝐿
𝑣⁄
(8)
where 𝐿
𝑎is the root length per unit area, 𝑟 is the mean root radius, and 𝑏 is the half of mean
362
distance between neighboring roots. 𝑏 can be evaluated from 𝐿
𝑣, the root length per unit soil volume.
363
k
soildecreases with decreasing 𝛹
soilbecause of the displacement of water filled pores by air, as capillary
364
forces linking water to soils particles fail with increasing tension, thus creating dry non-conductive zones
365
in the rhizosphere. The parametric formulation of
25for the water retention curve was used in combination
366
with the equation of Mualem (1976)
26to compute 𝛹
soil