Automatic Quantifications of Dynamics of Genetic Circuits in a
Single Cell in Chemostat
Hsin-Ho Huang and Domitilla Del Vecchio
Massachusetts Institute of Technology
Contents
1 INTRODUCTION 1
1.1 Overview of the procedure . . . 2
2 MATERIALS 3 2.1 REAGENTS . . . 3 2.2 EQUIPMENT . . . 3 2.3 REAGENTS SETUP . . . 5 3 PROCEDURE 5 3.1 Locating equipment . . . 5
3.2 Modifying the incubator . . . 5
3.3 Building multiplex stirred tank reactor (STR) . . . 6
3.4 Modifying the autosampler . . . 6
3.5 Making devices for dilution . . . 7
3.6 Making humidifier and air supply . . . 7
3.7 Assembling the whole setup . . . 8
3.8 Setting up remote control . . . 8
3.9 Setting flow cytometer . . . 8
3.10 Making feed tubing for chemostat . . . 8
3.11 Preparing and running Chemostat experiments . . . 9
3.12 Ending the experiments . . . 10
4 TIMING 14
5 TROUBLESHOOTING 14
6 ANTICIPATED RESULTS 14
Abstract
Modular design of genetic circuits requires iterations of experimental and theoretical efforts to make the design process reliable and the resulting behaviors predictable. This technical report demonstrates a fully automatic experiment procedure by using the MSP FlowCytoPrep 5000 Sample Prep system to deliver samples prepared from multiplex miniature stirred tank reactors (Flexostat) to the flow cytometer BD Accuri C6 to quantify dynamics of an transcription activator cascade in a single cell in chemostat.
1
INTRODUCTION
Realizing modular design to make genetic circuits predictable and robust is a great challenge in the field of synthetic biology [1]. Simple genetic modules such as toggle switches [2], oscillators [3,4,5], and cascades [6] can function well in isolated. Further interconnecting these modules to program more complicated
behaviors often do not succeed. Failures have been attributed to the context-dependence problem in bio-logical systems [7,8]. Functions of biological parts, modules, and systems will alter in different contexts such as flanking genetic sequences, interacting regulatory modules, environment conditions, respectively. Solutions beyond developing better biological parts were proposed to insulate context-dependence and to enhance modularity in a rigorous engineering framework [9, 10]. To validate the predictions from this framework to achieve modular designs, this technical report provides an fully automatic experiment procedure to quantify dynamics of genetic circuits in controlled environment conditions.
Dynamics of genetic circuits were constrained by the growth of bacterial cells [11]. It has been well-known that during the balanced exponential growth, the mass fractions of DNA, RNA, and protein are dependent on the growth rate of host cells, not on the different medium compositions which support the same growth rate [12]. That is, at the same growth rate, cells of the same bacterial strain have same amount of cellular resources such as RNA polymerases (RNAPs) and ribosomes to support growth. In addition, over-expression of a synthetic genetic circuit can cause inhibitory effect on growth [13] and re-allocation of proteomic resource [14]. In one of context-dependence problems, behaviors of a synthetic genetic circuit change because of the competition with endogenous genetic circuits for common cellular resources. Therefore, it is essential to control the same exponential growth rate, for example, to study how the resource competitions affect the dynamics of a synthetic genetic circuit regulated by different concentrations of its chemical effector(s). In this report, we adapted the ’Flexostat’ design [15] to build multiplex miniature STRs to run chemostat to maintain a constant growth rate in 16 different induced conditions simultaneously for a transcriptional activator cascade.
Automatic flow cytometry is suitable for analyzing dynamics of genetic circuits. Flow cytometry has been broadly used in life science and biotechnology [16]. It enables rapid analysis of single cells in large amounts to obtain cell sizes, granularity of cells, and fluorescence intensities simultaneously. These data presents as a distribution in the cell population and they allows the statistic analysis of the signal intensity from a geometric mean value and noise level from the CV value of a (sub-)population. Automation can increase throughput of the measurements. It requires to deliver samples to the instrument in a right place and at a right time. Generally, the method is based on either a microtiter plate or a flow injection analysis (FIA) [17]. In order to achieve a fully automatic monitoring of dynamics of genetic circuits in cell growth in a STR, we present a FIA-based protocol to use a commercial product called FlowCytoPrep 5000 Sample Prep system to sample and dilute cells without intervention. This is the first protocol demonstrating a fully automation of flow cytometry measurements from a more than three multiplex STRs.
1.1
Overview of the procedure
Fabrication
The procedure to assemble this fully automatic system starts from locating three subsystems (the STRs, the flow cytometer, and the autosampler) in a proper location. By using a miniature STR, it is possible to accommodate all 16 STRs in an incubator. The selected model of incubator features remote control to change and monitor temperature ranging from ambient+8◦C to 65◦C. In order to maintain temperature at 30◦C, it is necessary to install cooling modules; this is more cost effective than finding a model with both remote control and cooling function. STR fabrication follows the Flexostat construction manual [15]. We choose a commercial FlowCytoPrep 5000 Sample Prep system as the autosampler enabling this fully automatic system. Two major points of the performance were concerned: sample dilution and sampling time. To keep flow cytometry measurements within the linear range of events rate and ideally around 1000 events/µL, dilution range from 4-fold to 60-fold is usually required. To sample from multiplex STR, fast sampling time including the dilution step is crucial to achieve reasonable good time resolution of data points. We made minimal modifications on the FlowCytoPrep 5000 to meet our performance requirements. Air supply through a humidifier is necessary to prevent dehydrating the medium in a STR.
Measurements
This fully automatic system is composed of three subsystems:the STR, the flow cytometer, and the autosampler. Key aspects about usage were summarized as followed. Using STRs mainly follows the Flexostat manual [15]. OD measurement is temperature sensitive. Blank the OD value only when the temperature reaches the set value. OD measurement is also sensitive to the tube position. For this, an additional tubing for inoculation is inserted through the stopper of a STR to avoid untended movements during inoculation. Because ’Run with limits’ function is disable in the remote control mode of the flow cytometer Accuri C6, threshold setting is crucial to increase signal-to-noise ratio, especially for E. coli whose cell size is small. Use ’backgating’ technique to identify particles of interest and confirm the threshold setting [18]. The autosampler protocol (Table 1) can divide into sampling, diluting, injecting, and cleaning parts. One can develop each part individually and compile together to speed up the procedure.
2
MATERIALS
2.1
REAGENTS
• Na2HPO4· 7 H2O • KH2PO4 • NaCl • NH4Cl • Glucose • Thiamine hydrochloride • Casamino acids • MgSO4· 7 H2O • CaCl2· 2 H2O • Kanamycin • Ampicillin • Bleach • Ethanol • Sterile water • Silicone sealant• E. coli JTK160J strain [19] transformed with a transcriptional activator cascade (Figure 7a) on the ColE2 plasmid to ex-press green fluorescent protein (GFP) in the presence of inducers sodium salicylate (SAL) and N -hexanoyl-L-homoserine lac-tone (AHL).
2.2
EQUIPMENT
• Flow cytometer (BD, Accuri C6)
• Miniature stirred tank reactor (Flexostat [15])
– stainless steel 316 hypodermic tube (14 Gauge, 0.083” OD, 0.063” ID, 0.01” wall; Amazon.com, part no. B000FN1R4K)
– silicone tubing
• Autosampler (MSP, Model 5000 FlowCytoPrep sample prep system) – The sofeware (v.3.5.6, Beta 11)
– Polytetrafluoroethylene (PTFE) tubing (1/16” OD, 0.030” ID; VICI, product no. TTF-130) • Incubator
– Air forced incubator (155 L; VWR, cat. no. 414005-124)) – Cooling module
∗ Peltier Thermo-Electric Cooler Module and Heatsink assembly (12V 5A; Adafruit, ID:1335) ∗ Female DC power adaptor (2.1 mm jack to screw terminal block; Adafruit, ID:368)
∗ Switching power supply (12V 5A; Adafruit, ID:352)
∗ Heat sink thermal tape (80 mm-by-80 mm; Adafruit, ID:1468)
∗ Aluminum heatsink cooling fin (150 mm×60 mm×25 mm; Amazon.com , B00N42CWPW) • Fluid handling for chemostat
– 16-channel pump
∗ Masterflex L/S Digital Drive (Cole-Parmer, cat. no. 07522-30)
∗ L/S 8-channel multichannel pump heads (Cole-Parmer, cat. no. 07535-08) ∗ two-stop silicone tubing (L/S 13; Cole-Parmer, cat. no. 06421-13)
– Feed reservoir
∗ 250 mL Transfer Media Bottles with hose barb and GL-45 vented cap (Chemglass, CLS-1423-250)
∗ Polypropylene Open Top Cap with GL-45 GPI thread (Chemglass, CLS-1481-21) • Vortex Mixer (VWR, cat. no. 58816-121)
• Powerswitch tail 2 (Adafruit, ID:268) • BNC wire (Digi-Key, cat. no. 314-1189-ND) • Needle file set (TEKTON 6655; Amazon.com) • Humidifier
– Glass tube (5 mm OD , 6” long; Home Science Tools, cat. no. CE-TUBEG6) – Erlenmeyer flask (Pyrex 250 mL; Home Science Tools, cat. no. CE-FLAS250) – Rubber stopper (#6.5, 2-hole; Home Science Tools, cat. no. CE-STOP06B) • Fluid management components
– female Luer thread style to 200 series barb, 1/16” ID tubing, Red nylon (Value Plastic, cat. no. FTLL210-3)
– female Luer thread style to 200 series barb, 1/16” ID tubing, blue nylon (Value Plastic, cat. no. FTLL210-5)
– male Luer integral lock ring to 200 series barb, 1/16” ID tubing, white nylon (Value Plastic, cat. no. MTLL210-1)
– male Luer integral lock ring to 500 series barb, 1/16” ID tubing, green nylon (Value Plastic, cat. no. MTLL004-4)
– male Luer integral lock ring to 300 series barb, 1/4” ID tubing white nylon (Value Plastic, cat. no. MTLL360-1)
– male Luer integral lock ring to 200 series barb, 1/8” ID tubing, white nylon (Value Plastic, cat. no. MTLL230-1)
– femal Luer thread style to 200 series barb, 1/8” ID tubing, red nylon (Value Plastic, cat. no. FTLL230-3)
– Y tube fitting with 200 series barb, 1/8” ID tubing, black nylon (Value Plastic, cat. no. Y230-2)
– acetal plastic tubing clamps (autoclavable; VWR, cat. no. 63022-405) • Tubing
– White silicone rubber tubing (1/4” ID and 3/8” OD; Amazon.com, cat. no. B000FOWGG2) – Platinum-cured silicone tubing (1/8” ID and 1/4” OD; VWR, cat. no. 32829-166)
– Platinum-cured silicone tubing (1/16” ID and 1/8” OD; VWR, cat. no. 32829-174) • UHB210 10-port USB 2.0 Hub (Kinivo; Amazon.com, cat. no. B00C0XZ7R6)
2.3
REAGENTS SETUP
Stock solutions• 1 L of M9 salts (10x)
128 g Na2HPO4· 7 H2O, 30 g KH2PO4, 5 g NaCl, and 10 g NH4Cl are dissolved in deionized water to a final volume of 1 L and autoclaved.
• 500 mL of 20 % (w/v) glucose
100 g glucose is dissolved with 500 mL deionized water and autoclave. • 500 mL of 10 % (w/v) casamino acids
50 g casamino acids are dissolved with 500 mL deionized water and autoclave. • 500 mL of 30 mm thiamine hydrochloride
5 g thiamine hydrochloride is dissolved in deionized water to a final volume of 500 mL and filtrated with a 0.22µm filter.
• 250 mL of 1 m MgSO4
61.5 g MgSO4· 7 H2O is dissolved in deionized water to a final volume of 250 mL and autoclave • 250 mL of 0.1 m CaCl2
3.675 g CaCl2 is dissolved in deionized water to a final volume of 250 mL and autoclave M9 supplemented medium
1x M9 salts, 1 mm thiamine hydrochloride, the indicated concentration of glucose, 0.2 % casamino acids, 2 mm MgSO4, 0.1 mm CaCl2
Antibiotics in the medium
50µg mL−1 ampicillin and 25µg mL−1 kanamycin
3
PROCEDURE
3.1
Locating equipment
timing ∼ 30 min
1. Find a bench area in 90 cm-by-150 cm to put the flow cytometer and the autosampler.
2. Find a ground area in 90 cm-by-90 cm to situate the incubator standing beside the bench and next to the flow cytometer.
3. Position the flow cytometer to make its Sample Introduction Probe (SIP) being as close as possible to the exhaust duct of the incubator. K critical step This contributes to a faster sampling time due to a shorter tubing length to transfer liquid.
3.2
Modifying the incubator
timing ∼2 h
4. To maintain the temperature at 30◦C, the incubator needs to install additional cooling modules. 5. Remove the respective covers of the incubator to disclose the internal circulation fan in the inner
chamber and the backside.
7. Drill two holes (3 mm OD) on the heat sink cooling fin and on the inner chamber wall of the incubator.
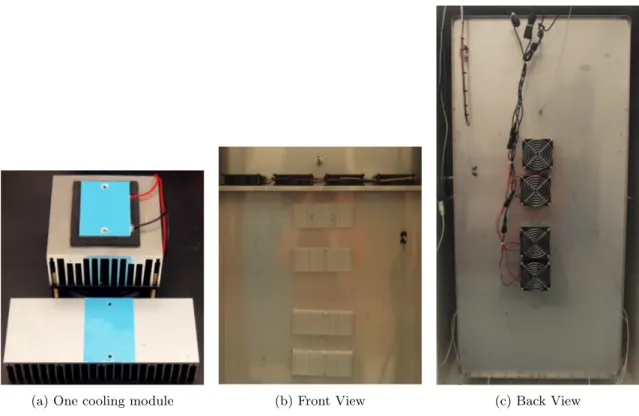
8. Screw a heat sink cooling fin on the inner side and a cooling module on the outer side with two 25 mm M2.5 machine screws (Figure 1band1c).
9. Repeat the steps6-8 for other 3 cooling modules.
10. Close the cover of the inner chamber. Leave the backside of the incubator open for cooling.
3.3
Building multiplex STR
timing ∼ 1 week
Building Flexostat chambers
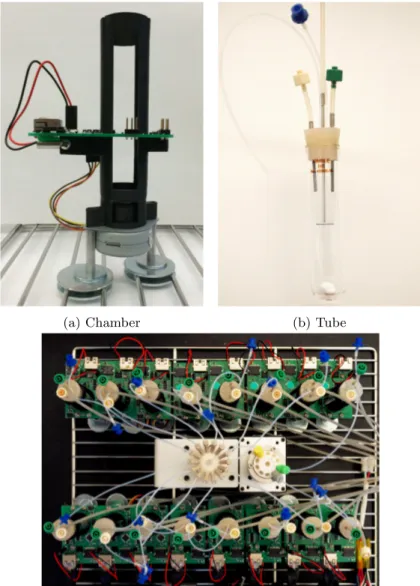
11. Build a Flexostat chamber (Figure3a) according to its fabrication[15]. Make 16 chambers. 12. Screw the chambers on the shelf of the incubator with stacked washers and 6-32, 1/2” machine
screws (Figure3a).
Assembling glass tubes
13. Make a tube stopper with three ports (Figure3b) according to the fabrication[15].
14. Take a stainless steel tube and punch it through the tube stopper to make two holes beside the three ports.
15. Cut one piece of PTFE tubing 30 cm in length and insert it through one punched hole. This tubing is for sampling.
16. Cut one piece of PTFE tubing 13 cm in length and insert it through another punched hole. One side connects to a ’blue’ female Luer-to-barb with a short silicone tubing. This tubing is for inoculation. 17. Cut a silicon tubing 80 cm in length and connect to a 9.5-cm stainless steel tube. The stainless
steel tube inserts into the middle one of the three ports. This is for waste effluent.
18. Cut a silicon tubing 3 cm in length. One side connects to a ’white’ male Luer ’integral lock ring to barb’ and another side connects to a 5-cm stainless steel tube. The stainless steel tube insert into either one of the other two available ports. This is for feeding fresh medium.
19. Repeat the step18but using a ’green’ male Luer. The finished tubing is for air supply.
3.4
Modifying the autosampler
timing ∼ 2 h
20. Open the cover of the autosampler and disconnect the power cable, the serial cable, and all tubing of the stream selector (Figure 2) and relocate the stream selector to the proximity of STR (Figure 3c and 3d). The stream selector’s head faces up to shorten the tubing length to the STR. ! caution When the sample selector and the stream selector orient in this position, it is crucial to make sure no solution leaking out from the ports. Otherwise, liquid might leak into the electronic part of the selectors and cause shortcut.
21. Connect the stream selector to the autosampler with extended power and serial cables.
22. Cut one piece of PTFE tubing 12.4 cm in length. Make one end with a Cheminert 1/16” PEEK hex head nut and a ferrule and another end with a 1/4-28 Cheminert flangeless fitting.
23. Connect the port #2 of the stream selector to the central port of the sample selector with this 12.4 cm PTFE tubing (3c).
24. Connect the capacity loop of the autosampler to the central port of the stream selector.
25. Connect the port #10 of the stream selector to the SIP of the flow cytometer via a 3-way tee-junction with a 57-cm PTFE tubing. This 3-way tee-tee-junction connects the SIP, the 57-cm PTFE tubing, and a solenoid pinch valve which will close only when the autosampler inject sample into the flow cytometer. ! cautionThe ports #2 and #10 are the default ports used by the commands of the autosampler software.
26. The sample selector connects to the autosampler via a USB port and has an independent power. 27. All connections go through the exhaust duct of the incubator.
3.5
Making devices for dilution
timing ∼ 2 h plus drying overnight Remote control of a Vortex Mixer28. Connect the ’powerswitch tail 2’ to the power cable of a Vortex Mixer and to a BNC port via a BNC wire and to a socket.
Liquid handling
29. Cut a PTFE tubing 33 cm in length and make 1/4-28 frangeless fitting on one end.
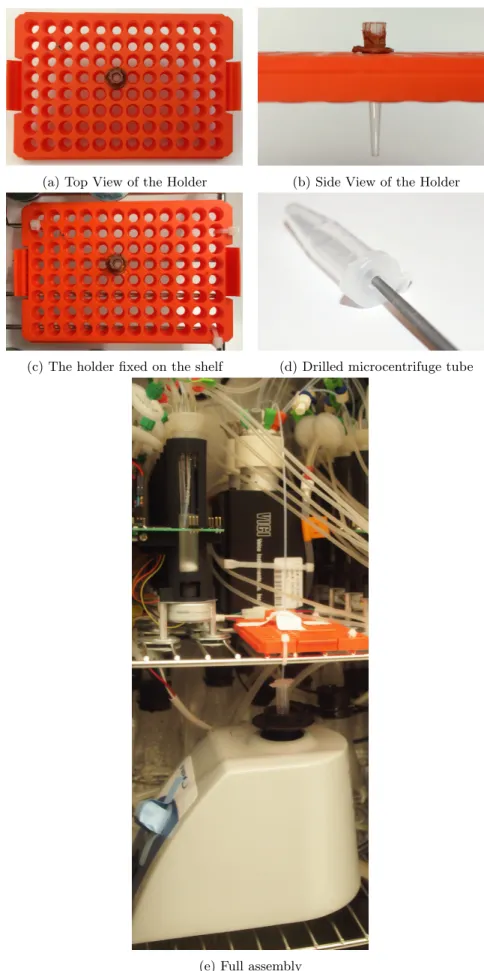
30. Cut a 200-µL tip to make its tip wider allowing this 33-cm PTFE tubing passing through neatly. 31. To make a holder of this tubing for dilution, fix a 200-µL tip rack beside the stream selector on
the same shelf where STRs fix on in the incubator.(Figure 4a,4b, and4c)
32. Glue this tip on a proper position of the rack with silicone sealant. timing wait for overnight 33. Drill a hole in the center of a microcentrifuge tube’s cap with a needle file (Figure4d). The hole
allows this PTFE tubing passing through neatly.
34. Connect this tubing to the port #9 of the stream selector and to the drilled tube (Figure 4e). ! caution This tubing should reach the bottom of the microcentrifuge tube.
3.6
Making humidifier and air supply
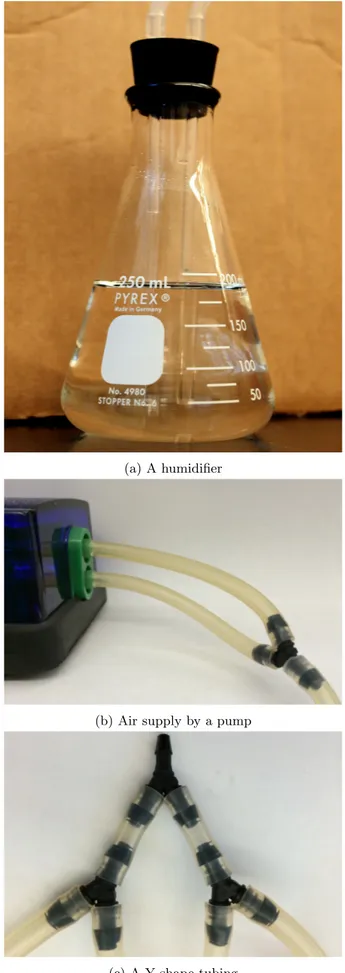
timing ∼ 2 h35. Insert a ∼6-inch and a ∼3-inch glass tube (5 mm OD) to a #6.5 rubber stopper and assemble this to a Erlenmeyer flask (Figure 5a).
36. Fill distilled water up to the level not exceeding the short glass tube (5 mm OD). Repeat the step 35-36for other 7 flasks.
37. Cut eight pieces of a silicon tubing 6 cm in length. 38. Cut a piece of a silicon tubing ∼1 m in length.
39. Connect these tubing with Y tube fittings. The side with two tubing connects to the pump (Figure 5b). The side with four tubing (Figure5c) connects to the long glass tubes of four humidifiers with four silicone tubing in a respective proper length. The ∼1 m tubing goes through the exhaust duct of the incubator.
40. Humidifier flasks are on the same shelf as the vortex mixer are.
41. Cut a silicone tubing in a proper length. One side connects to the short glass tube of a humidifier and the other side connects to a 0.45µm PTFE filter to provide filtrated air into a STR.
3.7
Assembling the whole setup
timing ∼30 min42. Put the shelf of STR on the layer close to the exhaust duct of the incubator. K critical step A closer location can shorten the tubing length between the stream selector and the SIP.
43. Label the respective tubing of the humidifiers with the same number of the respective STR. 44. Put the shelf of vortex mixer and humidifiers below the STRs.
45. Put the respective tubing of the humidifiers through the shelf and beside the respective STR. 46. Put the 33-cm PTFE tubing through the holder to reach the bottom of a drilled microcentrifuge
tube sitting in the cup head of the vortex mixer (Figure4e).
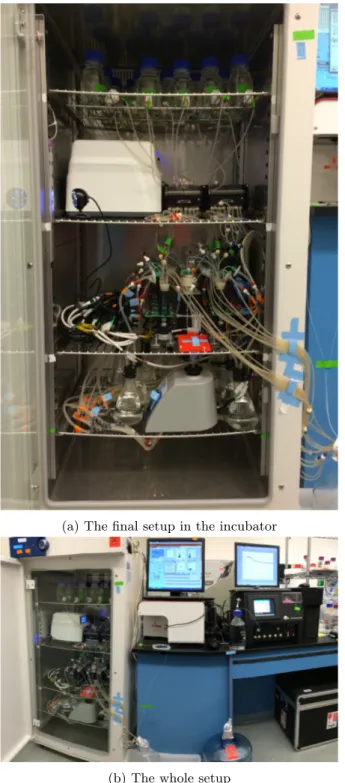
47. Put two shelves above the STRs for holding the multi-channel peristaltic pump and the reservoir bottles, respectively (6a).
3.8
Setting up remote control
timing ∼15 min48. Apply three static IPs from your institute for the computers controlling the STRs, the flow cy-tometer, and the autosampler, respectively.
49. Follow the manual of FlowCytoPrep 5000 system to set up remote control on the Accuci C6 flow cytometer via static IPs.
50. Install a proper software (e.g. Malwarebytes) to protect static IPs from any untended access. ! caution If an access to either computer occurs at the moment when the autosampler sends a command to the flow cytometer, it blocks the remote control.
51. Set up the Microsoft Windows ’Remote Desktop Connection’ and/or the App ’Microsoft Remote Desktop’ to the respective computers. This allows you to monitor the experiments outside the lab from a laptop or a mobile phone.
3.9
Setting flow cytometer
timing ∼1 h52. Set ’flow rate’ as 74µL min−1and ’core size’ as 13µm. ! cautionThe flow rate needs to synchronize the inject rate of the autosampler. Otherwise, a tailing pattern would be observed in a FSC vs SSC dot plot. Due to an accurate M series pump (VICI, Valco Instrument Co. Inc.) used by the autosampler, the flow rate should synchronize to the inject rate in a real test, not by setting the value.
53. Set the threshold. For example, a dual threshold as FSC=3000 and SSC=2000 or a single threshold as FSC=7000 according to cells growing in a control experiment.
54. Identify particles of interests by ’backgating’ using fluorescence signal to confirm threshold setting.
3.10
Making feed tubing for chemostat
timing ∼30 min making tubing for chemostat
55. Extend both ends of a two-stop silicone tubing of the multi-channel peristaltic pump with silicone tubing (1/16” ID and 1/8” OD) in a proper length by joining male and female Luer-to-barb fittings (MTLL210-1 and FTLL210-3). Both ends of the extended tubing connects to female Luer-to-barb fittings (FTLL210-3).
56. Load a tubing clamp to a ∼8-cm silicone tubing (1/4” ID and 3/8” OD) and connect this tubing to the bottom hose outlet of a reservoir bottle and to a Luer-to-barb fitting (MTLL360-1).
3.11
Preparing and running Chemostat experiments
timing ∼22 h cell cultivation and ∼4 h operations during prepartiontiming∼15 min daily maintenance to supply sheath solution and discard waste solution of Accuri C6 flow cytometer during a run
Sterilization
57. Feed tubing, 250 mL feed reservoir bottles, and glass tubes with stoppers including all tubing on it were sterilized in an autoclave.
Culture preparation
58. A 15 % (v/v) glycerol stock of the E. coli construct was streaked on an LB agar plate. 59. Single colonies form after 12 hours at 37◦C.
60. A single colony was inoculated into a 50 mL M9 supplemented medium containing 1 g L−1 glucose in a 125 mL E-flask.
61. The flask was incubated in a horizontally orbiting shaker at 200 rpm, 30◦C for 9-10 hours. timing When waiting for culture to grow, do the following preparation steps62-81.
Medium and tube preparation
62. Prepare 4.5 L M9 supplemented medium containing 0.2 g L−1 glucose and 1 mm SAL in a 5-L reservoir bottle.
63. Distribute 250 mL medium each in sixteen 250-mL feed reservoirs.
64. Take out 250µL medium and add 250 µL AHL stock solution for each feed reservoir to reach the respective AHL concentration.
65. Distribute 15 mL medium each in sixteen 30-mL glass tubes.
66. Put on the stopper and adjust vertically the stainless steel tube for effluent right above the medium surface in order to maintain constant volume during chemostat.
67. Mark the position of stopper and medium surface on a glass tube.
68. Open the stopper and take out 1 mL medium and close the stopper again for each glass tube. STR system preparation
69. Check and fill water into the humidifiers.
70. Load the extended two-stop tubing and and latch the occlusion bed of the multi-channel peristaltic pump head outside the incubator.
71. Place the multi-channel peristaltic pump on the shelf of the incubator and connect to its power. 72. Connect the extended two-stop tubing to the reservoir bottle.
73. Fill feeding media in the extended two-stop tubing by pumping. 74. Put a glass tube containing 14 mL medium in a Flexostat chamber.
75. Connect the extended two-stop tubing to the feeding port of a glass tube via the respective Luer fittings.
76. Connect air supply tubing and sampling tubing. 77. Repeat steps74-76for other 15 glass tubes.
78. Direct the effluent tubing to a 5-L waste reservoir. K critical stepThe opening of each effluent tubing must be always vertically above the waste solution to make effluent unobstructed.
79. Turn on the temperature control of the incubator and the power of four cooling modules to maintain 30◦C.
80. Execute the Python script of each STR.
81. Blank the OD value of each STR when temperature reaches equilibrium. ! cautionOD measure-ment is temperature-sensitive.
Inoculation and running chemostat
82. When the step61ends, cells were spun down at 5000 rpm for 10 min.
83. Cell pellet was washed and re-suspended in 50 mL the same medium used in the chemostat experi-ment as prepared in the step62. The cell suspension usually has an OD 600 nm value between 0.5 and 0.6.
84. Inoculate 1 mL cells by using a syringe to connect to the inoculation port of a glass tube.K critical
step Reserve and use extra air in the syringe to purge residual cells in the tubing completely into
the reactor. Being cautious of not moving a STR during inoculation. 85. Repeat the step84for other 15 glass tubes.
86. The initial OD 600 nm of the chemostat experiment is usually between 0.03 and 0.04.
87. Start the 16-channel peristaltic pump at the rate of 0.05 mL h−1to achieve the dilution rate 0.2 h−1 when the working volume of the chemostat experiments is 15 mL.
88. Initiate the remote control mode of the flow cytometer.
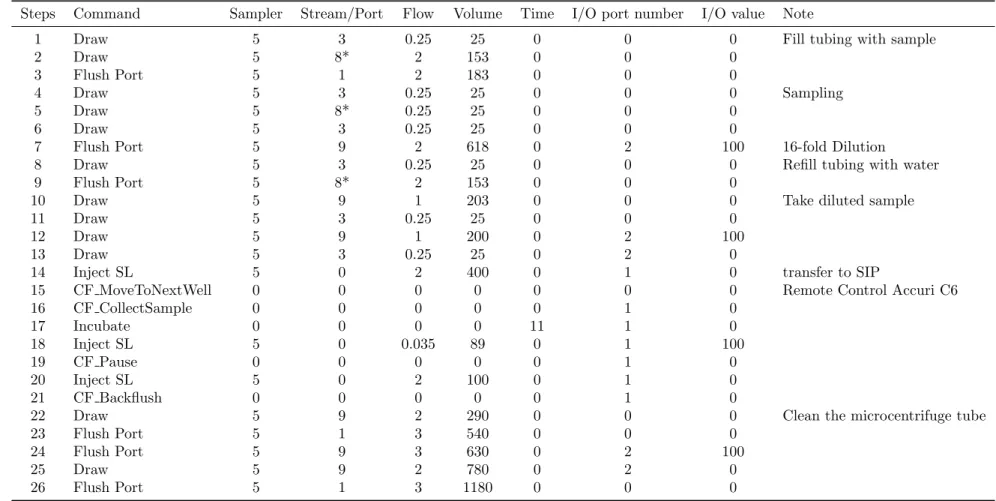
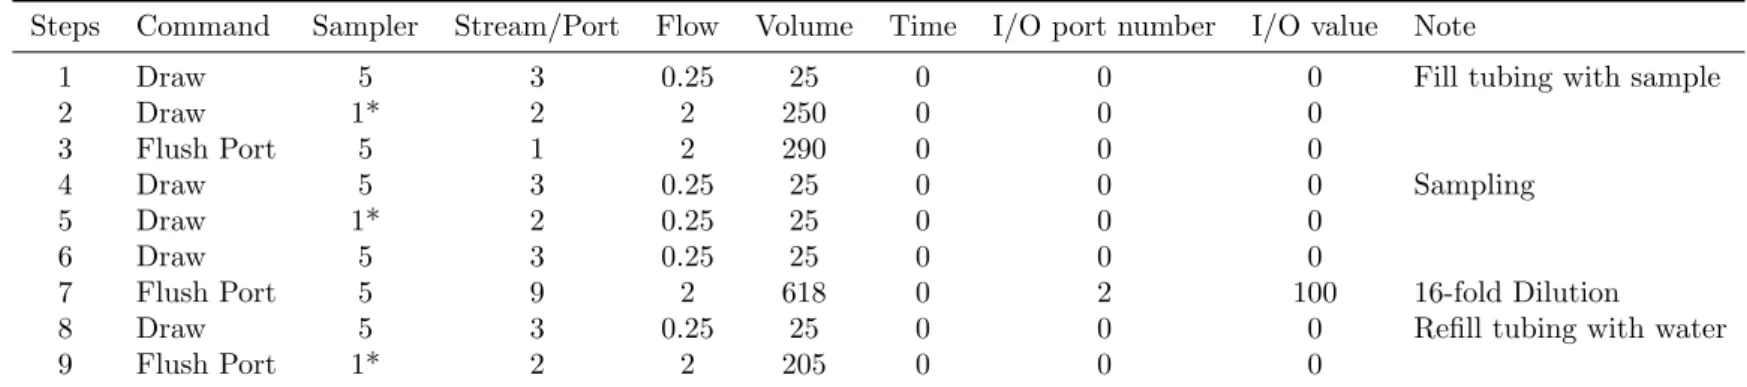
89. Start the autosampler protocol compiled with the autosampler protocol 1 and 2 (Table 1 and Table 2) for 16 glass tubes. The ports #1-#14 of the ’sample selector’ and the ports #7 and #8 of the ’stream selector’ are used for sampling. ! cautionThe mobile phase liquid of the autosampler is distilled water filtrated with a 0.22µm filter.
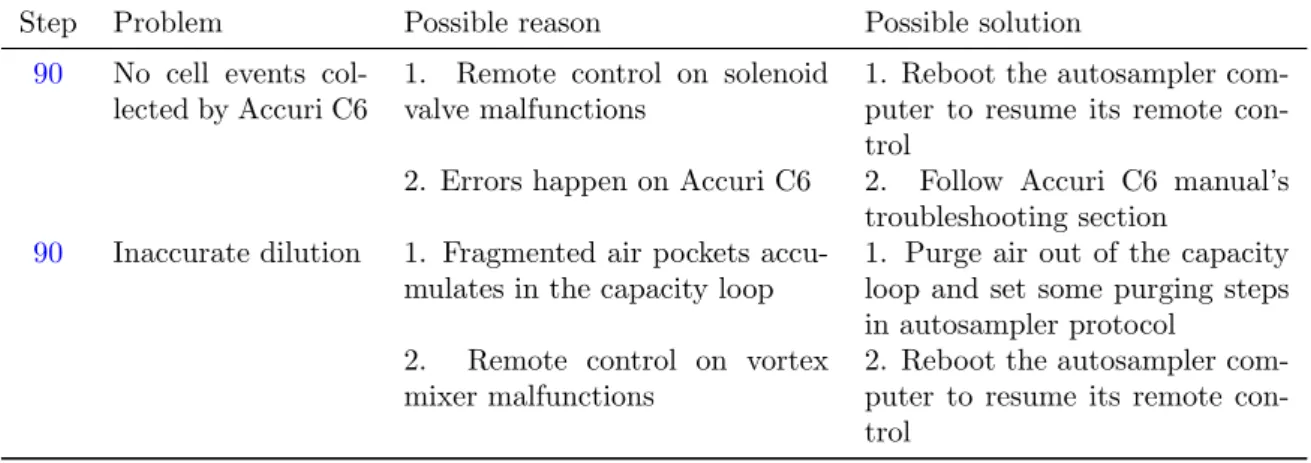
90. This fully automatic system is running (Figure6b). ? troubleshooting
3.12
Ending the experiments
timing several hours to overnight
91. Turn off the Python scripts and switch off the power of STR. 92. Exit the remote control mode of the flow cytometer and save data. 93. Stop the compiled autosampler protocol.
94. Run a cleaning protocol of the autosampler using 70 % ethanol, 10 % bleach, and mobile phase water to clean all tubing in the system, respectively. The bleaching step needs at least 20 min incubation.
95. Clean the feed tubing by disconnecting them from the 250 mL reservoir bottles, merging this end of tubing into distilled water, running the pump at 2 mL min−1 for 10 min, and taking out from water while running the pump to drain water out of the feed tubing.
96. Steps94and95can run simultaneously while keeping air supply on to prevent liquid overflowing in a STR.
98. Disconnect all tubing from the sample selector, the stream selector, the humidifiers, the multi-channel pump.
99. Take the glass tube out of a Flexostat chamber and loose the stopper of the glass tube. 100. Sterile these glass tubes with stoppers and the 5-L waster reservoir in an autoclave.
Table 1: Autosampler Protocol 1*.
Steps Command Sampler Stream/Port Flow Volume Time I/O port number I/O value Note
1 Draw 5 3 0.25 25 0 0 0 Fill tubing with sample
2 Draw 5 8* 2 153 0 0 0
3 Flush Port 5 1 2 183 0 0 0
4 Draw 5 3 0.25 25 0 0 0 Sampling
5 Draw 5 8* 0.25 25 0 0 0
6 Draw 5 3 0.25 25 0 0 0
7 Flush Port 5 9 2 618 0 2 100 16-fold Dilution
8 Draw 5 3 0.25 25 0 0 0 Refill tubing with water
9 Flush Port 5 8* 2 153 0 0 0
10 Draw 5 9 1 203 0 0 0 Take diluted sample
11 Draw 5 3 0.25 25 0 0 0
12 Draw 5 9 1 200 0 2 100
13 Draw 5 3 0.25 25 0 2 0
14 Inject SL 5 0 2 400 0 1 0 transfer to SIP
15 CF MoveToNextWell 0 0 0 0 0 0 0 Remote Control Accuri C6
16 CF CollectSample 0 0 0 0 0 1 0 17 Incubate 0 0 0 0 11 1 0 18 Inject SL 5 0 0.035 89 0 1 100 19 CF Pause 0 0 0 0 0 1 0 20 Inject SL 5 0 2 100 0 1 0 21 CF Backflush 0 0 0 0 0 1 0
22 Draw 5 9 2 290 0 0 0 Clean the microcentrifuge tube
23 Flush Port 5 1 3 540 0 0 0
24 Flush Port 5 9 3 630 0 2 100
25 Draw 5 9 2 780 0 2 0
26 Flush Port 5 1 3 1180 0 0 0
*, This protocol uses the indicated port (e.g. #8) of the ’stream selector’ to do sampling. The ports #1, #2, #3, #9, and #10 are reserved for expelling waste, connecting to the ’sample selector’, drawing air, diluting sample, and injecting sample, respectively. The ports #4-#8 are available for sampling.
Table 2: Autosampler Protocol 2*.
Steps Command Sampler Stream/Port Flow Volume Time I/O port number I/O value Note
1 Draw 5 3 0.25 25 0 0 0 Fill tubing with sample
2 Draw 1* 2 2 250 0 0 0
3 Flush Port 5 1 2 290 0 0 0
4 Draw 5 3 0.25 25 0 0 0 Sampling
5 Draw 1* 2 0.25 25 0 0 0
6 Draw 5 3 0.25 25 0 0 0
7 Flush Port 5 9 2 618 0 2 100 16-fold Dilution
8 Draw 5 3 0.25 25 0 0 0 Refill tubing with water
9 Flush Port 1* 2 2 205 0 0 0
*, This protocol replaces the first 9 steps of the protocol 1 and use the indicated port (e.g. #1) of the ’sample selector’ to do sampling. There are 14 ports of the ’sample selector’ available for sampling.
4
TIMING
Steps1-3, locating equipment: ∼30 min Steps4-10, modifying the incubator: ∼2 h Steps11-19, building multiplex STR: ∼ 1 week Steps20-27, modifying the autosampler: ∼ 2 h
Steps28-34, making devices for dilution: ∼ 2 h plus drying overnight Steps35-41, making humidifier and air supply: ∼ 2 h
Steps42-47, assembling the whole setup: ∼30 min Steps48-51, setting up remote control ∼15 min Steps52-54, setting flow cytometer ∼1 h
Steps55-56, making tubing for chemostat: ∼30 min
Steps58-81, preparing chemostat experiments: ∼22 h cell cultivation and ∼4 h operations
Steps82-90, running chemostat experiments: ∼15 min daily maintenance to supply sheath solution and discard waste solution for Accuri C6 flow cytometer
Steps91-100, ending the experiments: several hours to overnight
5
TROUBLESHOOTING
Tourbleshooting advice can be found inTable 3.
Table 3: Troubleshooting table.
Step Problem Possible reason Possible solution
90 No cell events col-lected by Accuri C6
1. Remote control on solenoid valve malfunctions
1. Reboot the autosampler com-puter to resume its remote con-trol
2. Errors happen on Accuri C6 2. Follow Accuri C6 manual’s troubleshooting section
90 Inaccurate dilution 1. Fragmented air pockets accu-mulates in the capacity loop
1. Purge air out of the capacity loop and set some purging steps in autosampler protocol
2. Remote control on vortex mixer malfunctions
2. Reboot the autosampler com-puter to resume its remote con-trol
6
ANTICIPATED RESULTS
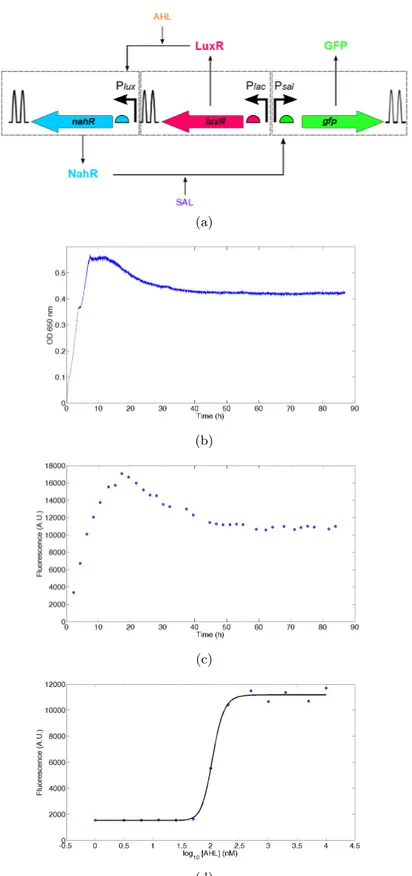
Bacterial growth is on-line monitored every second and recorded every minute by the Flexostat chamber. In chemostat experiments, the growth curve should reach and maintain at a constant OD value. This indicates that the growth rate is equal to the dilution rate (i.e. the culture reaches equilibrium)(Figure 7b). Time course of gene expression is tracked by fully automatic sampling, sample dilution, and sample injection with the FlowCytoPrep 5000 system which remotely controls Accuri C6 flow cytometer to run single-cell fluorescence measurements of the injected sample. In the presented setup, sampling time is about 5 to 7.5 minutes per sample in average. Sampling time would be longer when using higher dilution fold during the sample preparation. The concentration of the reporter protein GFP should reach and remain at a constant level after observing a constant fluorescence intensity (Figure7c). Thanks to the multiplex STR, one can test 16 different chemical effector concentrations simultaneously. The characteristic steady-state dose response curve can be plotted for the genetic circuit (Figure7d).
(a) One cooling module (b) Front View (c) Back View
Figure 1: Installation of cooling modules on the incubator
(a) Chamber (b) Tube
(c) The top view of the connection of STR, sample se-lector, and stream selector
(d) The side view of the connection of STR, sample se-lector, and stream selector
(a) Top View of the Holder (b) Side View of the Holder
(c) The holder fixed on the shelf (d) Drilled microcentrifuge tube
(e) Full assembly
(a) A humidifier
(b) Air supply by a pump
(c) A Y-shape tubing
(a) The final setup in the incubator
(b) The whole setup
(a)
(b)
(c)
(d)
Figure 7: Gene induction of the activator cascade in glucose-limited chemostat (the limiting nutrient glucose concentration is 0.2 g L−1; dilution rate D is 0.2 h−1). (a) Fluorescent protein GFP probes the dynamics of the activator cascade which uses transcriptonal activators LuxR and NahR to activate GFP expression in the presence of inducers AHL and SAL, respectively. (b) Bacterial growth and (c) time course of GFP expression resolved at single-cell level in the medium containing 5µm AHL and 1 mm SAL were monitored by a fully automatic protocol developed in this work. Up to 16 bacterial cultures can be characterized in parallel using this protocol. (d) Dose response in steady state to differnt AHL concentrations when the growth rate was equal to the dilution rate after 50 h.
References
[1] P. E. Purnick and R. Weiss, “The second wave of synthetic biology: from modules to systems,” Nat Rev Mol Cell Biol, vol. 10, no. 6, pp. 410–422, 2009.
[2] T. S. Gardner, C. R. Cantor, and J. J. Collins, “Construction of a genetic toggle switch in Escherichia coli,” Nature, vol. 403, no. 6767, pp. 339–342, 2000.
[3] M. B. Elowitz and S. Leibler, “A synthetic oscillatory network of transcriptional regulators.,” Nature, vol. 403, no. 6767, pp. 335–338, 2000.
[4] M. R. Atkinson, M. a. Savageau, J. T. Myers, and A. J. Ninfa, “Development of genetic circuitry exhibiting toggle switch or oscillatory behavior in Escherichia coli,” Cell, vol. 113, no. 5, pp. 597–607, 2003.
[5] J. Stricker, S. Cookson, M. R. Bennett, W. H. Mather, L. S. Tsimring, and J. Hasty, “A fast, robust and tunable synthetic gene oscillator.,” Nature, vol. 456, no. 7221, pp. 516–519, 2008.
[6] S. Hooshangi, S. Thiberge, and R. Weiss, “Ultrasensitivity and noise propagation in a synthetic transcriptional cascade,” Proc Natl Acad Sci U S A, vol. 102, no. 10, pp. 3581–3586, 2005.
[7] S. Cardinale and A. P. Arkin, “Contextualizing context for synthetic biology - identifying causes of failure of synthetic biological systems,” Biotechnology Journal, vol. 7, no. 7, pp. 856–866, 2012. [8] J. a. N. Brophy and C. a. Voigt, “Principles of genetic circuit design.,” Nature methods, vol. 11,
no. 5, pp. 508–20, 2014.
[9] D. Del Vecchio, “A control theoretic framework for modular analysis and design of biomolecular networks,” Annual Reviews in Control, vol. 37, no. 2, pp. 333–345, 2013.
[10] D. Del Vecchio, “Modularity, context-dependence, and insulation in engineered biological circuits,” Trends in Biotechnology, vol. 33, no. 2, pp. 111–119, 2015.
[11] M. Scott, E. M. Mateescu, Z. Zhang, and T. Hwa, “Interdependence of Cell Growth and Gene Expression: Origins and Consequences,” Science, vol. 330, no. November, pp. 1099–1102, 2010. [12] H. Bremer and P. P. Dennis, “Modulation of chemical composition and other parameters of the cell
by growth rate.,” Neidhardt, F. (ed.). Washington, DC: American Society for Microbiology Press, no. 122, p. 1553, 1996.
[13] H. Dong, L. Nilsson, C. G. Kurland, H. Dong, L. Nilsson, and C. G. Kurland, “Gratuitous over-expression of genes in Escherichia coli leads to growth inhibition and ribosome destruction . These include : Gratuitous Overexpression of Genes in Escherichia coli Leads to Growth Inhibition and Ribosome Destruction,” vol. 177, no. 6, pp. 1497–1504, 1995.
[14] M. Scott, S. Klumpp, E. M. Mateescu, and T. Hwa, “Emergence of robust growth laws from optimal regulation of ribosome synthesis,” pp. 1–14, 2014.
[15] C. N. Takahashi, A. W. Miller, F. Ekness, M. J. Dunham, and E. Klavins, “A Low Cost, Customiz-able Turbidostat for Use in Synthetic Circuit Characterization.,” ACS synthetic biology, 2014. [16] M. Rieseberg, C. Kasper, K. F. Reardon, and T. Scheper, “Flow cytometry in biotechnology,”
Applied Microbiology and Biotechnology, vol. 56, pp. 350–360, Aug. 2001.
[17] “Measurement , Monitoring , Modelling and Control of Bioprocesses,” in Advances in Biochemical Engineering/Biotechnology (C.-f. Mandenius and N. J. Titchener-hooker, eds.), vol. 132, Springer, 2013.
[18] BD Biosciences, “Threshold and Analysis of Small Particles on the BD Accuri C6 Flow Cytometer,” BD Technical Bulletin, 2012.
[19] J. T. Kittleson, S. Cheung, and J. C. Anderson, “Rapid optimization of gene dosage in E. coli using DIAL strains.,” Journal of biological engineering, vol. 5, no. 1, p. 10, 2011.