Publisher’s version / Version de l'éditeur:
Journal of Microscopy, 221, January 1, pp. 17-29, 2006-01-01
READ THESE TERMS AND CONDITIONS CAREFULLY BEFORE USING THIS WEBSITE. https://nrc-publications.canada.ca/eng/copyright
Vous avez des questions? Nous pouvons vous aider. Pour communiquer directement avec un auteur, consultez la première page de la revue dans laquelle son article a été publié afin de trouver ses coordonnées. Si vous n’arrivez pas à les repérer, communiquez avec nous à [email protected].
Questions? Contact the NRC Publications Archive team at
[email protected]. If you wish to email the authors directly, please see the first page of the publication for their contact information.
NRC Publications Archive
Archives des publications du CNRC
This publication could be one of several versions: author’s original, accepted manuscript or the publisher’s version. / La version de cette publication peut être l’une des suivantes : la version prépublication de l’auteur, la version acceptée du manuscrit ou la version de l’éditeur.
For the publisher’s version, please access the DOI link below./ Pour consulter la version de l’éditeur, utilisez le lien DOI ci-dessous.
https://doi.org/10.1111/j.1365-2818.2006.01540.x
Access and use of this website and the material on it are subject to the Terms and Conditions set forth at Bitumen morphologies by phase-detection atomic force microscopy
Masson, J-F.; Leblond, V.; Margeson, J. C.
https://publications-cnrc.canada.ca/fra/droits
L’accès à ce site Web et l’utilisation de son contenu sont assujettis aux conditions présentées dans le site LISEZ CES CONDITIONS ATTENTIVEMENT AVANT D’UTILISER CE SITE WEB.
NRC Publications Record / Notice d'Archives des publications de CNRC:
https://nrc-publications.canada.ca/eng/view/object/?id=2acb275e-4e99-4e9a-a358-37a1c8f19827 https://publications-cnrc.canada.ca/fra/voir/objet/?id=2acb275e-4e99-4e9a-a358-37a1c8f19827
http://irc.nrc-cnrc.gc.ca
Bit um e n m or phologie s by pha se
-de t e c t ion at om ic forc e m ic rosc opy
N R C C - 4 8 1 5 7
M a s s o n , J - F . ; L e b l o n d , V . ; M a r g e s o n , J .
A version of this document is published in / Une version de ce document se trouve dans:
Journal of Microscopy, v. 221, pt. 1, Jan. 2006, pp. 17-29 doi: 10.1111/j.1365-2818.2006.01540.x
Bitumen morphologies
by phase-detection atomic force microscopy
J-F. Masson, V. Leblond, J. Margeson
Institute for Research in Construction, National Research Council Canada, Ottawa, Ontario, Canada, K1A 0R6
Abstract
Bitumen is a complex mixture of hydrocarbons for which the knowledge of microstructure is incomplete. In an effort to detail this microstructure, thirteen bitumens were analyzed by phase detection atomic force microscopy. Based on morphology, the bitumens could be classified into three distinct groups. One group showed fine domains down to 0.1 µm, another showed domains of about 1 µm, and a third group showed up to four different domains or phases of different sizes and shapes. No correlation was found between the AFM morphology and the composition based on asphaltenes, polar aromatics, naphthene aromatics and saturates. A good correlation was found between the area of the “bee-like” structures and the vanadium and nickel content in bitumen, and a good correspondence was found between the AFM groups and the average size of molecular planes made of fused aromatics. The morphology and the molecular arrangements in bitumen thus appear partly governed by the molecular planes and the polarity defined by metallic cations.
Keywords: AFM, PDM, bitumen, asphalt, structure, microscopy, phases, composition, vanadium, nickel, metals, cations.
Introduction
Bitumen is a complex mixture of hydrocarbons that finds many applications (Asphalt Institute, 1989). Despite its use since biblical times, the knowledge of the structure that controls its properties, and its viscoelastic nature in particular, remains incomplete (Speight 1999).
Optical microscopy has been used for more than three centuries to study materials (Baker, 1742), but bitumen never received much attention from the microscopist because of its opacity and its adhesive properties. With the advent of transmission electron microscopy, the network of the heaviest bitumen components, the asphaltenes, was studied after their precipitation from a solvent (Dykstra et al., 1944; Freund and Vajta, 1958; Dickie et al., 1969; Donnet et al., 1973; Peyrot, 1973).
With advances in low light optical microscopy, bitumen can now be studied in its solid-state, without the extraction of its components with solvents. Claudy et al. (1992) used phase-contrast and polarized light microscopy to highlight the bi-phasic nature of bitumen, in which birefringent domains of about 10 µm were observed. These domains were attributed to crystalline saturated hydrocarbons. More recently, Bearsley et al. (2004) used confocal laser-scanning microscopy to view a 2-7 µm dispersion in bitumen. Based on the fluorescence of the dispersion, the dispersion was attributed to the aromatic asphaltenes, the network of which was significantly different from that observed after precipitation from a solvent (Dykstra et al., 1944; Freund and Vajta, 1958; Dickie et al., 1969; Donnet et al., 1973; Peyrot, 1973).
In the best conditions, the resolution limit of the optical microscope is about 200 nm (Morris et al., 1999). In contrast, atomic force microscopy (AFM) can provide atomic
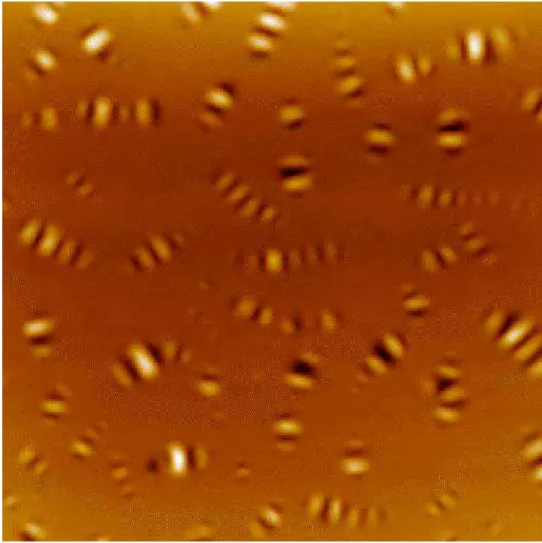
and molecular resolution (Binnig et al., 1986; Mou, J. et al., 1996). Loeber et al. (1996) first used AFM for the observation of a heat-cast bitumen film, thus preserving the solid-state morphology. A dispersed phase, with a bee-like appearance as shown in Figure 1, was attributed to asphaltenes, an assessment that was supported by Pauli et al. (2001).
An important aspect of bitumen physico-chemistry is the relationship between structure and rheology (Lesueur, 1996). Previous AFM studies on bitumen have provided limited data on the structure of bitumen in its solid-state. Loeber et al. (1996) investigated a single bitumen, whereas Pauli et al. (2001) investigated solvent-cast films. Here, we report on the observation of thirteen bitumens prepared by heat-casting in an effort to maintain the solid-state structure that governs rheology. High-resolution images were obtained by phase-detection microscopy (PDM), or phase-lag AFM.
PDM in a non-contact AFM method (Zhong et al., 1993) that circumvents the problem of tip pollution by soft and adhesive bitumen, which results in the dragging of material on its surface (Loeber et al., 1996). PDM provides images by monitoring the difference between the oscillation signal sent to the instrument cantilever and its actual oscillation as affected by tip-sample interactions (Stark et al., 1999). Figure 2 illustrates a model oscillator affected by the material surface. The phase-lag ( ) is analogous to that obtained during rheological measurements where tan = loss modulus/storage modulus (Ferry, 1980). Hence, PDM provides for the mapping of domains with various rheological or adhesive properties (Winkler et al., 1996; Anczykowski et al., 1996).
The results of this PDM investigation indicate that bitumen can have at least four phases of different rheology and composition, and that bitumens may be classified in three groups. There is evidence that the classification is governed by the variation in the
stiffness of the fused-aromatic rings in bitumen. Materials and Methods
Thirteen bitumens were analyzed by AFM. One bitumen was an 85/100 penetration grade material from Petro-Canada (PC). The other bitumens were obtained from the Materials Reference Library (MRL) of the Strategic Highway Research Program (SHRP) in the USA. The bitumens were selected for their difference in composition and in the origin of the crude oils from which they were obtained (Table 1).
Preparation of films
Bitumen films were prepared by the application of a bead of bitumen onto a 12 mm steel disk, sold commercially as an AFM substrate, or a microscope slide, which was heated for 1-2 min on a hot plate at about 115°C, a temperature high-enough to melt bitumen, but not so high that it would oxidize rapidly. Once bitumen was liquid, it was spread out with a blade to form a round film of about 5 mm in diameter. This hot film was left on the hot plate undisturbed for an additional 1 min to allow the surface to flow to a smooth and glossy finish. For AFM, the film was then cooled to room temperature, covered to prevent dust pick-up and annealed 24 h before imaging. This annealing allowed for the ordering of the asphaltenes responsible for steric hardening (Masson et al., 2005). For optical microscopy, the hot bitumen was pressed into a thin film with a glass cover slide. Atomic Force Microscopy
The atomic force microscope was a Jeol JSPM-5200. The sample stage on this instrument is located under a bell jar that can be evacuated and cooled or heated. The reported images were acquired at room temperature and normal pressure. Silicon
cantilevers with force constants of 40 N/m and their fundamental resonance frequencies near 160 kHz were used for the measurements. For each bitumen, topographic and phase-lag AFM images of 15 µm x 15 µm, and 5 µm x 5 µm were acquired in non-contact mode at room temperature and at several locations on the sample surface. Images of 15 µm x 15 µm are reported unless otherwise indicated. The area of the bee-structures in bitumens AAB, AAK, AAN, AAS, ABA and PC was measured by means of a Clemex SPM image analysis software.
Results
Multiphase bitumens
Figure 1 shows the topographic image of bitumen AAK. It shows a flat background in which another phase is dispersed. The dispersed phase shows as a succession of pale and dark lines often was referred to as “bees” or “bee structures” (Loeber et al. 1996; Pauli et al., 2001. An illustration of the topographic profile is shown in Figure 3.
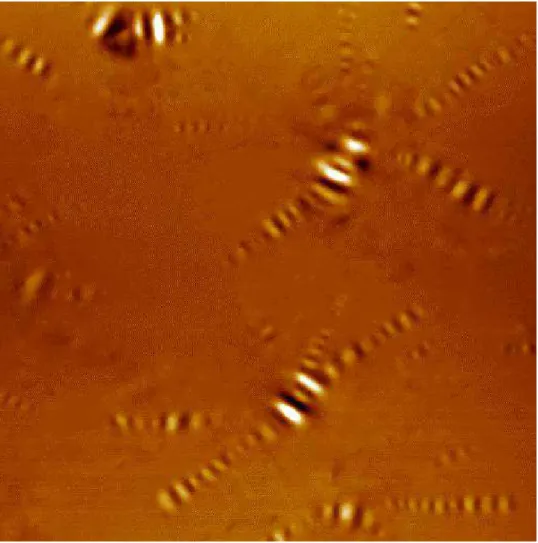
Figure 4 shows the topographic AFM image of bitumen AAF. In contrast to Figure 1, the ”bees” are not independent of one another. The bee shape is lost and it is replaced by multi-arm star-shapes. Bitumen AAB was nearly identical (not shown). Given the change in shape and the loss of the “bee” structure, we will refer to the dispersed phase with topographic profile as in Figures 3, as the catana or catanic phase, from the Greek cata, high to low, and ana, low to high.
The catana phase was observed in seven out of the thirteen bitumens investigated. Table 2 provides some details about the catana phase in the bitumens where it was observed. The average height, as defined in Figure 3, varied from 22 to 85 nm. The spacing was close to 0.50 µm, except for AAN at 0.31 µm.
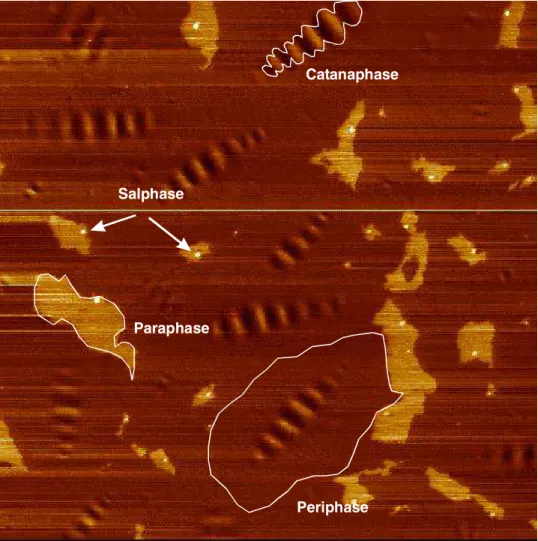
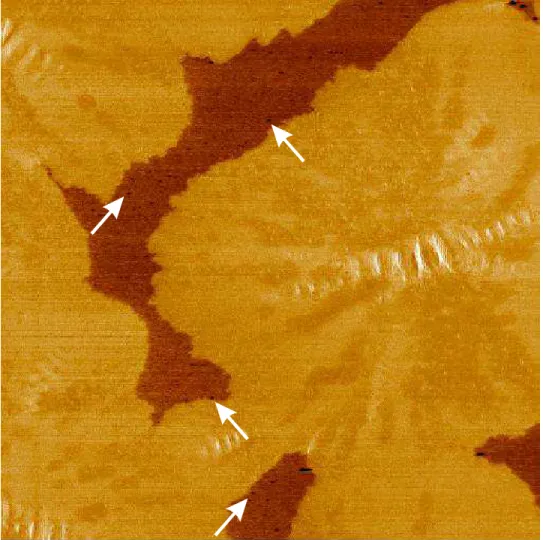
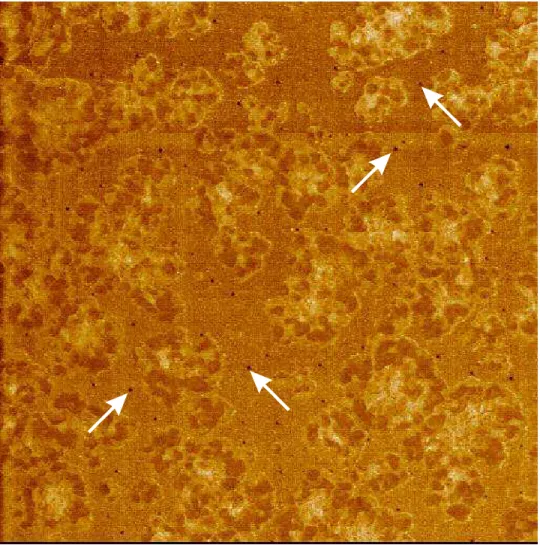
The topographic images in Figures 1 and 4 highlight the catana phase and little else. It may be debated whether or not it is the same phase visible under an optical microscope (Claudy et al., 1992; Bearsley et al., 2004). Due to its limited resolution, optical microscopy cannot provide details about the structure within the dispersed phase or the matrix. Figures 1 and 4 provide the topographic details of the dispersed phase, but they provide little, if any, details of the bitumen matrix. In this respect, PDM can be much more revealing. In bitumen PC, for instance, it reveals not only the catana phase, but also many other phases (Figure 5). Immediately around the catana phase is a dark looking phase, separated here and there by another phase of a lighter shade. For convenience, these two phases are named the peri- and para- phases, respectively (from the Greek peri, around; and para, neighbohring). Each paraphase also contains small quasi-spherical domains termed the sal-phase (sal, Latin for salt). This phase is nicely dispersed in the paraphase in bitumen AAN (Figure 6). This latter phase was absent in bitumens AAS and ABA although the catana-, peri- and para-phases were clearly visible (not shown). Bitumens with a fine dispersion
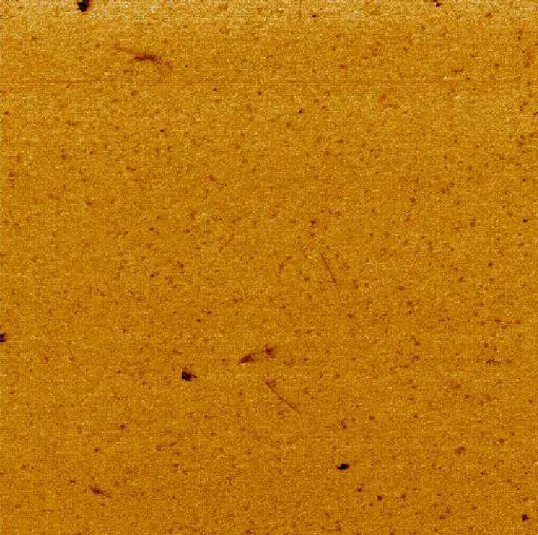
Bitumens AAA, ABF and ABG dispersed showed domains within a homogeneous matrix, but no catana phase. In bitumen AAA, the dispersion was very fine, most domains being about 0.15 µm in size (Figure 7). Bitumen ABF showed fewer, but larger domains in general, with domain size between 0.1 µm and 0.7 µm (Figure 8). Bitumen ABG showed a dispersion between those of AAA and ABF, both in size and number of domains (not shown). These bitumens showed very little topographic profile, the dispersed domains being only slightly depressed (1 to 5 nm) from the surface, in contrast to the bitumens with a catana phase.
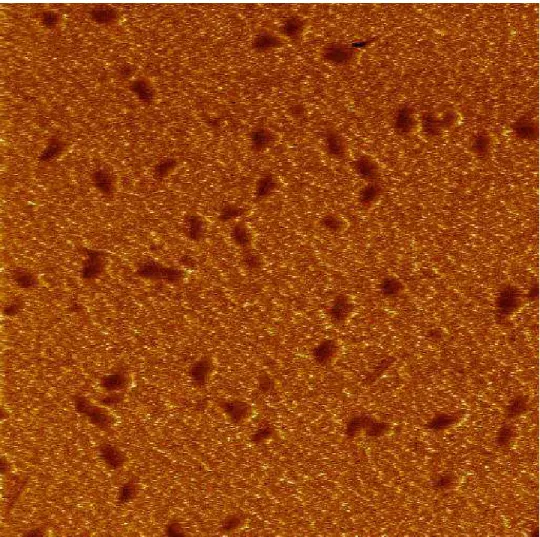
Bitumen AAG also showed a fine dispersion, with ovoid domains of about 0.2 µm on the long side (Figure 9), slightly below the matrix surface based on the topographic image (not shown). In contrast to the other bitumens with a fine dispersion, the matrix of this bitumen was not homogeneous. It contained an almost co-continuous phase, visible as white specs or fine lines in the magnified field of Figure 9, the domains being of nanometer size.
Bitumens with flake-like dispersions
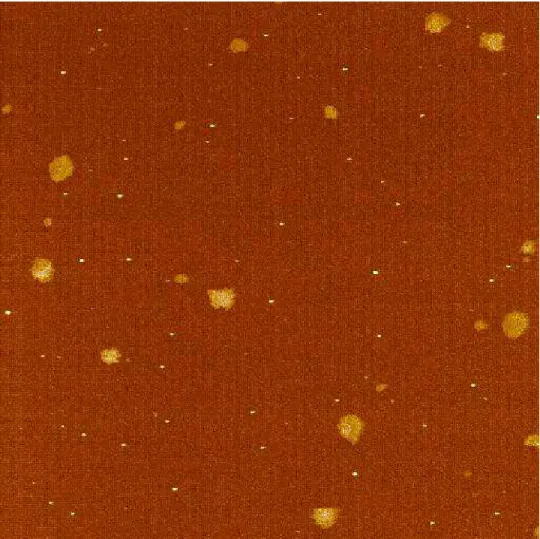
Bitumens AAM and AAZ neither showed a catana phase nor a fine dispersion. Instead, their phase images showed flake-like domains of about 1 µm in diameter (Figures 10 and 11). The topographic images indicated that the dispersed domains were slightly protruding from the surface (Figure 12). The dispersed domains in bitumen AAM were not homogeneous in composition. They contained smaller domains visible in a darker shade in the flakes of Figure 10. Interestingly, the continuous phase also contained a salphase. The continuous phase in bitumen AAZ (Figure 11) did not show a salphase, but the dispersed phase clearly showed a segregation of matter between its center and the boundary.
Discussion
Bitumen is a complex mixture of hydrocarbons. The phase images indicate that this mixture is not perfectly homogeneous and that not all the hydrocarbons are mutually soluble at room temperature. As indicated in the introduction, the phase image highlights domains with different viscoelastic properties, or stiffness. For an organic material like bitumen, the factors that can influence stiffness include the size and the flexibility of the
bitumen compounds, and their mutual interactions by means of hydrogen, ionic or polar bonds. The same factors affect the glass transition temperature of polymers (Eisenberg, 1993). In this respect, it is instructive to look at possible relationships between bitumen characteristics and PDM results, including the chemical composition, the structure of the aromatic compounds, and the polarity provided by the metals content.
Chemical composition
Bitumens AAB and AAF have a close composition (Table 1), and they fall within the same class based on PDM (Table 3). This would suggest that composition is important in the determination of morphology and structure, and would lend credence to the colloidal structural model where asphaltenes (As) are stabilized by polar aromatics (PA) in a sea of naphthene aromatics (NA) and saturated compounds (S) (Pfeiffer and Saal, 1940). It is also found, however, that bitumen AAA falls within a different class despite a S-NA-PA-As composition almost identical to that of AAB and AAF. This indicates that the colloidal model may be too simple and that such composition, obtained through solvent partitioning (Masson et al. 2001), is not a reliable indicator of the possible arrangement of various bitumen compounds in the solid-state as visible by PDM. As will be discussed in detail later, the dissolution of bitumen in a solvent has a large effect on its structure.
In early AFM work on bitumen, the catana (bee) phase was attributed to asphaltenes (Loeber et al., 1996), the most aromatic and highest molecular weight compounds in bitumen. This was supported by Pauli et al. (2001) who doped a bitumen with asphaltenes to see an increase in the density of the catana phase in the doped material. Here, the bitumens with a multi-phase structure (Table 3) contained 13-20 wt % asphaltenes (Table 1), which would lend credence to a relationship between the catana phase and the
asphaltenes. However, bitumens AAA, ABF, and ABG, also contained a sizeable 15-16 wt % asphaltenes, but they did not show a catana phase. In fact, a very poor correlation was found between the asphaltenes content and the area of the catana phase (Figure 13). Molecular architecture
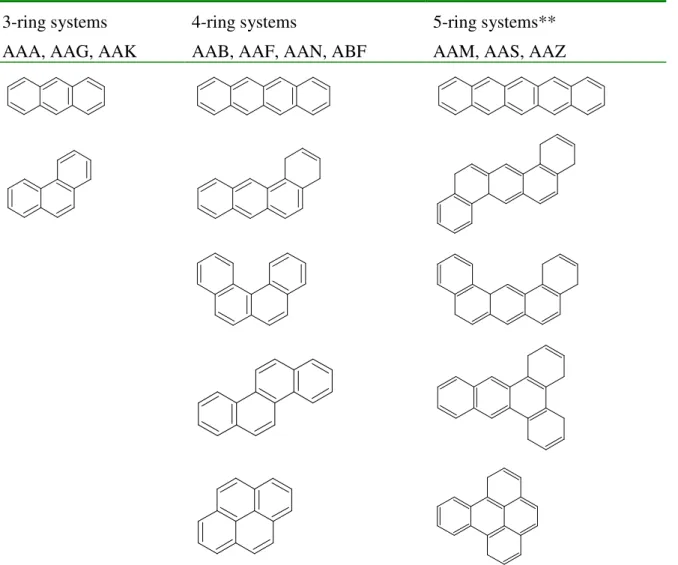
The lack of correlation between bitumen compositions as given in Table 1 and the phase structure suggests that detailed molecular architecture, not readily assessed from the solvent fractionation used to determine such composition, is important. Detailed molecular architecture can be obtained by spectroscopy (Jennings et al., 1992; Michon et al., 1997a, 1997b, Pieri et al. 1996). For some bitumens, the average molecular architecture has been drawn based on NMR (Figure 14). Fused rings form a stiff plane, the size and shape of which varies from one bitumen to the next. Similarly, bitumens may be classified within families with 3-, 4- or 5- fused aromatic rings (Table 4). The agreement between the classifications in Tables 3 and 4 is noteworthy and it suggests that bitumen micro-structure as observed by PDM is governed by the aggregation of fused aromatic rings into domains of various sizes and shapes.
Polarity
There are three exceptions to the correlation between Tables 3 and 4: bitumens AAK, ABF and AAS. This emphasizes the importance of functional groups or parameters other than the average ring structure in determining bitumen stiffness. No correlation was found between the PDM results and the polarity of bitumen based on the acid and base contents determined by Branthaver et al. (1992).
A good correlation was found between the metals content and the catana phase. This is highlighted by an r2 correlation greater than 0.96 between the vanadium (V) and nickel
(Ni) content and the surface area covered by the catana phase (Figures 15 and 16). There was no correlation with the iron (Fe) content. Ni2+ and VO2+ cations exist in bitumen (Speight, 1999), and they may be expected to provide for important polar (electrostatic) interactions that may lead to stiff domains in a manner similar to those found in ionic polymers (Eisenberg and Kim, 1998).
Organo-metallics, including Ni2+ and VO2+ chelates, concentrate in the asphaltenes when they are precipitated from bitumen (Speight, 1999). Whether or not the metals are chelated to the asphaltenes structure is uncertain (Speigh, 1999), but the results of multiple bitumen fractionation by Branthaver et al. (1992) and those in Figures 13, 15 and 16 provide evidence that metal cations are not chelated to asphaltenes. The results of Pauli et al. (2001), who observed an increase in the catana phase upon doping bitumen with asphaltenes, are consistent with the co-precipitation of metal chelates with asphaltenes and the doping of bitumen with these chelates. The effect of vanadium as illustrated in Figure 16 is also consistent with the results of Dickie et al. (1969) who saw an increase in particle sizes in bitumen doped with an organo-vanadium.
It may be hypothesized, therefore, that the catana phase consists of stacked aromatics held together by nickel and vanadium cations. In bitumen and heavy oils, a substantial amount of Ni2+ and VO2+ are chelated to porphyrins (Figure 17). A plethora of nickel and vanadium organo-metallic complexes are also known (Cotton et al, 1999; Greenwood and Earnshaw, 1984), but the structure of non-porphyrin chelates in petroleum derivatives are still being debated (Speight, 1999). Nickel and vanadium readily form coordinating bonds through the free electrons in nitrogen, oxygen and sulfur, with the complexes being most often planar (Cotton et al., 1999), as are porphyrin macrocycles
(Steed and Atwood, 2000). Hence, the stacking of molecular planes of metal chelates and fused aromatics is possible, as is a mesophase (liquid crystalline) arrangement. The long-range order of mesophases with alkyl-aromatic planes is 0.3 to 0.8 µm (Samulski, 1993), the same magnitude as the spacing in the catana phase (Table 2). The catana phase might thus be a mesophasic arrangement of metallo-aromatics. This possibility is being investigated by means of experiments in which bitumen is doped with metallo-porphyrins.
Effect of bitumen film preparation
Solvent-cast films of bitumens AAA, AAB, AAG, AAF, AAK were studied by AFM (Pauli et al., 2001). The observed morphologies were different from those observed here on the heat-cast films (Table 5). Bitumens AAA and AAB were without feature after casting from solvent, whereas bitumen AAK showed a catana and a periphase (termed American footballs by Pauli et al. (2001). It is thus obvious that film preparation methods affect the final material morphology.
Summary and conclusion
Thirteen bitumens were analyzed by phase detection AFM. The results have revealed morphologies unseen before, with bitumens classified in three groups. One group showed a fine dispersion (0.1-0.7 µm) in a homogenous matrix. Another group showed domains of about 1 µm, and a third group showed up to four different phases of vastly different sizes named catana-, peri-, para-, and sal-phases.
Bitumen is often modeled after a colloidal system where the asphaltenes (As) are stabilized by polar aromatics (PA) in a sea of naphthene aromatics (NA) and saturated
compounds (S). No correlation was found between the AFM morphology and the S-NA-PA-As composition. This does not invalidate the model, but it demonstrates that it is too simple and that other structural or composition parameters must be considered to explain the complexity of the bitumen solid-state. In this respect, the extent of the catana phase was found to correlate with the vanadium and nickel content in bitumen. There was also a good correspondence between the AFM classification and the size of the bitumen compounds, based on the average number of fused aromatic rings as determined in other studies. The morphology and the molecular arrangements in bitumen thus seem partly governed by the size and shape of molecular planes and the ionic content defined by metallic cations.
Acknowledgements
JFM thanks Don Taylor for his continuous support and encouragement, M. Peter Collins and Ms. Sladjana Bundalo-Perc for their comments during the preparation of the manuscript.
References
Anczykowski, A., Krüger, D., Fuchs H. (1996) Cantilever dynamics in quasinoncontact force microscopy: Spectroscopic aspects. Phys. Rev. B 53, 15485-15488.
Asphalt Institute (1989) The asphalt handbook. Manual Series no. 4 (MS-4), The Asphalt Institute, Lexington, Kentucky, USA.
Baker, H. (1742) The microscope made easy. Science Heritage Ltd, Lincolnwood, IL. 1987 reprint.
structure in paving-grade bitumen using confocal laser-scanning microscopy. J. Microsc. 215, 149-155.
Binnig, C., Quate, F., Gerber, C. (1986) Atomic force microscope. Phy. Rev. Lett. 56, 930-933.
Branthaver, J. F., Catalfomo, M. W., Petersen, J. C. (1992) Ion exchange chromatography separation of SHRP asphalts. Fuel Sci. Technol. Int. 10, 855-885.
Claudy, P., Létoffé, J.-M., King, G. N., Planche, J.-P. (1992) Characterization of asphalts cements by thermomicroscopy and differential scanning calorimetry: correlations to classic physical properties. Fuel Sci. Technol. Int. 10, 735-765.
Cotton, F. A., Wiskinson, G., Murillo, C. A., Bochmann, M. (1999) Advanced inorganic chemistry, 6th ed. Wiley-Interscience, New York.
Dickie, J. P., Haller, M. N., Yen, T. F. (1969) Electron microscopic investigations of the nature of petroleum asphaltics. J. Colloid Interf. Sci. 29, 475-484.
Donnet, J.-P., Ducret, J., Papirer, E., Kennel, M. (1973) Étude des bitumes routiers par microscopie électronique. J. Microscopie 17, 139-144.
Dykstra, H., Beu, K., Karz, D. L. (1944) Precipitation of asphalt from crude oil by flow through silica. Oil Gas J. 43, 79, 82, 102, 104.
Eisenberg, A. (1993) The glassy state and the glass transition, in Physical properties of polymers, 2nd ed. American Chemical Society, Washington, DC.
Eisenberg, A., Kim, J.-S. (1998) Introduction to ionomers. Wiley-Interscience, New York
Ferry, J. D. (1980) Viscoelastic properties of polymers. John Wiley & Sons, New York. Freund, M., Vajta, S. (1958) Untersuchung der bitumenstruktur mit dem
elektronenmikroskop, Erdöl Khole, vol, 13-18.
Greenwood, N. N., Earnshaw, A. Chemistry of the elements. Pergamon Press, New York. Jennings, P. W., Desando, M. A., Raub, M. F., Moats, R., Mendez, T. M., Stewart, F. F.,
Hoberg, J. O., Pribanic, J. A. S., Smith, J. A. (1992) NMR spectroscopy in the characterization of eight selected asphalts. Fuel Sci. Technol. Int. 10, 887-907.
Lesueur, D., Gerard, J.-F., Claudy, P., Létoffé, J.-M., Planche, J.-P., Martin, D. (1996) A structure-related model to describe asphalt linear viscoelasticity. J. Rheol. 40, 813-836. Loeber, L., Sutton, O., Morel, J., Valleton, J.-M., Muller, G. (1996) New direct
observations of asphalts and asphalt binders by scanning electron microscopy and atomic force microscopy. J. Microsc. 182, 32-39.
Masson, J-F., Price, T., Collins, P. (2001) Dynamics of bitumen fractions by thin-layer chromatography/flame ionization detection. Energy Fuels 15, 955-960.
Masson, J-F., Collins, P., Polomark, G. M. (2005) Steric hardening and the ordering of asphaltenes in bitumen. Energy Fuels 19, 120-122.
Michon, L., Martin, D., Planche, J.-P., Hanquet, B. (1997a) Estimation of average structural parameters of bitumens by 13C nuclear magnetic resonance spectroscopy. Fuel 76, 9-15.
Michon, L., Hanquet, B., Diawara, B., Martin, D., Planche, J.-P. (1997b) Asphalt study by neuronal networks: correlation between chemical and rheological properties. Energy Fuels 11, 1188-1193.
Morris, V. J., Kirby, A. R., Gunning, A. P. (1999) Atomic force microscopy for biologists. Imperial College Press, London.
Mou, J., Czajkowsky, D. M., Sheng S., Ho R., Shao Z. (1996) High resolution surface structures of E. coli GroeS oligomer by atomic force microscopy, FEBS Lett. 381, 161-164.
Pauli, A. T., Branthaver, J. F., Robertson, R. E., Grimes, W. (2001) Atomic force microscopy investigation of SHRP asphalts. Symposium on Heavy Oil and Resid Compatibility and Stability, Petroleum Chemistry Division, American Chemical Society, San Diego, California, USA.
Peyrot, J. (1973) Nouvelle méthode d’étude des bitumes par microscopie électronique. Bull. Liaison Labo. Ponts Chaussées 68, 12-15.
Pfeffer, J. PH., Saal, R. N. J. (1940) Asphaltic bitumen as a colloid system. J. Phys. Chem. 44, 139-149.
Pieri, N., Planche, J.-P., Kister, J. (1996) Caractérisation structurale des bitumes routiers par IRTF et fluorescence UV en mode excitation-émission synchrones. Analusis 24, 13-122.
Samulski, E. T. (1993) The mesomorphic state, in Physical properties of polymers. 2nd Ed. American Chemical Society, Washington, D.C., p. 229.
Speight, J. G. (1999) The chemistry and technology of petroleum. 3rd Ed. Marcel Dekker, New York, pp. 237, 404.
Stark, M., Guckenberger, R. (1999) Fast low-cost phase detection setup for tapping-mode atomic force microscopy. Rev. Sci. Instruments 70, 3614-3619.
Steed, J. W., Atwood, J. L. (2000) Supramolecular chemistry. Wiley, New York.
Wrinkler, R. G., Spatz, J. P., Sheiko, S., Möller, M., Reineker, P., Marti, O. (1996) Imaging material properties by resonant tapping-force microscopy: A model investigation. Phys. Rev. B 54, 8908-8912.
Zhong, Q., Inniss, D., Kjoller K., Elings, V.B. (1993) Fractured polymer/ silica fiber surface studied by tapping mode atomic force microscopy. Surf. Sci. Lett. 290, L688-L692.
Table 1. Characteristics of the bitumens studied
Compositiona Elemental analysisa,b Bitumen Source/type S NA PA As N (%) S (%) V (ppm) Ni (ppm) Fe (ppm) PCc Unknown 9 27 43 20 0.7 4.4 --- --- ---AAA Lloydminster 11 32 37 16 0.5 5.5 174 86 <2
AAB Wyoming sour 9 33 38 17 0.5 4.7 222 57 16
AAF West Texas sour 12 34 39 13 0.5 3.4 91 36 100
AAG California Valley 8 33 51 5 1.1 1.3 37 95 50
AAK Boscan 5 30 42 20 0.7 6.4 1499 141 24
AAM West Texas Int. 2 42 50 4 0.5 1.2 58 37 255
AAN Bow River 10 40 34 16 0.7 4.3 157 65 21
AAS Arab Heavy 4 40 38 17 0.5 6.2 137 40
---AAZ West Texas Coast 7 43 42 9 0.6 4.4 102 35 40
ABA West Texas 11 38 34 16 0.4 2.3 28 14 61
ABF Tia Juana 11 40 32 15 0.8 3.5 612 82
---ABG Laguna 19 47 19 16 0.4 4 494 82
---aFrom Jones (1993): S, saturates; NA, naphthene aromatics; PA, polar aromatics; As, asphaltenes.
bFrom Branthaver et al. (1992) cFrom Masson et al. (2004)
Table 2. Characteristics of the catana phase in the bitumens Bitumen Shape* Height (nm) Spacing (µm)
PC I 77 0.46 AAB MA 85 0.51 AAF I+MA 53 0.43 AAK I 52 0.51 AAN MA 22 0.31 AAS I 63 0.57 ABA MA 46 0.50
Table 3. Classification of bitumens according to PDM
Fine dispersion Multi-phase Large dispersion
AAA, AAG, ABF, ABG AAB, AAF, AAK, AAN, AAS, ABA
AAM, AAZ
Table 4. Classification of bitumens according to aromatic ring structures* 3-ring systems 4-ring systems 5-ring systems** AAA, AAG, AAK AAB, AAF, AAN, ABF AAM, AAS, AAZ
Table 5. Morphology of bitumen films from two methods Bitumen Solvent-cast film* Heat-cast films**
AAA No features Fine dispersion of about 0.15 µm AAB No features Multi-arm catana phase
AAG Few domains of 5 µm Many ovoid-domains of 0.2 µm AAF Many domains of 1 µm Multi-arm catana phase
AAK Catana and periphases Catana phase without a periphase * From Pauli et al., (2001); ** This work.
Fig. 1. Topographic AFM image of bitumen AAK (15 µm x 15 µm). Excitation Response S igna l Time
Fig. 2. Illustration of the phase lag between the set signal (excitation) and the tip response due to sample-tip interaction (Adapted from Stark and Guckenberger, 1999).
0
0
110 nm
3.0 nm
B: spacing
A: height
A
B
Fig. 3. Topographic profile of a domain in bitumen AAK. Maxima and minima respectively correspond to pale and dark strips in Figure 1. A and B are the height and spacing reported in Table 2.
Paraphase Salphase
Catanaphase
Periphase
Fig. 5. PDM image of bitumen PC (15 µm x 15 µm). Horizontal lines result from imperfect image processing.
Fig. 6. AFM phase image of bitumen AAN (15 µm x 15 µm). The salphase is indicated by arrows.
Fig. 10. AFM phase image of bitumen AAM (15 µm x 15 µm). The salphase is indicated by arrows.
Fig. 12. Topographic AFM image of bitumen AAM (15 µm x 15 µm). The lighter coloured areas are raised by about 8 nm.
R2 = 0.0036 0 5 10 15 20 25 0 5 10 15 20
Area of catana phase / %
A sp h a lt e n e s co n te n t / w t. % .
Fig. 13. Correlation between the asphaltenes content and the surface area of the catana phase in PDM images ( ). Bitumens without a catana phase ( ).
S N C H3 CH3 C15 CH3 C14 bitumen AAB C6 NH C4 C H3 CH3 S C22 bitumen AAK
Fig. 14. Average molecular structures for bitumens AAB and AAK (Adapted from Jennings et al, 1992).
R2 = 0.98 0 50 100 150 0 5 10 15 20
Area of catana phase / %
M e ta ls co n te n t/ p p m Ni Fe Linear (Ni)
Fig. 15. Correlation between the nickel and iron contents and the area of the catana phase in PDM images of bitumens with such a phase.
R2 = 0.96 0 500 1000 1500 0 5 10 15 20
Area of catana phase / %
M e ta ls co n te n t/ p p m V
Fig. 16. Correlation between the vanadium content and the area of the catana phase in PDM images of bitumens with such a phase.
N N H N N H M N N N N R R R R R R R R
Fig. 17. Porphin, the simplest porphyrin (left), and an alkyl-substituted metallo-porphyrin. M = VO2+, Ni2+, Mg2+, Be2+ or other metals