Publisher’s version / Version de l'éditeur:
Vous avez des questions? Nous pouvons vous aider. Pour communiquer directement avec un auteur, consultez
la première page de la revue dans laquelle son article a été publié afin de trouver ses coordonnées. Si vous n’arrivez pas à les repérer, communiquez avec nous à [email protected].
Questions? Contact the NRC Publications Archive team at
[email protected]. If you wish to email the authors directly, please see the first page of the publication for their contact information.
https://publications-cnrc.canada.ca/fra/droits
L’accès à ce site Web et l’utilisation de son contenu sont assujettis aux conditions présentées dans le site LISEZ CES CONDITIONS ATTENTIVEMENT AVANT D’UTILISER CE SITE WEB.
Coastal Structures and Solutions to Coastal Disasters 2015: Resilient Coastal Communities, pp. 838-847, 2015-09
READ THESE TERMS AND CONDITIONS CAREFULLY BEFORE USING THIS WEBSITE.
https://nrc-publications.canada.ca/eng/copyright
NRC Publications Archive Record / Notice des Archives des publications du CNRC : https://nrc-publications.canada.ca/eng/view/object/?id=715e20c6-ca42-4307-9040-09a7bff5e91e https://publications-cnrc.canada.ca/fra/voir/objet/?id=715e20c6-ca42-4307-9040-09a7bff5e91e
NRC Publications Archive
Archives des publications du CNRC
This publication could be one of several versions: author’s original, accepted manuscript or the publisher’s version. / La version de cette publication peut être l’une des suivantes : la version prépublication de l’auteur, la version acceptée du manuscrit ou la version de l’éditeur.
For the publisher’s version, please access the DOI link below./ Pour consulter la version de l’éditeur, utilisez le lien DOI ci-dessous.
https://doi.org/10.1061/9780784480304.087
Access and use of this website and the material on it are subject to the Terms and Conditions set forth at
Physical modelling and design optimizations for a new port in Brazil
Physical Modelling and Design Optimizations for a New Port in Brazil S. Baker1, N. Sultan2, A. Cornett1, and W. Gunderson2
1
National Research Council, Ottawa, Canada; [email protected] & [email protected]
2
PND Engineers Inc., Seattle, USA;
[email protected] & [email protected] ABSTRACT
The role of physical modelling in advancing port design is demonstrated by means of a case study in which three-dimensional physical modeling is used to guide the design of an offshore logistics support base being developed at an unprotected site on the coast of Brazil. The project was driven by the need for a safe harbour for offshore supply vessels, to prevent vessel damage and damage to the dock and berth during normal operations, as well as during extreme storm events. A 1:70 scale model of the proposed supply port and a portion of the surrounding bathymetry was designed, constructed, operated, and then modified to simulate several alternative layouts and design concepts. Froude scaling laws were applied to estimate prototype behaviour from observations and measurements in the model. The physical model proved to be an effective method for assessing the operability of the new port in various metocean conditions and for optimizing its design. It allowed the design team to investigate and assess the impact of many factors influencing wave conditions and the corresponding behaviour of a moored drill supply ship in an efficient and cost-effective manner. The important influences of wave direction, wave height, wave period, and water level were investigated, as were the sensitivities to ship location, loading condition, mooring configuration, mooring line pretension, and mooring line stiffness. Numerous modifications to the port layout were also investigated, which included lengthening the main breakwater, altering the entrance geometry, constructing a new offshore breakwater (of several different lengths), and widening the navigation channel. The outputs from the physical model study have been used in combination with information on the local wave climate at the site to assess operability and estimate downtime due to adverse weather for different port layout and breakwater configurations.
PROJECT AND SITE DESCRIPTION
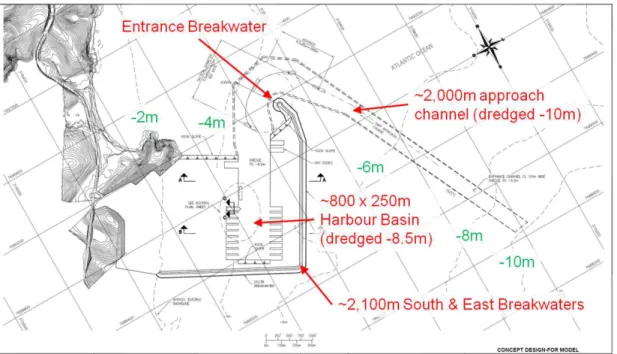
A proposed offshore logistics support base, situated at an undeveloped site approximately 300km northeast of Rio de Janeiro, is intended to supply and shelter vessels servicing offshore petroleum exploration and development platforms. The main motivation for the project is the need for a protected harbour. Offshore supply vessels have been damaged in the past during operations at other ports in the region due to wave-induced ship motion when moored at a slip. The planned harbour is
located on an exposed coast and requires new breakwaters and dredging (see Figure 1). The project includes a breakwater-protected harbour with marine facilities to service 20 or more vessels. These supply vessels (see Figure 2) typically feature a deadweight tonnage on the order of 2,500 to 5,000 tonnes, lengths from 70 to 100m, beams from 16 to 20m, and loaded drafts from 4 to 6m.
Figure 1. Project site – existing conditions
Figure 2. Offshore supply vessels.
The original concept plan for the new port, which is intended to serve as an all-weather facility and a port of refuge during storms, is sketched in Figure 3. It features a 800m by 250m rectangular mooring basin dredged to -8.5m and open to the north-northeast. The mooring basin is bordered by vertical quay walls and land reclamation, indented to form over 20 separate boat slips. The southern and eastern sides of the new port are protected by a new ~2,100m long rubble-mound causeway/breakwater. Supply ships will access the new port via a ~2,000m long navigation channel dredged to -10m.
Existing metocean data for the site was quite limited. Tidal range near the site is typically 0.5m, increasing to approximately 1.4m during the largest spring tides. The largest open‐ocean waves generally approach from ENE to S, while prevailing winds and waves approach from the SE. Smaller locally generated wind‐waves approaching from the NE may also penetrate into the proposed harbour. In general, the wind and wave climate near the project site is fairly mild; however cyclones and
tropical storms generating larger waves are known to occasionally pass nearby. The operational wave conditions adopted for investigating agitation and moored ship response included significant wave heights from 0.5 to 3.0m, and peak periods from 4 to 20s; while storm waves with significant wave heights up to 6.0m were also modelled.
Figure 3. Harbour conceptual plan
The National Research Council of Canada (NRC) was commissioned by PND Engineers Inc. (PND) to conduct a physical model study to assess whether the preferred design concept for the new port will provide a protected harbour that meets the design criteria for allowable ship motion, and to develop, test and verify potential refinements to improve performance. The main objectives of the studies were to: measure the level of wave agitation inside the harbour under a range of operational and storm conditions; verify that the downtime at the new berths due to excessive wave disturbance will be within acceptable limits; verify that the motions of a design offshore supply vessel moored in the new harbour will remain small enough to enable safe and efficient cargo handling under a full range of operational conditions; and investigate alternative port design concepts and refinements that may offer improved performance.
PND reviewed a number of options for investigating these questions, including numerical (computer) models, field measurements of ship motion at existing harbours and correlating that to measured wave data, and review of previous studies. A physical model in a 3D wave basin was assessed as the best method available at the time for estimating ship motions in a planned harbour design. While numerical methods are promising, the available tools are limited to highly simplified assumptions about the physics involving waves and ship motion at a berth. As discussed in Cornett (2014), the physical processes governing the motions or ships moored in ports are highly complex. The ship and its mooring system is essentially a three dimensional system with springs and dampers that respond to the irregular wind
and wave forcing in a chaotic manner that is not amenable to numerical solutions. At this time, there is no readily-available substitute for a 3D physical model for predicting moored ship motion in a port excited by wave action.
PHYSICAL MODELLING
The 3D physical modelling study of wave agitation and moored ship motions was conducted in NRC’s Large Area Basin (LAB). The LAB facility is a large indoor basin measuring 50m by 30m that can accommodate water depths up to 1.3m. The facility is easily accessed by heavy equipment used to construct physical models.
A 1:70 scale model of the proposed supply port and a portion of the surrounding bathymetry was designed, constructed, operated, and then modified to simulate several alternative layouts and design concepts. The model had a fixed bed made of smooth concrete, and was constructed at an undistorted scale of 1:70. At this scale, the wave basin represented an 8.2km2 rectangular area of prototype terrain.
The model was designed so that conditions in the port could be assessed in waves approaching the port from a wide range of directions ranging from 45° to 180° (northeast to south). Waves were generated in the model using a combination of two computer‐controlled WM7 wave generators. The portable WM7 wave machines were relocated during the study to generate waves from different directions. Portable walls (wave guides) were used to guide the waves from the wave machines up towards the model port. The wave guides prevent the loss of wave energy through diffraction effects and help compensate for the finite length of the wave machines.
Most of the perimeter of the basin was lined with wave‐absorbing beaches to minimize unwanted wave reflections. These beaches, made of porous rock, were placed at a slope of approximately 1:10 and minimized the reflection of spurious wave energy from the edge of the model domain.
Froude scaling laws were applied to estimate prototype behaviour from observations and measurements in the model. Many of the methods and modelling technologies described in Cornett (2014) were employed in this study.
Model Construction. The layout of the physical model and the model bathymetry was based on existing seabed surveys and initial CAD drawings of the new port. The model bathymetry was designed and constructed using a network of fibreboard templates. The templates were erected, backfilled with fine gravel, then finished with a skin of concrete grout that was screeded to the desired elevation. A smooth finish was achieved through a combination of hand and mechanical trowelling.
The prototype berths and port structures were reproduced faithfully and to scale, as much as possible. The model structures were designed and built to have geometries and wave reflectance properties that were very similar to the prototype designs. Precision surveying techniques were applied to guide and check the horizontal location and elevation of all port structures.
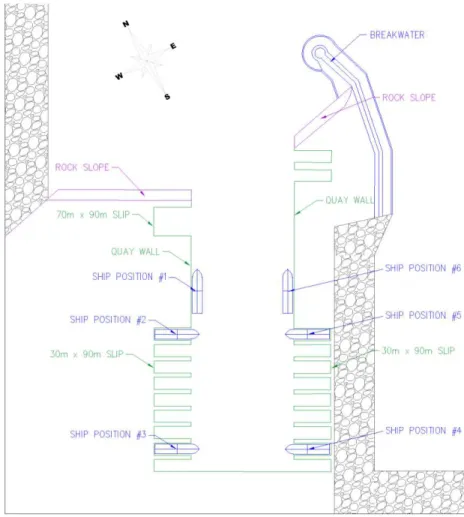
The initial port layout was designed to allow ship mooring at three different locations, all on the west side of the harbour: along a closed quay wall, along a pile‐supported deck with revetment, and inside a 30m by 80m slip. Each berth was constructed using vertical sheets of marine plywood (with a sloping revetment in
front of the pile‐supported deck). The deck was modelled using a sheet of marine‐grade plywood supported on vertical plywood rails running the length of the wharfs. A row of masonry blocks wrapped in plastic sheeting (to prevent wave energy leakage from inside the port) was used to represent the closed quay walls along the south and east sides of the harbour. Fine gravel was used along the south side to represent a pile‐supported deck with revetment. A similar method was used to construct the revetments on either side of the port entrance.
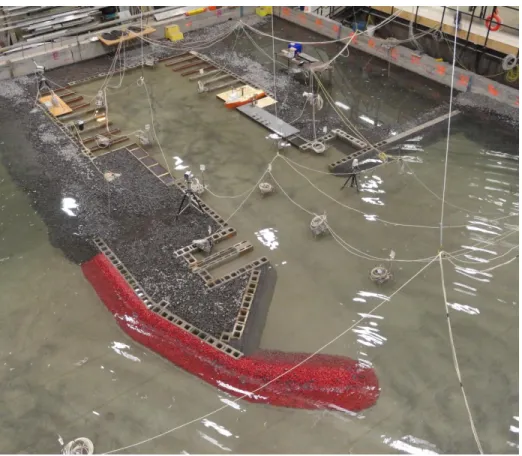
After some preliminary testing, the initial port layout was altered (as shown in Figure 4) to include 18 additional finger slips, each 30m wide by 90m long. The port fairway was also widened at this time, and the port interior was re-modelled to simulate vertical walls throughout. In addition, the model was upgraded so that ship motions could be measured at six locations on both the west and east sides of the harbour. As before, due care was taken to prevent wave energy leakage from the interior of the port by sealing all gaps with plastic sheeting and/or silicone caulking. The breakwater and alignment of the east side of the harbour remained in the same location, while the alignment of the west side of the harbour was shifted 40m further to the west.
Figure 4. Physical model of the new port.
Instrumentation. The model was equipped with capacitance wave gauges to measure wave conditions in twenty locations, advanced mooring line and fender simulators outfitted with load cells to measure mooring line and fender loads, as well as an optical motion tracking system to measure the motions of a moored vessel.
Offshore Supply Vessel. Most tests were conducted with a model vessel moored at one of the berths. An existing model ship was selected from NRC’s inventory and prepared for use in the study to represent a typical offshore supply vessel (OSV). Ballasting weights were distributed within the model ship in order to replicate several desired vessel characteristics at model scale. The total amount of weight added was governed by the required draft, while the spatial distribution of the weight was optimized to match target values for the metacentric height and the target roll period. The roll period of the model vessel was measured directly with the optical motion tracking system by exciting roll motion in still water.
Test Program. Several key performance attributes and variables were studied during the testing program, including (but not limited to): the influence of incident wave direction, height, and period on the wave conditions and moored ship response; the effect of various harbour layout plans; the effect of various offshore breakwater layouts; the effect of ship location (berth) inside harbour; the effect of vessel loading; and the influences of mooring line pretension and stiffness. Initially, the physical model study focused on assessing wave agitation and moored vessel motions for the initial port layout design in a range of operational and extreme metocean conditions. Based on the results of the initial testing, several alternative layouts and design modifications aimed at reducing wave agitation and minimizing the occurrence of excessive mooring forces and moored ship motions were developed, implemented, and assessed in the physical model. In total, twenty unique model configurations were investigated and assessed in this study.
RESULTS AND DISCUSSION
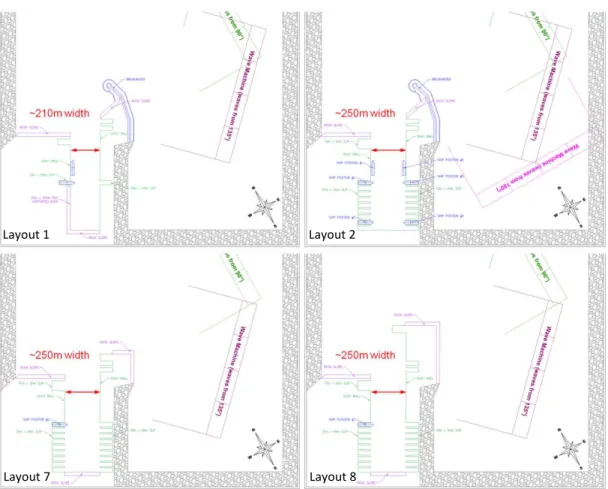
Effect of harbour layout. Four different port layouts were investigated which featured different entrance configurations (see Figure 5). Layout 2 represented a large change from the initial layout (layout 1), as described above. For waves approaching from northeast, the wider fairway introduced in layout 2 caused the short- and long-period wave energy inside the harbour to increase significantly compared to layout 1. The increased wave activity inside the port for layout 2 resulted in substantial increases in fender loads and vessel motions, and smaller increases in mooring line loads.
For layouts 7 and 8, the rubble-mound breakwater at the port entrance was eliminated in favour of extending the northeast quay wall to further shelter the port entrance. For these layouts, a seaward-facing revetment was installed on the offshore face of the outer quay wall. These layouts reduced the level of wave energy within the port overall (compared to layout 2); however there was a slight increase in wave heights at the entrance, likely due to increased wave reflections from the additional solid quay walls. As expected, layout 8 (with its notably larger land reclamation) was the most effective in reducing wave energy levels within the port and minimizing mooring line loads and vessel motions. The effect of changing the port layout was most pronounced for waves approaching from the northeast, while the effect was weaker for waves approaching from more easterly or southerly directions.
Figure 5. Four different port layout configurations.
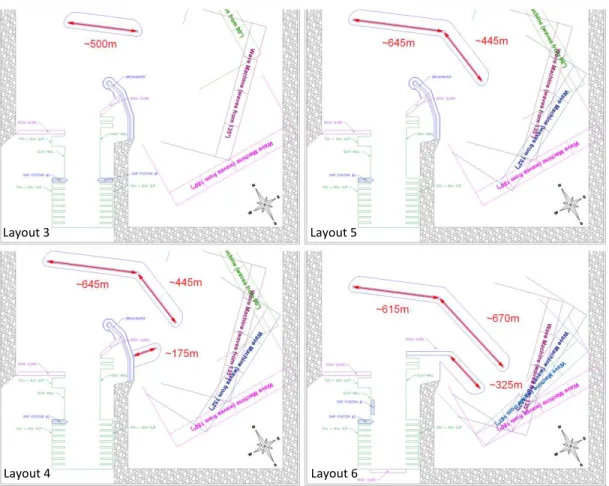
Effect of offshore breakwaters. Four different port layouts were investigated in which the configuration of offshore breakwaters sheltering the port entrance was varied (see Figure 6). For waves approaching from north and easterly directions, it is clear that each offshore breakwater concept provides a substantial reduction in both short- and long-period wave energy levels inside the port. For southerly wave directions, some additional long-period wave energy entered the port after first reflecting off the port (southwest) side of the offshore breakwaters in layouts 3 and 5. This additional long-wave energy caused the wave heights inside the port to increase overall, leading to increased mooring loads and vessel motions. Offshore breakwater concepts that incorporated stub breakwaters on the south side of the navigation channel (layouts 4 and 6) were effective in reducing both short- and long-period wave energy levels inside the port. Further cost/benefit analysis (beyond the scope of this study) would be required to determine the optimal configuration of offshore breakwaters for this port.
Layout 1 Layout 2
Figure 6. Four different offshore breakwater configurations.
Effect of vessel mooring location. The effect of ship location on maximum mooring forces and significant vessel motions was investigated by modelling and monitoring the behaviour of a supply ship moored at six different berths inside the harbour, as depicted in Figure 7. In positions 1 & 6 the ship was moored alongside (parallel to) the solid vertical quay wall, while in positions 2-5 the ship was moored in the centre of a 30m by 90m slip.
Figure 8 compares the moored ship motions measured at the six different berths for a single seastate with Hm0 = 2.0m and Tp = 6s approaching from 90°. It is
noted that different mooring line configurations were used while the ship was moored in a slip versus moored along the quay wall. As expected, the ship motions were largest when moored alongside the quay at positions 1 and 6. It is clear that the slips provide some degree of additional sheltering, with notable reductions in roll and pitch. These results suggest that position 3 in the south-west corner of the harbour is the most sheltered location for this particular wave condition and port layout.
Layout 3 Layout 5
Figure 7. Mooring forces and vessel motions were investigated at 6 berths.
Figure 8. Moored ship motions for six different berths.
Effect of mooring line pretension and stiffness. The specified 60mm Nylon mooring lines had a minimum breaking load of ~67 tonnes. The initial pretension for the lines was specified as 1 tonne; however pretensions of 2 tonnes and 4 tonnes were also tested. For the ship moored inside the slip (with its port side towards the harbour
entrance), increasing the mooring line pretension caused the mooring line loads on the port side of the vessel to increase marginally, and line loads on the starboard side of the vessel to decrease slightly. Increasing the mooring line pretension helped reduce the surge and yaw motions, but had little to no effect on sway, heave, roll, or pitch motions.
Effect of vessel loading. In most cases the ship was tested in the unloaded condition, based on the reasoning that while the ship was at port it would be immediately unloaded, waiting for new cargo, then leave port immediately upon being reloaded. For comparison, several tests were performed with the ship ballasted to represent a full cargo loading. For less energetic seastates there was no appreciable difference in measured mooring forces; however, as the seastates become more energetic the mooring forces were slightly higher for the loaded condition than for the unloaded condition. In general, and contrary to what was expected, vessel motions were slightly larger when the vessel was fully loaded, primarily due to the increased inertia of the heavier ship.
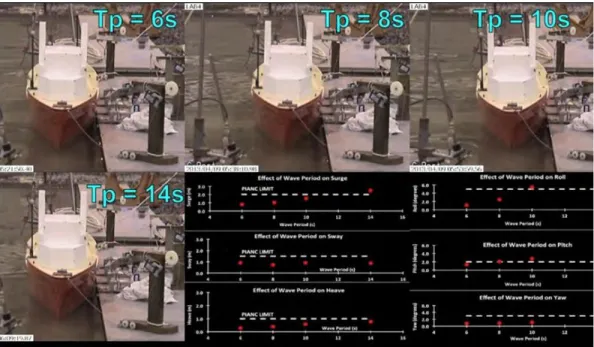
Video analysis. The study provided valuable quantitative data on ship motion, but equally valuable were the videos and qualitative observations of the ship motion during testing. The video data was indispensable for use in discussions with stakeholders, for explaining the expected ship motion for different conditions, and for providing context and understanding for the data collected by the many instruments and sensors. Figure 9 shows a screen capture from a post-processed video combining recordings from four different tests with four different peak wave periods. It also includes plots displaying the quantitative data summary statistics, showing how the 6 degrees of ship motion (surge, sway, heave, roll, pitch, and yaw) increase with increasing wave period.
CONCLUSIONS
The physical model proved to be an effective method for assessing the operability of the new port in various metocean conditions and for optimizing its layout and design. It allowed the design team to investigate and assess the impact of many factors influencing wave conditions and the corresponding behaviour of a moored offshore supply vessel in an efficient and cost-effective manner. The important influences of wave direction, wave height, wave period, and water level were investigated, as were the sensitivities to ship location, loading condition, mooring configuration, mooring line pretension, and mooring line stiffness. Numerous modifications to the port layout were also investigated and assessed, which included lengthening the main breakwater, altering the entrance geometry, and constructing several different offshore breakwaters. The outputs from the physical model study have been used in combination with information on the local wave climate at the site to assess operability and estimate downtime due to adverse weather for different port layout and breakwater configurations.
The benefit of constructing an offshore breakwater which helped shelter the port entrance from easterly and north-easterly waves was clearly demonstrated. Including such an offshore breakwater led to significant reductions in the levels of wave agitation, mooring forces, and moored ship motions, especially for incident waves approaching from the northeast and easterly directions. However, the offshore breakwater tended to increase the level of wave agitation in the port for incident waves approaching the site from south.
The study also demonstrated that supply ships moored in protected slips will be more stable than vessels moored alongside vertical quay walls. Increasing the mooring line pretension helped reduce moored ship motions at the expense of slightly higher mooring line loads. Doubling the number of mooring lines in the same arrangement (equivalent to increasing the line stiffness) helped to lower mooring forces at the expense of larger ship motions.
REFERENCES
Cornett, A.M., 2014. Physical modelling of moored ships for optimized design of ports and marine terminals. Proceedings 5th Int. Conf. on Physical Modelling in Port and Coastal Engineering (CoastLab 2014), Varna, Bulgaria.