SCIENTIFIC ARTICLE
4D-SPECT/CT in orthopaedics: a new method
of combined quantitative volumetric 3D analysis
of SPECT/CT tracer uptake and component position
measurements in patients after total knee arthroplasty
Helmut Rasch&Anna L. Falkowski&Flavio Forrer&
Johann Henckel&Michael T. Hirschmann
Received: 28 February 2013 / Revised: 13 April 2013 / Accepted: 28 April 2013 / Published online: 22 May 2013 # ISS 2013
Abstract
Objective The purpose was to evaluate the intra- and inter-observer reliability of combined quantitative 3D-volumetric single-photon emission computed tomography (SPECT)/CT analysis including size, intensity and localisation of tracer uptake regions and total knee arthroplasty (TKA) position. Materials and methods Tc-99m-HDP-SPECT/CT of 100 knees after TKA were prospectively analysed. The anatomical areas represented by a previously validated localisation scheme were 3D-volumetrically analysed. The maximum intensity was recorded for each anatomical area. Ratios between the respec-tive value and the mid-shaft of the femur as the reference were calculated. Femoral and tibial TKA position (varus–valgus, flexion–extension, internal rotation– external rotation) were determined on 3D-CT. Two consultant radiologists/nuclear medicine physicians interpreted the SPECT/CTs twice with a 2-week interval. The inter- and intra-observer reliability was determined (ICCs). Kappa values were calculated for the area with the highest tracer uptake between the observers.
Results The measurements of tracer uptake intensity showed excellent inter- and intra-observer reliabilities for all regions (tibia, femur and patella). Only the tibial shaft area showed ICCs <0.89. The kappa values were almost perfect (0.856, p<0.001; 95 % CI 0.778, 0.922). For
measurements of the TKA position, there was strong agreement within and between the readings of the two observers; the ICCs for the orientation of TKA compo-nents for inter- and intra-observer reliability were nearly perfect (ICCs >0.84).
Conclusion This combined 3D-volumetric standardised method of analysing the location, size and the intensity of
SPECT/CT tracer uptake regions (“hotspots”) and the
deter-mination of the TKA position was highly reliable and repre-sents a novel promising approach to biomechanics.
Keywords Knee . Total knee arthroplasty . 3D voxel analysis . Intra- and inter-observer reliability . SPECT-CT . Component position
Introduction
Single-photon emission computed tomography (SPECT)/CT is becoming an increasingly available diagnostic imaging modality worldwide [1–8]. The clinical diagnostic benefits of SPECT/CT for orthopaedic patients such as the combina-tion of funccombina-tional, structural and mechanical informacombina-tion have been particularly highlighted for patients with problems after
total knee arthroplasty (TKA) [4,8–11] (Figs.1,2and3).
Hirschmann et al. reported a standardised, validated and highly reliable anatomical localisation scheme, which they used to identify typical distribution patterns of areas indi-cating increased or decreased SPECT/CT tracer intensity [8]. The analysis of SPECT tracer uptake was performed using a Likert scale in a semiquantitative manner on 2D axial, coronal and sagittal slices [8]. Others used more descriptive methods to characterise areas of altered SPECT
tracer uptake [1,9,11–13].
M. T. Hirschmann (*)
Department of Orthopaedic Surgery and Traumatology, Kantonsspital Baselland, 4101 Bruderholz, Switzerland e-mail: [email protected]
H. Rasch
:
A. L. Falkowski:
F. Forrer Institute for Radiology and Nuclear Medicine, Kantonsspital Baselland, 4101 Bruderholz, Switzerland J. HenckelImperial College London, London, UK DOI 10.1007/s00256-013-1643-2
Another limitation of the conventional analysis tech-niques is that only areas of increased tracer intensity were considered and lower intensity SPECT values were neglected [14]. In our experience the distribution pattern of SPECT tracer uptake is at least equally as important for accurate and correct establishment of the diagnosis
[4, 14].
Striving for improvement of SPECT data analysis we have introduced a novel method of 3D-volumetric quan-tification, normalisation and thresholding of SPECT data [14]. Such a three-dimensional approach to SPECT data analysis promises a richer source of clinical information and allows quantitative comparison of SPECT/CT mea-surements across patients [14]. Together with the deter-mination of TKA component position in 3D-CT, it represents a novel approach to biomechanics in patients after TKA [15].
The primary purpose of this study was to evaluate the inter- and intra-observer reliability of a standardised ap-proach to combined quantitative 3D-volumetric SPECT/
CT analysis including assessment of the size, the inten-sity and the localisation of enhanced tracer uptake re-gions and determination of the TKA component position on 3D-CT. With the introduction of this analysis tool we aim to improve the process of establishing the diagnosis in patients with painful TKA. SPECT/CT could then be considered a screening tool and outcome measure in clinical trials.
Materials and methods
A total of 100 knees (male:female = 34:66, mean age ± standard deviation 70±11 years; right:left = 53:47) after total knee arthroplasty (TKA) that underwent Tc-99m-HDP-SPECT/CT were prospectively collected. Included
was a consecutive series of patients undergoing
SPECT/CT because of persistent pain after TKA. Patients who had previously undergone a revision TKA were exclud-ed. The mean time from primary TKA to the date of computed tomography
(SPECT) tracer uptake analysis (OrthoImagingSolutions, London, UK): definition of a sample volume in the SPECT data set (red box, red arrow) and 3D-voxel-based quantification of absolute maximum, minimum and mean uptake values in different anatomical areas
SPECT/CT imaging was 48±48 months. The study was approved by our local ethics committee.
99mTc-HDP-SPECT/CT
All patients received a commercial 700 MBq (18.92 mCi) Tc-99m-HDP injection (Malinckrodt, Wollerau, Switzerland). Tc-99m-HPD-SPECT/CT was performed using a hybrid sys-tem (Symbia T16; Siemens, Erlangen, Germany), which con-sists of dual head camera with a pair of low-energy, high-resolution collimators and an integrated full diagnostic CT with 16-×0.75-mm collimation. Planar scintigraphic images were taken in the perfusion phase (immediately after injec-tion), the blood pool phase (2 to 5 min after injection) and the
delayed metabolic phase (2–3 h after injection) followed by
the SPECT/CT. For SPECT acquisition we used the step and shoot mode (32 steps/25 s) with a matrix of 128×128. The CT protocol was modified according to the Imperial Knee
Protocol, which is a low -dose CT protocol that includes high-resolution 0.75-mm slices of the knee and 3-mm slices of the hip and ankle joints [16]. This protocol allows accurate determination of mechanical alignment and TKA component positions in 3D.
For tracer uptake analysis (intensity and anatomical dis-tribution pattern) the 3D-reconstructed datasets of the de-layed SPECT/CT images were used. The anatomical areas represented by a previously validated localisation scheme were 3D-volumetrically measured in terms of SPECT/CT
tracer uptake values [8, 14]. This localisation scheme for
patients after primary TKA consists of 9 tibial, 9 femoral and 4 patellar regions around TKA components to
accurate-ly map tracer uptake activity [4,8]. The maximum intensity
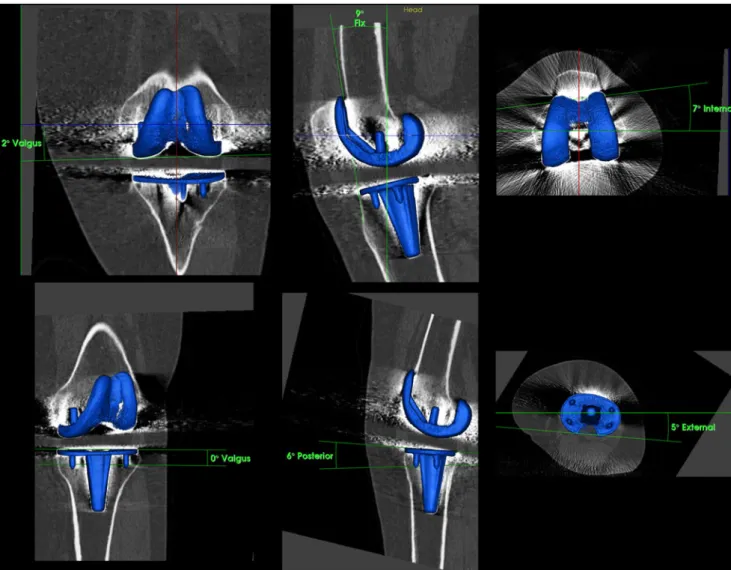
values were recorded for each anatomical area. In addition, ratios between the respective value in the measured area and the background tracer activity measured at the proximal end of the femoral field of view (FOV) were calculated. Fig. 2 Determination of tibial and femoral total knee arthroplasty
(TKA) component position (varus–valgus, flexion–extension, internal rotation–external rotation) on 3D-CT using customised software after
reorientation in relation to the mechanical axis and definition of ana-tomical landmarks on the bone surface (OrthoImagingSolutions, London, UK)
Measurements of TKA component position in 3D-CT The position of the femoral and tibial TKA component was assessed on 3D-CT after reorientation to the mechanical axis. The sagittal (flexion–extension), coronal (varus–valgus) and rotational alignment (internal rotation– external rotation) of the femoral and tibial TKA components were determined on 3D-reconstructed CT images using customised software (OrthoImagingSolutions, London, UK). The rotation of the femoral component (femoral posterior component axis) was measured in relation to the anatomical transepicondylar axis. The rotation of the tibial component (tibial posterior compo-nent axis) was measured in relation to the posterior tibial plateau axis. One consultant radiologist/nuclear medicine spe-cialist and one radiologist interpreted the SPECT/CTs for tracer uptake and component analysis twice with a 2-week interval between interpretations in a random order. Both were blinded to results from previous observations.
All data were analysed by an independent professional statistician using SPSS version 17.0 (SPSS, Chicago, IL,
USA.). Sample size was estimated according to the reported estimates for reliability studies using intraclass correlation coefficients (ICCs) [17].
The inter- and intra-observer reliability of the intensity and distribution analysis of SPECT/CT were determined by calculating the intraclass correlation coefficients (ICC). An ICC value of 1 indicated perfect reliability, 0.81 to 1 very good reliability and 0.61 to 0.80 good reliability [17].
In addition, an inter-observer reliability analysis using the Kappa statistic was performed to determine consistency on the area with the highest tracer uptake. Kappa values of < 0 represent poor, 0.0–0.20 slight, 0.21–0.40 fair, 0.41– 0.60 moderate, 0.61–0.80 substantial and 0.81–1.00 an almost perfect agreement [18].
Results
All hotspots (areas with increased tracer uptake) were pres-ent in the localisation scheme and could be located to Fig. 3 The previously validated SPECT/CT scheme used for
localisation of the Tc-99m HDP tracer activity in patients with painful knees after primary total knee arthroplasty. F femur, T tibia, P patella, 1
medial, 2 lateral, 3 central around stem, a anterior, p posterior, i inferior, s superior, shaft, tip and tubercle. Reprinted with permission. Publication can be found atwww.springerlink.com[11]
T able 1 Absolute tracer intensity values measured for each anatomical area and both observers Observer 1 Observer 2 Both Mean Standard deviation Median Minimum Maximum Mean Standard deviation Median Minimum Maximum Mean Standard deviation Median Minimum Maximum f shaft 196.9 1 13.8 180 40 722 178.5 1 15.4 150 27 722 187.9 1 1 1.5 166 34 722 f med sa 472.4 389.1 381 47 2,550 442.8 383.8 364 38 2,550 457.7 384.3 379 43 2,550 f med sp 561.2 505.4 438 57 3,730 557.6 509.4 427 57 3,730 559.5 506.6 427 57 3,730 f med ia 441.9 308.7 360 31 1,652 427.3 303.1 353 30 1,652 434.8 303.2 367 31 1,652 f med ip 514.9 379.2 435 36 1,892 513.4 381.4 429 41 1,892 514.2 379.7 427 40 1,892 f lat sa 580.1 522.2 432 65 3,462 527.2 473.2 412 65 3,389 553.8 491.2 423 65 3,426 f lat sp 605.8 530.6 531 74 3,465 602.4 527.6 531 78 3,465 604.2 527.6 531 76 3,465 f lat ia 492.3 419.1 382 70 2,397 480.1 418.3 377 70 2,397 486.3 416.8 375 70 2,397 f lat ip 569.1 406.3 433 95 2,365 563.2 407.7 448 95 2,365 566.2 406 430 95 2,365 t med a 5 1 1.3 285.1 470 54 1,581 496.9 275.7 479 54 1,581 504.2 278.2 463 54 1,581 t med p 569.2 315.8 525 71 1,439 568.7 319.7 520 74 1,368 569 316.1 520 74 1,404 t lat a 483.3 275.3 460 77 1,496 488.5 277.2 457 77 1,496 485.9 274.3 460 77 1,496 t lat p 519.2 299.3 452 54 1,350 527.9 298.8 475 54 1,350 523.6 292.7 467 54 1,350 t stem 459.4 269.4 408 48 1,383 490.1 280.9 434 49 1,339 474.9 271.9 422 49 1,361 t tip 279.7 186.8 237 37 1,202 266.8 173.2 226 55 1,1 13 273.4 177.8 232 48 1,158 t shaft 214.2 1 13.5 189 46 552 161.1 82.8 146 34 378 187.9 93.8 174 41 428 p med s 591.8 386.5 512 77 1,852 597.4 398.4 502 77 1,852 594.7 390.7 508 77 1,852 p med i 527.7 333.2 500 61 1,715 521.6 347.9 483 61 1,775 524.8 336.9 490 61 1,715 p lat s 622.2 419.4 519 97 1,845 603.1 405.3 493 101 1,841 612.8 409.3 503 100 1,843 p lat i 566.6 394.1 463 103 1,602 552.8 396.3 440 98 1,760 559.9 390.7 442 103 1,602 p total 713.2 446.3 620 108 1,852 703.1 447.1 620 108 1,852 708.2 445.4 639 108 1,852 f femur ,t tibia, p patella, sa superior –anterior ,sp superior –posterior ,ia inferior –anterior ,ip inferior –posterior ,med medial, lat lateral
T able 2 Relative tracer intensity ratios for both observers: for each anatomical area the maximum uptake value is divided by the maximum uptake measured at th e distal femur shaft (background activity) Area Observer 1 Observer 2 Both Mean Standard deviation Median Minimum Maximum Mean Standard deviation Median Minimum Maximum Mean Standard deviation Median Minimum Maximum f shaft 1 0 1 1 1 1 0 1 1 1 1 0 1 1 1 f med sa 2.49 1.52 2.14 0.99 1 1.33 2.7 2.17 2.33 0.54 20.24 2.54 1.67 2.28 0.86 14.49 f med sp 2.88 1.95 2.46 0.9 16.58 3.36 3.07 2.87 0.8 29.6 3.05 2.31 2.77 0.94 21.19 f med ia 2.32 1.24 2.06 0.57 7.81 2.65 1.61 2.32 0.5 10.7 2.42 1.32 2.27 0.54 7.66 f med ip 2.69 1.59 2.39 0.76 1 1.76 3.1 1 1.85 2.84 0.55 12.6 2.82 1.61 2.51 0.72 10.98 f lat sa 3.06 2.23 2.76 1.1 15.64 3.22 2.51 2.62 0.56 18.72 3.08 2.15 2.65 0.92 13.91 f lat sp 3.23 1.92 2.78 1.02 13.02 3.75 2.77 3.31 0.94 23.25 3.4 2.15 2.98 1.07 16.65 f lat ia 2.6 1.66 2.35 0.66 12.89 2.87 1.69 2.49 0.62 10.24 2.67 1.58 2.35 0.69 1 1.41 f lat ip 3.07 1.49 2.8 0.48 6.95 3.5 1.86 3.22 0.62 10.84 3.21 1.54 2.92 0.54 7.24 t med a 2.85 1.56 2.46 0.75 8.49 3.23 1.9 2.9 0.7 12.35 2.97 1.63 2.62 0.85 9.69 t med p 3.22 1.93 2.67 0.67 9.74 3.72 2.27 3.12 0.63 10.98 3.39 2 2.82 0.67 9.15 t lat a 2.68 1.4 2.29 0.68 8.25 3.15 1.76 2.9 0.68 1 1.95 2.84 1.48 2.61 0.68 9.37 t lat p 2.91 1.62 2.52 0.5 10.23 3.41 1.88 3 0.61 10.27 3.08 1.61 2.73 0.62 9.68 t stem 2.5 1.3 2.19 0.77 8.1 3.12 1.77 2.75 0.79 12.35 2.74 1.42 2.37 0.79 9.69 t tip 1.48 0.66 1.36 0.21 4.49 1.68 0.81 1.67 0.21 4.37 1.55 0.67 1.4 0.21 3.58 t shaft 1.17 0.44 1.08 0.18 2.71 1.02 0.42 0.98 0.17 2.73 1.08 0.38 1.02 0.18 2.38 p med s 3.21 1.98 2.85 0.81 12.85 3.73 2.19 3.45 0.86 1 1.51 3.38 2 2.94 0.89 12 p med i 2.93 1.93 2.55 0.27 13.5 3.35 2.2 2.89 0.83 1 1.83 3.07 1.97 2.63 0.6 12.61 p lat s 3.36 2.05 2.95 1 1 1.04 3.76 2.21 3.26 0.88 10.4 3.47 2 3 1.03 10.31 p lat i 3.08 2 2.57 0.83 1 1.83 3.51 2.29 2.83 0.78 1 1.43 3.22 2.02 2.69 0.83 1 1.04 p total 3.9 2.25 3.49 1 13.5 4.48 2.61 3.92 0.97 1 1.83 4.08 2.29 3.69 1.03 12.61
specific anatomical regions of the localisation scheme. The absolute measurements of tracer intensity for each anatom-ical area and the ratios (in relation to the background inten-sity of the distal femur) of both observers are presented in
Tables1and2.
The measurements of tracer uptake intensity using this 3D voxel-based analysis showed very good inter-and intra-observer reliabilities for all regions (tibia, fe-mur and patella). Only the tibial shaft area showed ICCs <0.89.
The detailed ICCs for the absolute values and the ratios (relative to the background tracer uptake in the mid-femoral
shaft) are presented in Table3.
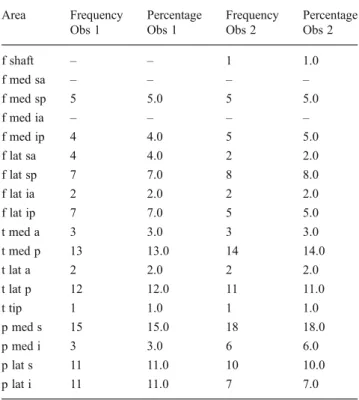
Table 4 compares the areas indicating the maximum
tracer uptake when measured by each observer. The inter-observer reliability for the agreement on the area with the highest tracer uptake was found to be almost perfect Kappa=0.856 (p<0.001; 95 % CI 0.778, 0.922).
For measurement of the femoral and tibial component position, there was strong agreement between the readings of the two observers; the ICCs for the orientation of the femoral and tibial components for inter- and intra-observer reliability were >0.84, which is nearly perfect. The mean differences ± standard deviation in femoral and tibial mea-surements between the two observers (inter-observer) are
presented in Table5.
Discussion
The proposed method of combined quantitative 3D analysis of SPECT tracer uptake and measurements of TKA compo-nent position reflects a novel approach to biomechanics in patients after TKA.
The most important findings and implications of our present study are threefold:
First, the measurements of SPECT tracer uptake intensity using this 3D voxel-based analysis showed very good inter-and intra-observer reliabilities for all regions (tibia, femur and patella). The maximum uptake value in each anatomical area was almost perfectly reliable. The presented SPECT analysis method proved to be a valuable, consistent, reliable and useful tool in characterising tracer activity in patients with primary TKA. There was strong agreement for inter-and intra-observer reliability in the areas with the highest SPECT tracer uptake in each dataset. Taking only the area of highest tracer uptake into account for the establishment of a typical pathology-related SPECT distribution uptake pattern could facilitate SPECT data analysis for clinical routine. Using this approach typical SPECT/CT tracer uptake pat-terns should be identified for pathological conditions such as femoral or tibial loosening, patellofemoral hyperpression or instability, each specific type of TKA, component posi-tion and mechanical alignment [4].
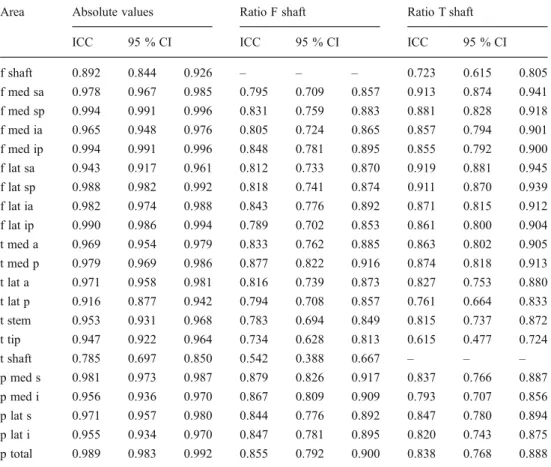
Table 3 Intra- und inter-observer reliability (ICCs for absolute single-photon emission computed tomography [SPECT] values, relative SPECT values) of 3D voxel-based SPECT uptake measurement
Area Absolute values Ratio F shaft Ratio T shaft
ICC 95 % CI ICC 95 % CI ICC 95 % CI
f shaft 0.892 0.844 0.926 – – – 0.723 0.615 0.805 f med sa 0.978 0.967 0.985 0.795 0.709 0.857 0.913 0.874 0.941 f med sp 0.994 0.991 0.996 0.831 0.759 0.883 0.881 0.828 0.918 f med ia 0.965 0.948 0.976 0.805 0.724 0.865 0.857 0.794 0.901 f med ip 0.994 0.991 0.996 0.848 0.781 0.895 0.855 0.792 0.900 f lat sa 0.943 0.917 0.961 0.812 0.733 0.870 0.919 0.881 0.945 f lat sp 0.988 0.982 0.992 0.818 0.741 0.874 0.911 0.870 0.939 f lat ia 0.982 0.974 0.988 0.843 0.776 0.892 0.871 0.815 0.912 f lat ip 0.990 0.986 0.994 0.789 0.702 0.853 0.861 0.800 0.904 t med a 0.969 0.954 0.979 0.833 0.762 0.885 0.863 0.802 0.905 t med p 0.979 0.969 0.986 0.877 0.822 0.916 0.874 0.818 0.913 t lat a 0.971 0.958 0.981 0.816 0.739 0.873 0.827 0.753 0.880 t lat p 0.916 0.877 0.942 0.794 0.708 0.857 0.761 0.664 0.833 t stem 0.953 0.931 0.968 0.783 0.694 0.849 0.815 0.737 0.872 t tip 0.947 0.922 0.964 0.734 0.628 0.813 0.615 0.477 0.724 t shaft 0.785 0.697 0.850 0.542 0.388 0.667 – – – p med s 0.981 0.973 0.987 0.879 0.826 0.917 0.837 0.766 0.887 p med i 0.956 0.936 0.970 0.867 0.809 0.909 0.793 0.707 0.856 p lat s 0.971 0.957 0.980 0.844 0.776 0.892 0.847 0.780 0.894 p lat i 0.955 0.934 0.970 0.847 0.781 0.895 0.820 0.743 0.875 p total 0.989 0.983 0.992 0.855 0.792 0.900 0.838 0.768 0.888
Second, the distal femoral shaft region was identified as perfect reference region to build ratios between the measured SPECT values in each anatomical area and the SPECT back-ground activity of the reference region. The tibial shaft region, which is also visible within the field of view of our SPECT/CT protocol, showed inferior inter- and intra-observer reliability. This might be due to the variable tibial anatomy. Hence, the femoral shaft area should be used to normalise the measured SPECT data.
that represent SPECT background intensity are mandatory when aiming for an improved inter- and intra-patient com-parison [14].
Generally, the measured SPECT tracer intensity for each anatomical region represents an individualised in-tensity grading, which is only valid within each patient at the time of SPECT and not directly comparable between patients, it is only possible to compare relative values (ratios), for example the activity in one region relative to the activity of the distal femoral shaft of the same patient [14]. Normalisation of SPECT data using ratios of absolute measures in the areas of interest in relation to absolute measures in reference regions, e.g. distal shaft of the femur, is an important cornerstone of SPECT data analysis [14].
Third, the determination of femoral and tibial TKA component position in 3D-CT was highly reliable. Based on our findings, we recommend the use of the proposed method for determining the rotational, sagittal and coronal orientation of the components after TKA. The described method is clinically easily applicable, highly reproducible and the measurements can be performed within 5 min per dataset. This new method enables radiologists, nuclear medicine physicians or orthopaedic sur-geons to describe the accuracy of placement of the compo-nents with confidence.
To date, the accurate determination of TKA component position relating to the mechanical axis on 3D-CT has only been feasible using customised software, which is not tai-lored for this purpose and thus too complicated to use in clinical routine. Hence, most authors used axial 2D-CT slices for measurement of component position, although it has been shown that these measurements are very variable and less reliable [15].
Table 5 Mean angles ± standard deviation of each observer and intraclass correlation coefficients (intra- and inter-observer reliability) of femoral and tibial component measurements Mean ± SD Mean difference ± SD ICCs intra-observer reliability ICCs inter-observer reliability Femoral component measurements
Varus–valgus Obs1 0.30±2.50 0.40±0.44 0.99 0.99 Varus–vValgus Obs2 0.55±2.45 0.97
Flexion–extension Obs1 5.77±4.22 0.76±0.67 0.97 0.99 Flexion–extension Obs2 5.53±4.18 0.97
Internal–external rotation Obs1 2.36±3.47 1.65±1.81 0.92 0.85 Internal–external rotation Obs2 2.03±3.24 0.84
Tibial component measurements
Varus–valgus Obs1 −1.11±1.99 0.47±0.41 0.98 0.98 Varus–valgus Obs2 −1.19±2.07 0.94
Anterior–posterior slope Obs1 4.16±3.85 0.62±0.57 0.99 0.99 Anterior–posterior slope Obs2 4.30±3.70 0.98
Internal–external rotation Obs1 −2.93±7.17 3.06±2.70 0.95 0.93 Internal–external rotation Obs2 −4.88±7.03 0.89
Area Frequency Obs 1 Percentage Obs 1 Frequency Obs 2 Percentage Obs 2 f shaft – – 1 1.0 f med sa – – – – f med sp 5 5.0 5 5.0 f med ia – – – – f med ip 4 4.0 5 5.0 f lat sa 4 4.0 2 2.0 f lat sp 7 7.0 8 8.0 f lat ia 2 2.0 2 2.0 f lat ip 7 7.0 5 5.0 t med a 3 3.0 3 3.0 t med p 13 13.0 14 14.0 t lat a 2 2.0 2 2.0 t lat p 12 12.0 11 11.0 t tip 1 1.0 1 1.0 p med s 15 15.0 18 18.0 p med i 3 3.0 6 6.0 p lat s 11 11.0 10 10.0 p lat i 11 11.0 7 7.0
Inter-observer reliability analysis Kappa=0.856 (p<0.001; 95 % CI 0.778, 0.922)
Conclusions
The proposed combined 3D-volumetric standardised method of analysing the location, size and the intensity of SPECT/CT tracer uptake regions (“hotspots”), as well as the determina-tion of TKA component posidetermina-tion, is highly reliable. It repre-sents a novel, promising approach to the biomechanics of patients after TKA. Its clinical value will be further investi-gated in prospective clinical studies.
Acknowledgements We greatly thank the Gottfried und Julia Bangerter-Rhyner-Stiftung, Berne, Switzerland as well as the Deutsche Arthrose Hilfe e.V, Saarlouis, Germany for supporting our research. Conflict of interest The authors declare that they have no conflict of interest.
References
1. Bybel B, Brunken RC, DiFilippo FP, Neumann DR, Wu G, Cerqueira MD. SPECT/CT imaging: clinical utility of an emerging technology. Radiographics. 2008;28(4):1097–113.
2. Delbeke D, Schöder H, Martin WH, Wahl RL. Hybrid imaging (SPECT/CT and PET/CT): Improving therapeutic decisions. Semin Nucl Med. 2009;39(5):308–40.
3. Gnanasegaran G, Barwick T, Adamson K, Mohan H, Sharp D, Fogelman I. Multislice SPECT/CT in benign and malignant bone disease: when the ordinary turns into the extraordinary. Semin Nucl Med. 2009;39(6):431–42.
4. Hirschmann MT, Konala P, Iranpour F, Kerner A, Rasch H, Friederich NF. Clinical value of SPECT/CT for evaluation of patients with painful knees after total knee arthroplasty–a new dimension of diagnostics? BMC Musculoskelet Disord. 2011;12:36.
5. Hirschmann MT, Schmid R, Dhawan R, et al. Combined single photon emission computerized tomography and conventional com-puterized tomography: clinical value for the shoulder surgeons? Int J Shoulder Surg. 2011;5(3):72–6.
6. Konala P, Iranpour F, Kerner A, Rasch H, Friederich NF, Hirschmann MT. Clinical benefit of SPECT/CT for follow-up of
surgical treatment of osteochondritis dissecans. Ann Nucl Med. 2010;24(8):621–4.
7. Scharf S. SPECT/CT imaging in general orthopedic practice. Semin Nucl Med. 2009;39(5):293–307.
8. Hirschmann MT, Iranpour F, Konala P, et al. A novel standardized algorithm for evaluating patients with painful total knee arthroplasty using combined single photon emission tomography and conventional computerized tomography. Knee Surg Sports Traumatol Arthrosc. 2010;18(7):939.
9. Graute V, Feist M, Lehner S, et al. Detection of low-grade pros-thetic joint infections using 99mTc-antigranulocyte SPECT/CT: initial clinical results. Eur J Nucl Med Mol Imaging. 2010; 37(9):1751–9.
10. Hirschmann MT, Davda K, Iranpour F, Rasch H, Friederich NF. Combined single photon emission computerised tomography and conventional computerised tomography (SPECT/CT) in patellofemoral disorders: a clinical review. Int Orthop. 2011; 35(5):675–80.
11. Hirschmann MT, Iranpour F, Davda K, Rasch H, Hugli R, Friederich NF. Combined single-photon emission computerized tomography and conventional computerized tomography (SPECT/CT): clinical value for the knee surgeons? Knee Surg Sports Traumatol Arthrosc. 2010;18(3):341–5.
12. Ahmad R, Kumar GS, Katam K, Dunlop D, Pozo JL. Significance of a "hot patella" in total knee replacement without primary patel-lar resurfacing. Knee. 2009;16(5):337–40.
13. Pagenstert GI, Barg A, Leumann AG, et al. SPECT-CT imaging in degenerative joint disease of the foot and ankle. J Bone Joint Surg Br. 2009;91(9):1191–6.
14. Hirschmann MT, Wagner CR, Rasch H, Henckel J. Standardized volumetric 3D-analysis of SPECT/CT imaging in orthopaedics: overcoming the limitations of qualitative 2D analysis. BMC Med Imaging. 2012;12(1):5.
15. Hirschmann MT, Konala P, Amsler F, Iranpour F, Friederich NF, Cobb JP. The position and orientation of total knee replacement components: a comparison of conventional radiographs, transverse 2D-CT slices and 3D-CT reconstruction. J Bone Joint Surg Br Vol. 2011;93(5):629–33.
16. Henckel J, Richards R, Lozhkin K, et al. Very low-dose computed tomography for planning and outcome measurement in knee replace-ment. The imperial knee protocol. JBJS (Br). 2006;88(11):1513–8. 17. Walter SD, Eliasziw M, Donner A. Sample size and optimal
de-signs for reliability studies. Stat Med. 1998;17(1):101–10. 18. Landis JR, Koch GG. The measurement of observer agreement for