Publisher’s version / Version de l'éditeur:
SP-2273: Welding and Joining and Fastening, SP-2273, pp. 1-7, 2010-04-13
READ THESE TERMS AND CONDITIONS CAREFULLY BEFORE USING THIS WEBSITE.
https://nrc-publications.canada.ca/eng/copyright
Vous avez des questions? Nous pouvons vous aider. Pour communiquer directement avec un auteur, consultez la
première page de la revue dans laquelle son article a été publié afin de trouver ses coordonnées. Si vous n’arrivez pas à les repérer, communiquez avec nous à [email protected].
Questions? Contact the NRC Publications Archive team at
[email protected]. If you wish to email the authors directly, please see the first page of the publication for their contact information.
NRC Publications Archive
Archives des publications du CNRC
This publication could be one of several versions: author’s original, accepted manuscript or the publisher’s version. / La version de cette publication peut être l’une des suivantes : la version prépublication de l’auteur, la version acceptée du manuscrit ou la version de l’éditeur.
For the publisher’s version, please access the DOI link below./ Pour consulter la version de l’éditeur, utilisez le lien DOI ci-dessous.
https://doi.org/10.4271/2010-01-0969
Access and use of this website and the material on it are subject to the Terms and Conditions set forth at
Fracture behavior of typical structural adhesive joints under quasi-static and cyclic loadings
Eskandarian, M.; Jennings, B.; Côté, M.; Arsenault, B.
https://publications-cnrc.canada.ca/fra/droits
L’accès à ce site Web et l’utilisation de son contenu sont assujettis aux conditions présentées dans le site LISEZ CES CONDITIONS ATTENTIVEMENT AVANT D’UTILISER CE SITE WEB.
NRC Publications Record / Notice d'Archives des publications de CNRC:
https://nrc-publications.canada.ca/eng/view/object/?id=47ad8587-bb95-4557-9f95-12747fa0c595 https://publications-cnrc.canada.ca/fra/voir/objet/?id=47ad8587-bb95-4557-9f95-12747fa0c595
Page 1 of 7
1
FRACTURE BEHAVIOR OF TYPICAL STRUCTURAL ADHESIVE
JOINTS UNDER QUASI-STATIC AND CYCLIC LOADINGS
M. Eskandarian
(1) (1) Aluminium Technology Centre (ATC / IMI), National Research Council Canada,501 boul. de l'Université, Chicoutimi, Quebec, Canada G7H 8C3.
B. Jennings
(2) (2) Structural Adhesives NGV, 3M Center Bldg. 201-2W-17, St. Paul, MN 55144-1000.M. Côté
(1)and B. Arsenault
(1)Copyright © 2010 SAE International
ABSTRACT
Structural adhesive joints are expected to retain integrity in their entire service-life that normally involves cyclic loading concurrent with environmental exposure. Under such a severe working condition, effective
determination of fatigue life at different temperatures is crucial for reliable joint design. The main goal of this work was thus defined as evaluation of fatigue performance of adhesive joints at their extreme working temperatures in order to be compared with their fracture properties under static loading. A series of standard double-cantilever-beam (DCB) specimens have been bonded by three structural 3M epoxy adhesives selected from different applications. The specimens were tested under monotonic and cyclic opening loads (mode-I) in order to evaluate the quasi-static and fatigue performances of selected adhesives at room temperature, 80°C and -40°C. The test results revealed that the fatigue damage occurred at relatively low load levels when compared to quasi-static fracture forces. At room temperature, the maximum cyclic fatigue forces varied between 25% and 40% of corresponding quasi-static fracture loads of selected adhesives. More significant reductions in adhesive mechanical performances were observed at 80°C. At cryogenic temperature, the adhesives had their own characterizations; mainly increasing the fatigue resistance but very sensitive to testing parameters such as loading rate or crosshead speed. In conclusion, the experimental observations showed a significant influence of fatigue loading on adhesive joints mechanical performances that should be considered in joint design,
particularly at non-ambient temperatures.
INTRODUCTION
Structural adhesives are now progressively used in different applications where the high strength bonds are required. Aircraft fuselages, ground transportation frames, renewable-energy like wind generators and adhesively bonded panels in construction applications are some good examples for structural adhesive joint applications. In many cases, it is often required to transfer cyclic loads concurrent with environmental exposure. Although this type of service condition is possibly the most destructive form of mechanical loading, yet the majority of durability tests and consequently the adhesive joint designs are based on the quasi-static test results.
Page 2 of 7
2
At such destructive loading condition, the knowledge of fatigue behavior becomes strategic for designers to rely on adhesive joining for structural applications particularly in automotive industries. Design of reliable structural adhesive joints requires the effective determination of fatigue life at corresponding environmental conditions. Therefore, this research work was planned to aim the evaluation of fatigue performances of typical adhesive joints in a comparison with their static fracture properties. The specific goal of this work was then a comparison between fatigue behaviors of three selected 3M adhesives and their static fracture properties at their extreme working temperatures.
SPECIMENS AND EXPERIMENTS
A fracture-based approach is used in this work to evaluate the temperature-dependency in monotonic and fatigue behaviors of three structural adhesives of 3M selected from different applications. Adhesive-A was a one-part epoxy adhesive with a lower elastic modulus that was developed to efficiently work at a wide range of working temperatures. Adhesive-B was a general-purpose non-sag two-part epoxy adhesive and the third adhesive was a film-based one part epoxy adhesive (Adhesive-C). The elastic properties of selected 3M adhesives are tabulated in Fig. 1. Three double-cantilever-beam specimens (DCB) were fabricated by 3M for each combination of selected adhesive and working temperature totally 27 adhesive specimens. The specimens were cut from the bonded aluminum plates (2024-T351, 1/2”x12”x12”) that were treated as an FPL etch and phosphoric acid anodization process prior to bonding. A thin-layer primer was also applied and fully cured before applying the adhesive. In order to control the adhesive bondline thickness, the 150 µm brass shims (635
µm for Adhesive-C) were placed along three sides of aluminum plates and on the fourth side a Teflon tape was applied as a precrack. The DCB specimens were cut from bonded aluminum plates in accordance to ASTM standard D3433-05 with a final geometry schematically shown in Fig.1.
Fig. 1: Geometry of DCB specimens and adhesives elastic properties (All dimensions are in millimeter). The specimens were tested under opening monotonic and cyclic loads (mode-I) by employing a novel fracture test technique in which some crack detection sensors were installed on one face of DCB specimen for
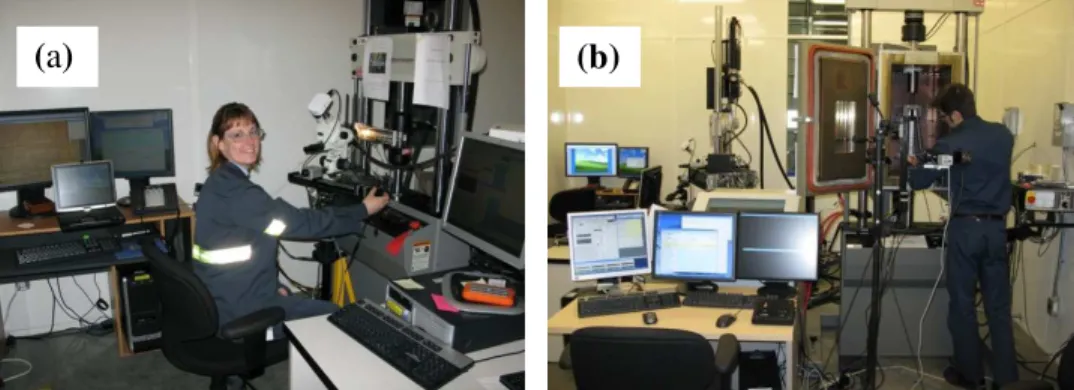
controlling the testing machines by their signals. The machines alternatively changed the loading case from monotonic forces to variable-amplitude cyclic loads as crack broke a sensor. Two closed-loop servo hydraulic systems (810 MTS) together with the optical crack length measuring systems were used in this work. A dual-actuator (2 x 15kN) hydraulic machine equipped with two unidirectional hydraulic dual-actuators was used for the tests at room temperature and 80°C as shown in Fig. 2a. This machine was especially designed for adhesive joint strength evaluation under complex loading modes which was equipped with a custom-made temperature chamber for the tests at higher temperatures. For the tests at -40°C, a standard 50kN hydraulic system equipped with liquid nitrogen (LN2) injected chamber was employed as shown in Fig. 2b. Due to limited space in this chamber, a loading fixture was fabricated to convert vertical actuator load into horizontal loads and allow
Adhesive Young modulus (MPa) Poisson’s ratio A 671.74 0.38 B 2135.03 0.41 C 2263.45 0.41 12 1 2 .7 305 48 (Precrack) 2 × Φ 6.35
Page 3 of 7
3
longer DCB specimens to be mounted vertically in the chamber. Fig. 3 shows both testing setups with the typical adhesive joints installed. It should be mentioned that the conformity of the test results obtained from different loading setups was verified through a series of validation tests with 50 kN load frame at room temperature and 80°C.
Fig. 2: MTS servo-hydraulic test units, (a) dual-actuator 2x15kN, (b) 50kN system.
Fig. 3: Testing setup on (c) dual-actuator unit, (d) 50kN unit that was only used in cryogenic tests. Each fracture test was started by a series of monotonic loading stages at room temperature in order to determine the quasi-static resistance of tested specimen. Five or six variable-amplitude cyclic tests were then performed under force control at a load ratio of 0.1 and a frequency of 8Hz. Prior to each cyclic loading, at least five more monotonic loadings were again applied to sharpen the crack tip and also to determine the local quasi-static resistance at testing temperature. Fig. 4 schematically shows the loading stages during a typical fracture test of this study. In quasi-static test stages (Quasi 1, Quasi2, ...), the testing machine was programmed for automatic fracture detection via the variation of joint compliance. After reaching the fracture point, the opening
displacement was kept constant in 30 seconds for a finite crack propagation that was normally around 2 to 3 mm. The actuators were then returned back to 100 N load level before starting the next quasi-static stage. The maximum cycle force in each cyclic test (Cyclic1, Cyclic2, ...) was a percentage of local fracture force varying between 80% and 35% for the first and the last cyclic tests, respectively.
(b) (a)
Page 4 of 7
4
The advantage of this testing method is determining both the adhesive quasi-static and cyclic performances by using a single specimen. This ensures that the mechanical performances are determined under the same
conditions of pretreatment, curing and fabrication. It also eliminates the operator interference and also the need of optical crack length measurements or other sophisticated experimental method for crack length
determination.
Fig. 4: Quasi-static and fatigue test sequences triggered by crack detection sensors.
The fracture surfaces were carefully examined after each test for any sign of interfacial or semi-interfacial fracture as shown typically in Fig. 5. This image clearly demonstrates a test sequence as well as quasi-static and cyclic zones. The cohesive failures represent the quasi-static zones while the crack propagation in the cyclic areas was dominantly interfacial or semi-interfacial for the specimen shown.
Fig. 5: Typical fracture surface for a specimen bonded by Adhesive-B. Cyclic 1 Cyclic 2 Cyclic 3 Cyclic 4 25 mm Cyclic 5 Quasi 2 Quasi 3 Quasi 4 Quasi 5 Quasi_Post Quasi 1 Quasi_Pre
Quasi static loci: Cohesive –partially interfacial Cyclic loci: Interfacial or semi
Avg. bondline thickness: 133 µm
Cyclic 1 Cyclic 2 Cyclic 3 Cyclic 4 Cyclic 5 Quasi 2 Quasi 3 Quasi 4 Quasi 5 Quasi_Post Quasi 1 Quasi_Pre
Quasi-static fracture loci: Cohesive or partially interfacial Cyclic fracture loci: Interfacial or semi-interfacial
Direction of crack propagation
Time
L
o
ad
Quasi 1 Cyclic 1 Quasi 2 Cyclic 2 Quasi 3 Cyclic 3
Quasi-static fracture points detected automatically by testing machine
The cyclic tests were performed at 8 Hz and 0.1 load ratio under variable force amplitude.
Page 5 of 7
5
RESULTS AND DISCUSSION
The critical strain energy release rate Gc was calculated from fracture force and joint geometry at every
monotonic loading stage and is used here as an index for quasi-static performance of tested specimen. The variation of Gc as a function of crack length, i.e. R-curve, was plotted for each fracture test. The average of Gc
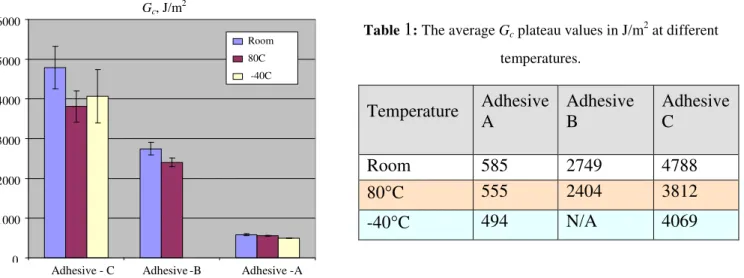
values over all the quasi-static stages at any temperature was calculated and tabulated in Table 1. A comparison is also made for the adhesive Gc values at different temperatures in Fig. 6. The highest average Gc value at any
testing temperature corresponds to Adhesive-C that had the highest elastic modulus as well. Adhesive-A demonstrated a more stable behavior to temperature changes. It also had the lowest elastic modulus and the minimum deviation in the data as well. Moderate fracture toughness was obtained for Adhesive-B at room temperature and at 80°C but interfacial fracture to the primer layer was observed for this adhesive when tested at -40°C. Hence, its cryogenic performance was not fully determined in this study. The maximum fracture force of 4600N was measured for Adhesive-C at room temperature that was almost 3 and 1.5 times of corresponding fracture forces for Adhesives-A and Adhesive-B, respectively. Regarding the temperature dependency, we may say that Adhesive-A was almost insensitive to temperature changes, but a reduction of 12% and 20% in Gc
values were observed at 80°C for Adhesive-B and Adhesive-C, respectively. At cryogenic temperature, no data was collected for Adhesive-B, while a 15% reduction in Gc value was determined at -40°C for Adhesive-C. In
general, the fracture behavior of adhesives at cryogenic temperature was very sensitive to testing parameters such as loading rate or crosshead speed.
Fig. 6: The average Gc values for the tested adhesives at different temperatures.
For the cyclic tests, on the other hand, a power law curve was fitted to each fatigue curve that represents the variation of Gmax, the maximum energy release rate in each loading cycle, as a function of da/dN or crack speed.
The coefficient of power law is directly related to adhesive quasi-static Gc value, while the power factor could
be assumed as an index for fatigue performance. In general, the fatigue performance of an adhesive can only be determined when its threshold strain energy release rate Gth is determined. But, one may say that the lower
value of power-law factor represents smoother fatigue curve and then a better normalized fatigue resistance relative to its quasi-static Gc value. The power-law factors for the tested adhesives are tabulated in Table 2,
Temperature Adhesive A Adhesive B Adhesive C Room 585 2749 4788 80°C 555 2404 3812 -40°C 494 N/A 4069 0 1000 2000 3000 4000 5000 6000
Adhesive - C Adhesive-B Adhesive -A Room 80C -40C
Gc, J/m2
Table 1: The average Gc plateau values in J/m2 at different
Page 6 of 7
6
while Fig. 7 shows a typical power law curves fitted to fatigue data points obtained for Adhesive-C at three different testing temperatures. Evidently, there is a temperature dependency in power-law coefficients obtained for each adhesive that means the fatigue performances are affected by temperature variation. The maximum cyclic force Fmax, at which a crack propagation of less than millimeter was observed after 106 cycles, was also
determined and normalized to corresponding fracture force. Table 2 gives a summary of power-law factors (first row for each temperature) and normalized Fmax for different adhesives at various temperatures. The most
elevated Fmax was 45% of corresponding fracture force that belongs to Adhesive-C at -40°C. It occurred at 20%
of its quasi-static Gc value (Gmax = 815 J/m2 that should be compared to Gc = 4069 J/m2. Fig. 8 shows a
comparison between fatigue curves obtained for the three adhesives at room temperature that clearly shows the best fatigue performance of this study corresponds to Adhesive-C.
Fig. 7: Temperature dependency in fatigue performance of Adhesive-C.
Fig. 8: Fatigue performances of selected adhesives at room temperature.
Gm ax , J/ m 2
G versus crack propagation (da/dN) at room temperature
y = 887.79 x0.1782 R2 = 0.8422 y = 2956.6 x0.2032 R2 = 0.9776 y = 5085.9 x0.1311 R2 = 0.6797 10 100 1000 10000 1E-08 1E-07 0.000001 0.00001 0.0001 0.001 0.01 0.1 1 10 da/dN, mm/cycle
Adhesive-A Adheisve-B Adhesive -C
Power (A) Power (B) Power (C)
Table 2: Power-law factor (1st row) and
normalized Fmax (2
nd
row) at 106 cycles for
the adhesives tested atdifferent temperatures.
Temp. Adhesive A Adhesive B Adhesive C Room 0.1782 0.2032 0.1311 39% 26% 39% 80°C 0.1377 0.2663 0.1928 41% 17% 22% -40°C 0.1377 --- 0.0794 45% --- 45% y = 5085.9 x0.1311 R2= 0.6797 y = 5123.1 x0.1928 R2= 0.9064 y = 4492x0.0794 R2= 0.5915 10 100 1000 10000 1E-07 0.000001 0.00001 0.0001 0.001 0.01 0.1 1 10 da/dN, mm/cycle Gm a x , J /m 2 22C 80C -40C Power (22C) Power (80C)
G versus crack propagation (da/dN) for Adhesive-C at three temperatures
Page 7 of 7
7
CONCLUSIONS
A series of quasi-static and fatigue tests have been conducted in this work on double-cantilever-beam specimens (DCB) in order to evaluate the mechanical performance of three 3M adhesives under monotonic and cyclic loading cases at room temperature, 80°C, and -40°C. The test results of this study revealed that the best fatigue performance corresponded to Adhesive-C at different temperatures. Both quasi-static and fatigue performances of adhesives were affected by temperature changes. Indeed, the reductions of 5%, 13% and 20% were
determined from quasi-static tests on Adhesives-A, B and C at 80°C, respectively. While the reductions of 16% and 15% were determined from quasi-static tests at -40°C for Adhesives-A and C. The fatigue performances of adhesives, on the other hand, were mostly decreased at 80°C, but an increase was observed at cryogenic
temperature for the tested adhesives. The maximum fatigue forces were varying between 26% and 45% of the quasi-static fracture force at different temperatures. Therefore, we can conclude that there is a significant
influence of fatigue loading on mechanical performance of adhesive joints that should be considered in adhesive joint design particularly at higher temperatures.
REFERENCES
1. Kinloch and Osiyemi, Predicting the fatigue life of adhesively-bonded joints, The J. of Adhesion, 1993, 43, pp. 79-90
2. Ashcroft et al., Mode I fracture of epoxy bonded composite joints: 2. Fatigue loading, Int. J. Adhesion and Adhesives, 2002, 22, pp. 151-167.
3. Erpolat et al., A study of adhesively bonded joints subjected to constant and variable amplitude fatigue, Int. J. Fatigue, 2004, 26, pp. 1189-1196.
CONTACT INFORMATION
Mojtaba Eskandarian, PhD
Structural Adhesives and Corrosion Group
Tel. (418) 545-5247 | Docufax (418) 545-5345, E-mail [email protected]
Aluminium Technology Centre (ATC) / Industrial Materials Institute / National Research Council Canada 501, boul. de l'Université Est, Saguenay (Chicoutimi), Québec G7H 8C3, Government of Canada
Robert Jennings, PhD 3M Innovation Center
Structural Adhesives NGV, 3M Center Bldg. 201-2W-17, St. Paul, MN 55144-1000. Tel. (651) 733-2578, E-mail: [email protected]
ACKNOWLEDGMENTS
The authors wish to acknowledge 3M Canada and Industrial Materials Institute (IMI/NRC) for their financial support. They also appreciate all the efforts of technical, administrative, and managing staffs in Aluminium Technology Centre (ATC), especially Myriam Poliquin, Michel Perron and Martin Pruneau for their technical assistances in performing mechanical tests, the fabrication of test setups and the liquid nitrogen installations.