Publisher’s version / Version de l'éditeur:
Supplemental Proceedings: Volume 1: Materials Processing and Properties, 1,
pp. 93-104, 2010-02-01
READ THESE TERMS AND CONDITIONS CAREFULLY BEFORE USING THIS WEBSITE. https://nrc-publications.canada.ca/eng/copyright
Questions? Contact the NRC Publications Archive team at
[email protected]. If you wish to email the authors directly, please see the first page of the publication for their contact information.
NRC Publications Archive
Archives des publications du CNRC
This publication could be one of several versions: author’s original, accepted manuscript or the publisher’s version. / La version de cette publication peut être l’une des suivantes : la version prépublication de l’auteur, la version acceptée du manuscrit ou la version de l’éditeur.
Access and use of this website and the material on it are subject to the Terms and Conditions set forth at
Characterization of hypereutectic Al-19% Si alloy solidification process
using in-situ neutron diffraction and thermal analysis techniques
Kasprzak, W.; Sediako, D.; Sahoo, M.; Walker, M.; Swainson, I.
https://publications-cnrc.canada.ca/fra/droits
L’accès à ce site Web et l’utilisation de son contenu sont assujettis aux conditions présentées dans le site LISEZ CES CONDITIONS ATTENTIVEMENT AVANT D’UTILISER CE SITE WEB.
NRC Publications Record / Notice d'Archives des publications de CNRC:
https://nrc-publications.canada.ca/eng/view/object/?id=56c26964-ed4e-48e6-bfba-5b049ceef0ee
https://publications-cnrc.canada.ca/fra/voir/objet/?id=56c26964-ed4e-48e6-bfba-5b049ceef0ee
CHARACTERIZATION OF HYPEREUTECTIC Al-19%Si ALLOY
SOLIDIFICATION PROCESS USING IN-SITU NEUTRON DIFFRACTION
AND THERMAL ANALYSIS TECHNIQUES
W. Kasprzak1, D. Sediako2, M. Sahoo1, M. Walker3, I. Swainson2 1 CANMET-MTL, Natural Resources Canada, 568 Booth St., Ottawa, ON, Canada 2 National Research Council, Canadian Neutron Beam Centre, Chalk River, ON, Canada
3 General Motors Corporation, Research and Development Center, Warren, MI, USA
Keywords: Hypereutectic Al-Si alloy, solidification, thermal analysis, neutron diffraction, primary Si
Abstract
In-situ thermal analysis and neutron diffraction techniques were used simultaneously to evaluate the kinetics of the non-equilibrium solidification process of Al-19%Si binary alloy. Feasibility studies concerning the application of neutron diffraction (source: NRU nuclear reactor, Chalk River, ON) for advanced solidification analysis were undertaken to explore its potential for high resolution phase analysis. Neutron diffraction patterns were collected in the stepwise mode during solidification between 740 and 400oC. The variation of intensity of the diffraction peaks was analysed and compared to the results of a conventional cooling curve analysis. Neutron diffraction was capable of detecting nucleation of the Si phase (primary and eutectic), as well as the Al phase during Al-Si eutectic nucleation. Neutron diffraction reveals the presence of Si peaks about 23oC above the liquidus temperature, as established by thermal analysis (i.e., 672oC). This illustrates the potential of neutron diffraction for high resolution melt analysis at near-liquidus temperatures, required for advanced studies of grain refining, eutectic modification, etc. The solid-to-liquid volume fraction was determined based on the change of intensity of neutron diffraction peaks over the solidification interval. Overall, the volume determined was in good agreement with the results of the cooling curve thermal analysis. This study will help to better understand the solidification mechanism of Al-Si alloys used for various component casting applications.
1. Introduction
The hypereutectic Al-Si alloy (about 16-23% Si) is recognized as an excellent material for high performance automotive cast component applications. Important examples include linerless engine blocks for passenger vehicles, and motorcycle cylinder blocks cast using high pressure die casting (HPDC) and low pressure permanent mold (LPPM) casting processes [1-6]. Such components could be heat treated using T5 or T6/T7 tempers for better in-service performance. The hypereutectic Al-Si melts at near-liquidus temperatures are recognized to have a heterogeneous distribution of Si atoms (clusters) with a short range atomic order [3, 7, 8]. Most of these heterogeneities act as solidification sites and facilitate the primary Si nucleation [7]. Most likely they exist in the liquid state significantly above the liquidus temperature. For this reason, the as-cast microstructure is highly dependent on liquid alloy processing parameters such as melt and pouring temperatures, as well as solidification rate. These parameters have to be precisely controlled during industrial practice, to achieve castings with controlled size and distribution of primary Si crystals. Due to the complex solidification process, including the tendency for a heterogeneous distribution of alloying elements at near-liquidus temperature,
Supplemental Proceedings: Volume 1: Materials Processing and Properties TMS (The Minerals, Metals & Materials Society), 2010
hypereutectic Al-19%Si binary alloy was selected for advanced assessment using neutron diffraction and thermal analysis techniques.
Thermal analysis techniques are conventionally used for evaluation of the solidification process under semi-equilibrium conditions [3-5, 10]. Recent advancements in hardware and software development [9] allow for better control of solidification parameters, including a wide range of solidification and melting rates, as well as melt environment control (vacuum, inert/active, elevated pressure). The direct effect of a minor addition of alloying elements (parts-per-million levels) could be difficult to quantify using cooling curve thermal analysis. The search for improved phase identification and detection capabilities has resulted in an attempt to utilize the neutron diffraction technique for solidification analysis. The advantage of using neutrons lies in the highly penetrating nature of neutron radiation, which ensures that the scattering observed is representative of the bulk of a test sample. Neutron diffraction could provide direct and independent phase assessment, as well as quantification of the solid-to-liquid fraction during the alloy solidification process. The feasibility of this concept has been evaluated.
The objective of this paper is to assess the suitability of neutron diffraction techniques for advanced solidification analysis of hypereutectic Al-19%Si binary alloy.
2. Experimental Procedure
2.1 Alloy Chemistry and Test Sample Design
The hypereutectic Al-19%Si alloy was used in the present “pilot” studies. The binary-alloy chemistry was selected, to minimize the effect of other alloying elements on neutron diffraction and thermal analysis signals. Such an approach allows for better validation of the suitability of neutron diffraction techniques for solidification analysis. Once the system’s sensitivity is established, more complex alloy chemistries will be evaluated in the future. Typically, commercial hypereutectic alloy, such as 390, besides containing 16-19% Si, also contains additions of Cu up to 4%, and Mg up to 1%. A phosphorus addition of up to 0.1% is used for primary Si refinement. This alloy, as well as its modified versions, is used for a variety of high performance castings; e.g., engine blocks and pistons manufactured using HPDC and LPPM technologies [1-6].
2.2 Thermal Analysis of the Alloy Solidification Process
Thermal analysis during the melting and solidification cycles was carried out using the UMSA Technology Platform [9]. This platform allows controlled melting, solidification, and heat treatment experiments to be performed for a stationary test sample, together with advanced thermal analysis of these processes. The experiments were performed using cylindrical-shaped test samples with outer diameter (OD) = 16 mm and length (L) = 18 mm, and were heated to 785±0.2ºC and isothermally kept at this temperature for a period of ten minutes, to stabilize the melt temperature and homogeneity. Next, the test samples were solidified at about a 0.5ºC/s cooling rate, calculated between the non-equilibrium liquidus (start of the solidification process) and the non-equilibrium solidus (end of solidification process) temperatures, 672 and 543ºC, respectively. To analyze the phase transformation temperatures for binary Al-19%Si alloy, the first-derivative-vs.-temperature and the fraction solid (FS) curves were automatically calculated and plotted. The FS was determined by calculating the cumulative surface area
between the first derivative of the cooling curve and the so-called baseline. The detailed methodology is described elsewhere [3, 4].
2.3 Neutron Diffraction during the Alloy Solidification Process
A novel solidification cell was designed and built to carry out controlled melting and solidification experiments under the simultaneous exposure to neutron radiation. The crucible containing the analysed alloy is placed inside the open titanium tubing filled with Argon, to prevent oxidation at higher temperatures. The thermocouples were calibrated based on the melting temperature of high-purity Al, with a precision of ±0.5oC. The thermocouple insertion depth into the melt was limited to 6.5 mm, to prevent its contribution to the diffraction pattern. The crucible inner diameter was 18 mm, the total height was 63.5 mm (sample material height 57 mm), the sample volume was 14 cm3, and its weight was about 32 grams. The neutron beam height in this setup was limited to 50 mm, to prevent “stray” peaks in the diffraction pattern coming from the control thermocouple. The test sample temperature was computer controlled based on the K-type sensor and PID circuit.
The solidifying Al-19%Si test sample, within a temperature range of 740 to 400oC, was irradiated with monochromatic thermal neutrons of wavelength 0.237 nm using a Si monocrystal, and a {311} reflection. Diffraction patterns were collected isothermally at the following temperatures: 740, 695, 660, 630, 600, 570, 560, and 400oC. Experiments were performed at the Canadian Neutron Beam Centre, and measurements were taken in terms of scattered intensity vs. diffraction angle PHI=2 (where is the Bragg angle), using the C2 spectrometer of AECL’s NRU reactor. The scattering angle ranged from 37 to 117 degrees for each run at each temperature.
3. Experimental Results
3.1 Thermal Analysis during the Solidification Process
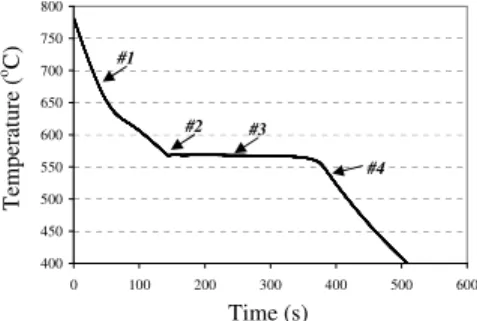
Thermal analysis of the Al-19%Si binary alloy solidified at about a 0.5oC/s cooling rate (instantaneous 2.5oC/s in the liquid state) revealed the liquidus temperature to be at 672.4oC (see Figure 1 and Table I).
Figure 1. Temperature vs. time cooling curve recorded for Al-19%Si binary alloy solidified at an average cooling rate of about 0.5oC/s. The corresponding microstructures are presented in Figure 3. The numbered arrows correspond to the metallurgical reaction and are outlined in Table I.
Time (s) T em pe ra tu re ( oC ) 400 450 500 550 600 650 700 750 800 0 100 200 300 400 500 600 #1 #2 #4 #3
At this temperature, the first primary Si crystals nucleated from the melt. Evolved latent heat caused the temperature of the surrounding melt to rise. This point was clearly visible as a sudden change occurring in the first derivative curve (point #1 in Figure 2). As the solidification process continued to progress, the primary Si crystals continued to grow. At 568.9oC, the next abrupt change in the first derivative curve corresponded to the nucleation of the Al-Si eutectic (point #2 in Figure 2). This was manifested by the positive value of the first derivative peak (see Figure 2). Solidification was completed at 542.7oC, which corresponded to the solidus temperature (point #4, Figure 2).
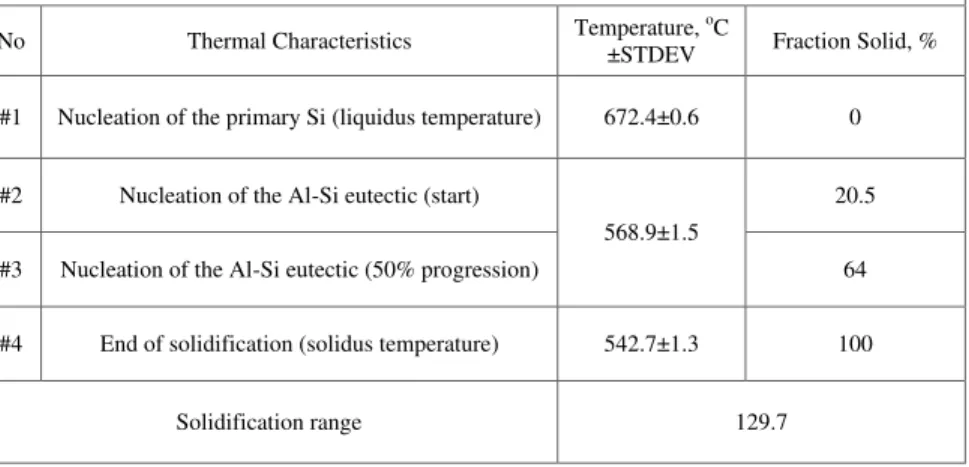
The FS vs. temperature curve for a solidification rate of 0.5oC/s is presented in Figure 2. A temperature Table I. Non-Equilibrium Thermal Characteristics of the Al-19%Si Binary Alloy Obtained during the
Solidification Process
No Thermal Characteristics Temperature, ±STDEV oC Fraction Solid, %
#1 Nucleation of the primary Si (liquidus temperature) 672.4±0.6 0 #2 Nucleation of the Al-Si eutectic (start)
568.9±1.5
20.5 #3 Nucleation of the Al-Si eutectic (50% progression) 64 #4 End of solidification (solidus temperature) 542.7±1.3 100
Solidification range 129.7
Figure 2. Superimposed first derivative (dT/dt) and fraction solid (FS) vs. temperature curves recorded during the solidification cycle of the Al-19%Si binary alloy at an average cooling rate of about 0.5oC/s. The numbered arrows correspond to the metallurgical reaction and are outlined in Table I.
Fi rs t D er iv at iv e (d T /d t) ( o C /s ) Temperature (oC) Fr ac tio n So lid ( FS ) (% ) #1 #2 #4
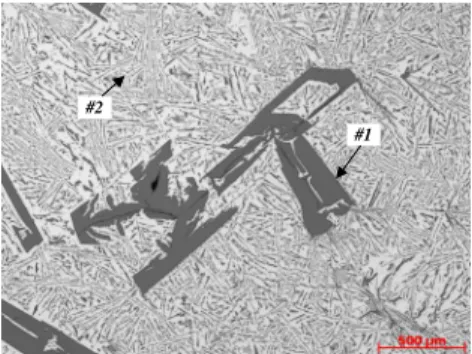
of 672.4oC signifies the nucleation of the primary Si crystals and corresponds to 0% FS. The growth of FS of the primary Si crystals as a function of temperature is linear up to 20.5%, which corresponds to the temperature of 568.9oC at which the Al-Si eutectic starts to nucleate. The approximate 20% FS at this point can be considered to be the volume fraction of primary Si, since this is the only phase that nucleates from the liquid within the temperature range of 672.4 - 568.9oC (see Figure 2, Table I). The temperature interval for the development of the primary Si crystals was very wide - about 103oC. In contrast, the nucleation and growth of the Al-Si eutectic was linear and took place under an almost constant temperature of about 569oC. For example, at 50% progression of the Al-Si eutectic reaction, the overall FS in the investigated alloy was about 64% (including both primary and eutectic Si) (see Table I). Metallographic observations of the binary Al-19%Si test sample that solidified under an average cooling rate of 0.5oC/s revealed coarse, unrefined primary Si and unmodified Al-Si eutectic (see Figure 3). The
length of the primary Si crystals was found to be up to 500 µm. It was observed that the microstructure of such a slowly solidified thermal analysis test sample was highly heterogeneous, caused by the lack of primary Si refinement and the tendency of primary Si for gravity segregation due to its lower density. 3.2 Neutron Diffraction during the Solidification Process
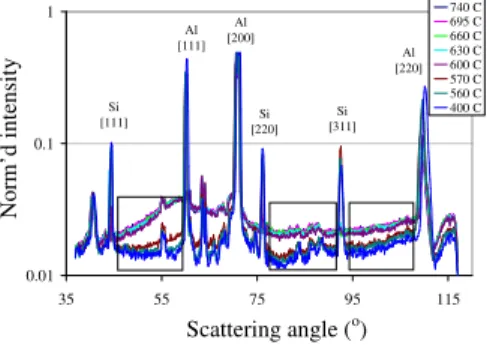
The neutron diffraction experiment was started with a no-sample furnace set-up, to retrieve the “background” that will be present in all measurements. For the selected neutron wavelength of 2.37 Å, several diffraction peaks observed in the “background” pattern can be easily attributed to various crystallographic planes reflections of titanium and steel - the materials used to build the solidification cell. Simple subtraction of the background data from the original raw-data patterns collected for the set-up with the sample metal typically results in a clearer “sample-only” diffraction pattern. Figure 4 depicts diffraction patterns received throughout the experiments, as the Al-19%Si melt temperature was reduced in the stepwise mode from 740 to 695, 660, 630, 600, 570, 560, and finally, to 400oC. As expected, no
Figure 3. Optical micrographs (50x) of the Al-19%Si binary alloy test sample solidified at an average cooling rate of about 0.5oC/s. Note unrefined primary Si crystals up to 500 m long (#1) and unmodified Al-Si eutectic (#2).
#2
new peaks were observed in the pattern received for the molten alloy at temperatures above liquidus at 740oC, but the diffraction intensity through the entire range of the scattering angle was increased due to inelastic scattering in the melt. The curved shape of the 740oC-line (as compared, for example, to the 400oC-line) suggests that it represents a pattern received for a liquid sample [11]. Other diffraction patterns in Figure 4 show peaks that represent diffraction by several crystallographic planes of the solid Al and/or Si crystals through the solidification interval. Integrated intensity of the peaks received at 400oC represents 100% FS.
The apparent peaks that could still be observed in the vicinity of the 70o and 110o scattering angles for the overheated molten Al-19%Si binary alloy was an artefact of a small temperature mismatch between the background data set and the sample data. These apparent peaks overlap with two crystallographic reflections of the sample material - namely, [200] and [220] reflections of Al. Unfortunately, this interference caused too much of an error for the [200] reflection, so this plane had to be removed from further analysis. As for the other diffraction peaks, as follows from Figure 4, the integral intensity can be used as reliable information that directly reflects the relative amount of solid phase that contributed to the neutron scattering. Analysis of the diffraction pattern for the Al-19%Si melt at 695oC showed that some solid Si exists in the melt. The diffraction peak (circled in Figure 4) that exists at about 44 degrees can only be attributed to the [111] reflection of Si. It is to be noted that 695oC is about 23oC higher than the liquidus temperature established from the thermal analysis experiments. Based on the intensity of this diffraction peak relative to the peak intensity at 400oC, the FS of Si in the melt at the given temperature will be quantified later in this paper.
Correspondingly, by collecting the diffraction patterns for the semisolid alloy for various temperatures within the solidification interval, one can retrieve valuable information on the dynamics of non-equilibrium solidification; for example, FS of Al and FS of Si vs. temperature of the melt, as a result of direct measurement and calculation of the integrated intensity of the diffraction peaks. This will also be discussed further in this paper.
Scattering angle ( o) N or m ’d in te ns it y Tem pe rature (Co ) Al 200 Scattering angle ( o) N or m ’d in te ns it y Tem pe rature (Co ) Scattering angle ( o) N or m ’d in te ns it y Tem pe rature (Co ) Al 200
Figure 4. Neutron diffraction pattern of the Al-19%Si binary alloy solidification process collected at various temperatures, ranging from 740oC (45oC above the equilibrium liquidus temperature) to 400oC (143oC below the solidus temperature).
3.3 Analysis of Fraction Liquid using Neutron Diffraction
Direct fitting of Gaussian functions into the diffraction peaks during solid-phase analysis could ignore the sample background underlying these peaks, which contains very useful information. It was reported in the literature [11] that there is decrease in the background underlying the solid phase peaks. A correction was required to account for the drop in the level underneath the peaks, which would cause a systematic understatement of the solid phase content as a function of temperature. This also implies that, if care is taken, then neutron diffraction is capable of simultaneously being an independent monitor of the proportions of both liquid melt and solid alloy inside the solidifying test sample.
Figure 5 represents the diffraction patterns received for the sample material at different temperatures. There is a clear difference in the intensity of the background signal for all between-the-peaks areas, which originates from the reduction in fraction liquid in a course of alloy solidification. This means that it is relatively simple to separate melt and solid scattering. This separation is done by performing a simple integration of scattering intensity over the range in which the change in the scattering pattern is only due to the change in the proportion of liquid; for example (1):
= Θ = Θ = = Θ = Θ Θ Θ Θ Θ 59 45 740 59 45 / ) ( ~ ) ( d d dI d d T dI T FL oC T (1)
where FL – fraction liquid at a given temperature, I – normalized scattering intensity, and Θ – scattering
angle.
The regions of the diffraction pattern immediately beyond the solid-alloy peaks can therefore be used as an indicator of liquid content in the sample volume. Three such regions were identified in Figure 5; namely, 45 - 59 degrees, 77 - 91 degrees, and 93.5 - 108 degrees of the scattering angle. Normalization was done in such a way that the initial liquid content at 740oC was 100%, and the liquid content at 400oC was 0%.
The results of this analysis are shown in Figure 6, along with two lines that represent the
non-Figure 5. Neutron diffraction pattern collected during the Al-19%Si binary alloy solidification process. Selected no-peak areas were used for the fraction liquid analysis.
0.01 0.1 1 35 55 75 95 115 740 C 695 C 660 C 630 C 600 C 570 C 560 C 400 C Si [111] [220]Si [311]Si Al [200] Al [111] Al [220] Scattering angle (o) N or m ’d in te ns ity
equilibrium solidus and liquidus temperatures determined from the thermal analysis carried out during the Al-19%Si binary alloy solidification process (see Figures 1, 2 and Table I).
It can be seen that all three curves obtained from the neutron data analysis are in reasonably good agreement. The fraction liquid is about 95% at about 10oC below the non-equilibrium liquidus temperature, and most of the solid phase evolves at the later stage of solidification (referred to as eutectic evolution in Section 3.1). It can be concluded from Figure 6 and Figure 2 that most of eutectic phase evolves between about 569oC and about 560oC, and down to 543oC.
We note, however, that we observed a diffraction peak from solid Si at 695oC (about 23oC above the non-equilibrium liquidus determined based on the thermal analysis experiments), see Figure 4. This peak indicated the presence of primary silicon crystals. As it is impossible to quantify the FS (of Si) using the liquid-phase data, we will try quantifying it while evaluating the scattering intensity by the solid-phase crystals.
3.4 Analysis of Fraction Solid using Neutron Diffraction
Figures 7 (a) and (b) depict the Si [111] and Al [220] peak evolution over the solidification interval and further cooling to 400oC. The integral intensity of the diffraction peaks is clearly increasing as each peak becomes higher and wider. The angular position of the peaks also changes as the temperature decreases, which corresponds to thermal contraction of the solid metal (i.e., a reduction in the lattice plane spacing reflected by the shift in Bragg’s peak position).
Similar to the liquid phase analysis, by performing a simple integration of the peak’s normalized intensity over the angular range that covers the width of the peak, one can retrieve the relative FS for the selected temperatures within the solidification interval of the alloy. For example, the following integration over a two-degree interval was applied for the [111] reflection of Si.
Figure 6. Fraction liquid curve obtained from neutron diffraction analysis of the Al-19%Si binary alloy solidification process.
Fr ac tio n L iq ui d (F L ) (% ) Temperature (oC) 0 10 20 30 40 50 60 70 80 90 100 540 560 580 600 620 640 660 680 700 720 740 from 93.5 to 108 degrees from 77 to 91 degrees from 45 to 59 degrees average Fraction Liquid Fraction Liquid for diffraction angle: Lines to guide eye only
Tsoli d u s ( fr o m T A )
The basic approach taken in this study was to simply pro-rate the integral intensity from zero at 0% solid (above Tliquidus) to 1 at 100% solid (below Tsolidus). We note that the angular position of the peak
(∠Si[111]) may not be exactly the same for the two integrals in Equation (2), subject to the
temperature-dependent peak’s position shift.
+ ∠ − ∠ ≤ + ∠ − ∠ Θ Θ Θ Θ o o solidus o o Si Si T T Si Si Si d d dI d d T dI T FS 1 ] 111 [ 1 ] 111 [ 1 ] 111 [ 1 ] 111 [ ] 111 [ ~ ( ) / ) ( (2)
The results of separate calculations performed for Si [111] and Al [220] are presented in Figure 8. In addition to this, Figure 8 also contains a fraction-solid profile received from the bulk liquid analysis (3.4 section of this paper) as FS = 1 – FL. The non-equilibrium solidification range and FS vs. temperature solidification profile determined by thermal analysis are also marked on the graph (see Figure 8). An important observation from Figure 8 is that solid Si starts evolving in the melt much sooner than solid Al, which is in agreement with the solidification sequence for the studied alloy. The presence of Si
Figure 7. Diffraction intensity change in the neutron diffraction experiments recorded during the Al-19%Si binary alloy solidification process between 740 and 400oC, for the following phases: a) Silicon [111], b) Aluminum [220].
0 0.01 0.02 0.03 0.04 0.05 0.06 0.07 0.08 0.09 43 43.5 44 44.5 45 45.5 740 C 695 C 660 C 630 C 600 C 570 C 560 C 400 C Silicon [111] 0 0.02 0.04 0.06 0.08 0.1 0.12 0.14 0.16 0.18 108 108.5 109 109.5 110 110.5 111 740 695 660 630 600 570 560 400 Aluminum [220] N or m ’d I nt en si ty Scattering Angle (o) a) b)
crystals (i.e., clusters) can be detected above the liquidus temperature (FSSi about 3%) and rapidly evolves to be in excess of 20% about 12 degrees below the liquidus temperature. On the other hand, solid Al evolves very slowly as the metal temperature decreases, but accelerates rapidly at temperatures below 600oC. This observation corresponds well with the earlier results of thermal analysis (see Figure 2) and liquid phase analysis (see Figure 6), which indicated that most of the alloy solidifies as eutectic within the temperature range of 570–560oC (to 90~95% solid), with solidification completion at about 543oC. The “overall” solidification profile represented by the line that was derived from the liquid-phase analysis (see Section 3.3) matches well with the results received for the solid Si and solid Al evolution, though, obviously, the profile lacks Al/Si-related specifics. The same is also true for the other line that also represents the “overall” solidification profile based on the thermal analysis data.
Regardless of the “classical” use of neutron diffraction for studies of solid metals in metallurgical research, the results presented show the potential of applying neutron diffraction for high resolution analysis of liquid and semi-solid alloy. It will be particularly interesting to explore further the near-liquidus melt characteristics, since neutron data revealed a Si signal above the near-liquidus temperature established by thermal analysis. The clustering of Si atoms prior to the start of the solidification process is not fully understood and requires further clarification, since it significantly affects primary Si size and distribution in cast components. This understanding can result in new characterization capabilities for detailed studies of grain refining, eutectic modification, etc. This outcome will contribute to better understanding of the solidification behaviour of the Al-Si hypereutectic alloys during casting processes such as HPDC and LPPM.
4. Conclusions
Neutron diffraction was used for the first time in studies of non-equilibrium solidification of metal alloys. This study focused on hypereutectic, binary Al-19%Si alloy. The neutron data collected allowed for no-bias analysis of the solidification process. These findings were supported by results of thermal analysis, as well as by microstructure evaluation.
Figure 8. Fraction solid evolution obtained during neutron diffraction analysis of the Al-19%Si binary alloy solidification process. Data were received from “liquid bulk” analysis and derived from Si [111] and Al [220] diffraction peaks.
0 10 20 30 40 50 60 70 80 90 100 540 560 580 600 620 640 660 680 700 720 740 % Solid Si [111] % Solid Al [220] % Solid (from liquid bulk) Thermal Analysis Tso li d u s T liqu id u s
Solidification Interval (from TA)
Fr ac tio n So lid ( FS ) (% ) Temperature (oC)
The following characteristics of non-equilibrium solidification of the Al-19%Si binary alloy were revealed in this research:
1. Thermal analysis performed on the solidifying alloy revealed a solidification range of 672oC (liquidus) to 543oC (solidus).
2. Thermal analysis and microstructural evaluation also revealed that the growth of FS as a function of temperature is linear up to 20.5%. This FS corresponds to a temperature of about 569oC, at which the Al-Si eutectic starts to nucleate. Most of the solid phase evolves as eutectic at the last stage of solidification within a very short temperature range below about 569oC.
3. Neutron diffraction indicated that there is solid Si present above the non-equilibrium liquidus temperature of 672oC. The content of solid Si in the melt at 695oC exceeds 3%. Si phase evolution above the liquidus temperature can indicate the agglomeration of clusters of primary Si.
4. Neutron diffraction could clearly detect the presence of solid Al only at 660oC, well below the liquidus temperature.
5. Neutron diffraction data confirmed that there is an obvious difference in the solidification path of Al and Si, with the latter evolving at a much higher rate during the early stage of solidification of the alloy (primary Si).
6. It was confirmed that the intensity of neutron scattering by the liquid metal can be used as an independent indicator of fraction liquid in the melt.
7. Accelerated solidification that can be observed in the solid-phase neutron diffraction experiments between 570oC and about 560oC matched well with the findings of the liquid-phase neutron diffraction analysis and the thermal analysis of the solidification process. This confirms that most of the FS evolves as eutectic within the temperature range of 569 to about 560oC, and down to 543oC. Based on the above results, further development of methods to apply neutron diffraction for studies of the non-equilibrium solidification of metal alloys is well warranted.
Acknowledgements
The authors would like to thank Renata Zavadil B. Sc. Eng. and Marta Aniolek M. Sc. Eng. from CANMET-MTL for assistance with for metallographic work and cooling curve analysis as well as University of Windsor for access to thermal analysis laboratory. The authors would like to acknowledge the support of the Advanced Structural Materials for Next Generation Vehicles (ASM-NGV) Program of Natural Resources Canada.
References
1. J. L. Jorstad, “The Progress of 390 Alloy: From Inception until Now”, AFS Transactions, 2009, 241-249.
2. Y. P. Telang, “Process Variables in Al-21Si Alloys Refinement”, AFS Transactions, vol. 71, 232-240 (1963).
3. W. Kasprzak, J. H. Sokolowski, H. Yamagata, M. Sahoo, H. Kurita, “The Effect of the Melt Temperature and the Cooling Rate on the Microstructure of the Al-20%Si Alloy used for Monolithic Engine Blocks”, International Journal of Metalcasting, vol. 3, Issue 3, Summer 2009, 55-73. 4. H. Yamagata, H. Kurita, M. Aniolek, W. Kasprzak, J. H. Sokolowski, “Thermal and Metallographic
Characteristics of the Al-20%Si High-Pressure Die-Casting Alloy for Monolithic Cylinder Blocks,” Journal of Materials Processing Technology, vol. 199, no. 1-3, 84-90 (2008).
5. H. Yamagata, W. Kasprzak, M. Aniolek, H. Kurita, J. H. Sokolowski, “The Effect of Average Cooling Rates on the Microstructure of the Al-20%Si High Pressure Die Casting Alloy used for Monolithic Cylinder Blocks”, Journal of Materials Processing Technology, vol. 203, 333-341 (2008). 6. J. L. Jorstad, D. Apelian, “Hypereutectic Al-Si Alloys: Practical Casting Considerations”,
International Journal of Metalcasting, vol. 3, Issue 3, Summer 2009, 13-43.
7. G. I. Eskin, D. G. Eskin, “Some Control Mechanism of Spatial Solidification in Light Alloys”, Zeitschrift fur Metallkunde, vol. 95, no. 8 (2004).
8. W. Wang, X. Bian, J. Qin, S. Syliusarenko, Metall. Mater. Trans. A 31 (9), 2163–2168, 2000. 9. M. Kasprzak, W. Kasprzak, W. T. Kierkus, J. H. Sokolowski, (U.S. Patent No. 7,354,491) (Canadian
Patent No. 2,470,127).
10. D. Sediako, W. MacDonald, S. Hibbins, “Mould Thermal Analysis in Direct-Chill Casting of Magnesium Alloys”, The Minerals, Metals & Materials Society, TMS, New Orleans, LA, March 2008, Magnesium Technology 2008, 215-219
11. I. P. Swainson, E. M. Schulson, “A Neutron Diffraction Study of Ice and Water within a Hardened Cement Paste During Freeze-Thaw”, Cement and Concrete Research, 31, 2001, 1821-1830.


![Figure 7. Diffraction intensity change in the neutron diffraction experiments recorded during the Al-19%Si binary alloy solidification process between 740 and 400 o C, for the following phases: a) Silicon [111], b) Aluminum [220]](https://thumb-eu.123doks.com/thumbv2/123doknet/14149164.471597/10.648.137.436.350.680/diffraction-intensity-diffraction-experiments-recorded-solidification-following-aluminum.webp)

