by
Anthony L. Owens
Submitted to the Department of Electrical Engineering and Computer Science on May 27, 1988 in partial fulfillment of the requirements for the degree of Bachelor
of Science.
Abstract
An automated alignment system for multi-mask exposures on optical substrates has been built and tested. This system is used in the binary optics fabrication program at M.I.T. Lincoln Laboratory to produce multi-level binary optic lenses.
At present, alignment of masks and substrates is done by simultaneous viewing under a microscope. Manual micrometers are used to perform the alignment.
The automated system includes a CCD camera mounted in the original microscope alignment port. The image received by the CCD camera is sent to a VICOM Image Analysis computer which detects and by image correlation aligns edges. Software, implemented in FORTRAN, computes the polar and translational offsets needed between masks and wafers. This offset controls a piezo-electric amplifier which drives a set of piezo-electric transducers for re-alignment.
Thesis Supervisor: Title:
Dr. Wilfred Veldkamp
Associate Group Leader of Opto/Radar Systems at M.I.T. Lincoln Laboratory
Dedication
I would like to thank Dr. Wilfred Veldkamp for supervising my thesis, and especially for giving
me the opportunity to work in such a stimulating environment as M.I.T. Lincoln Laboratories. Also, many thanks to Mr. Philip Bundman for pushing me forward when the project became more and more difficult. To Marsden Griswold, thank you for the immense technical expertise you shared with me throughout this project. This system is ultimately for you. To Dr. David Biron and Dr. Murali Menon, your help has proved invaluable to the success of this project. To my roommate Tom Wilson, thanks for being a friend even when the times really got rough. Finally, the ultimate thanks go to my parents. Without your support, I could not have survived these past four years. Let this be the first of many great thanks to you.
Table of Contents
Abstract 2 Dedication 3 Table of Contents 4 List of Figures 6 List of Tables 7 Introduction 81. Understanding the Automated Mask Aligner System 13
2. System Hardware 17
2.1 Microscope & Camera 17
2.2 Vicom Image Analysis Computer 20
2.3 AOB6 Digital-to-Analog I/O Board 22
2.4 Piezo-electric Transducers and Piezo-Electric Amplifier 26
2.5 Mounting PZT's to the Alignment Stage 27
3. Software Control 31
3.1 The PC Control Batch File 31
3.2 PC Control 34
3.2.1 VAX to PC Networking 34
3.3 The Image Correlation Program 36
3.4 CALIBRATE 40
3.5 Translate 41
4. Testing & Results 42
5. Conclusion and Suggestions for Improvements 48
Appendix A. Trouble Shooting The Vicom 50
Appendix B. Sony Trinitron and Sony XC57 CCD Camera 51
Appendix C. Specifications for the AOB6 Digital to Analog Board 52
Appendix D. Specifications for the piezo-electric translators 53
Appendix E. The LOGIN3.TSK program 54
Appendix F. The LOGIN.TSK program 55
Appendix G. The PC8.BAS program 56
Appendix H. The TRANSCOR routine 57
Appendix I. The CALIBRATE subroutine 58
Appendix J. The ROTATIONAL_CAL subroutine 59
Appendix K. The TRANSLATE subroutine 60
Appendix M. The HILLCLIMBPOLAR subroutine 62
List of Figures
Figure 1: Fresnel approximations and their diffractive efficiencies 8
Figure 2: MULTILEVEL PHASE STRUCTURE 1st ORDER DIFFRACTION 9 EFFICIENCY
Figure 3: BINARY ELEMENT FABRICATION 11
Figure 4: TWO-DIMENSIONAL MICROLENS ARRAY 12
Figure 1-1: The Components of the Aligner System 14
Figure 2-1: PRIMEL.VC 21
Figure 2-2: D/A board output options 22
Figure 2-3: Pin Assignments for D/A board 23
Figure 2-4: Dip switch configuration for 0-1OV operation 24
Figure 2-5: D/A Board Configuration 25
Figure 2-6: D/A board control routine 26
Figure 2-7: On-side view of the alignment stage 28
Figure 2-8: Top view of the alignment stage 29
Figure 3-1: Block Diagram of Control Software 32
Figure 4-1: Image intensity vs. Angle of rotational displacement 44 Figure 4-2: Image intensity vs. Angle of rotational displacement 45 Figure 4-3: Image intensity vs. Angle of rotational displacement 46
List of Tables
Table 2-1: Properties of the objectives
Table 2-Il: Resolution of the Objectives
Table 2-I1: Objective fields of view
17 18 19
Introduction
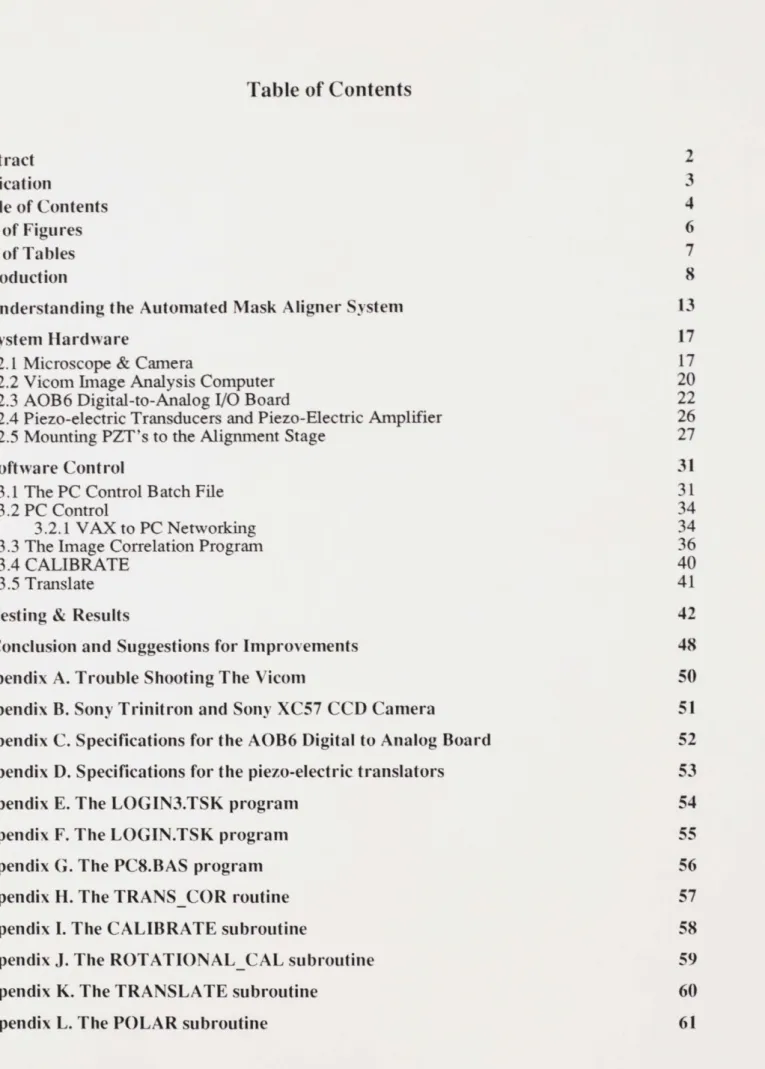
The function of the Binary Optics Fabrication Laboratory at M.I.T. Lincoln Laboratories is to fabricate novel optical components such as microlenses on optical substrates such as silicon dioxide, silicon, and germanium. These microlenses are used for conventional optics such as aberration corrected lenses, laser radar and passive surveillance applications. As their name implies, microlenses are extremely small. They can be on the order of 50 to 500 microns in diameter and are typically the thickness of a human hair. To make microlenses with continuous, aberration corrected profiles by conventional optics is very difficult with current machining tools. What we in the Binary Optics Fabrication Laboratory are doing is to utilize VLSI fabrication techniques to implement approximations of Fresnel phase patterns with a quality of
X/50. An example of what this approximation looks like is shown in the figure below.
A i100% w B 40.5% 27r CrV81.0% RADIAL DISTRIBUTION
Figure 1: Fresnel approximations and their diffractive efficiencies
sixteen level phase patterns. The efficiency of a lens structure is often expressed in terms of its ability to focus light into a particular point. Sixteen level approximations of Fresnel zone plate phase patterns have 99% efficiency. The relationship between the number of levels in the lens structure and the efficiency of that lens are illustrated in figure 2. The only way to improve the efficiency of these lenses is to increase the accuracy of the approximation.
100 - - 80so -z LU 20 -02 3 4 5 6 7 8 16
NUMBER NUMBER OF PHASE LEVELS
OF MASKS 1 2 3 4
Figure 2: MULTILEVEL PHASE STRUCTURE
1st ORDER DIFFRACTION EFFICIENCY
The way these lenses are fabricated is by first coating a silicon dioxide substrate, or other material, with a layer of photoresist. A mask with the necessary microlens pattern etched into it is brought into contact with the photoresist. The photoresist is then exposed through the mask by ultraviolet light. The exposed photoresist is chemically dissolved. The exposed silicon dioxide is then etched using reactive ion etching and the photoresist as the etch-stop. When the remaining photoresist is removed, one is left with a binary approximation of a Fresnel zone phase pattern.
In order to create more levels in the substrate, thereby improving the efficiency of a microlens, the above process must by repeated with a different mask. Another coating of
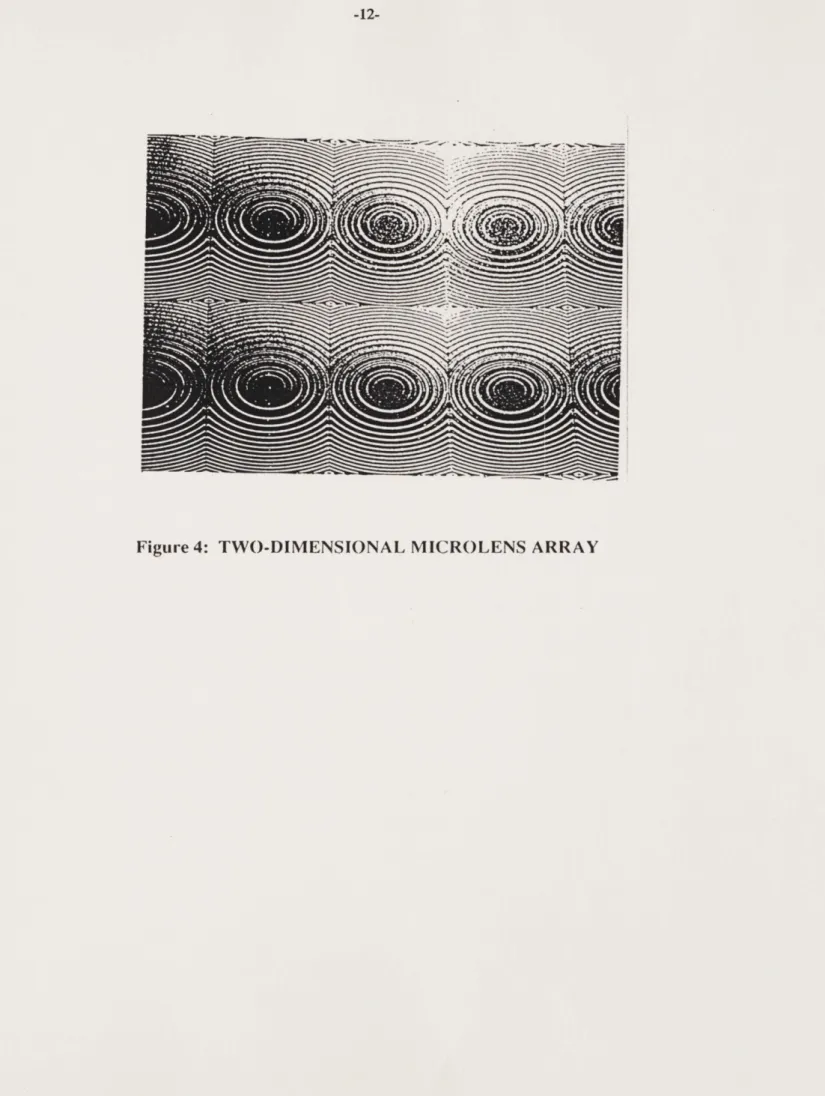
photoresist is applied to the silicon dioxide substrate. A second mask is brought into contact with the substrate. Once this second mask is aligned with the features already present on the substrate, the process of photoresist exposure and etching is performed just as before, resulting in a more accurate Fresnel lens approximation. This process is shown in figure 3. This same process can be used to make arrays of such lenses as shown in figure 4.
Herein lies the difficulty in producing multilevel optic lenses. Since the smallest feature sizes are on the order of a half micron in width (close to the resolution limit of a 40x microscope objective), the alignment of the second mask to the substrate is very difficult. The mask must be aligned to the features of a half micron in width already present on the substrate. Currently, a technician performs the alignment by looking at the mask and substrate under a microscope. He positions the substrate under the mask by adjusting a set of three manual micrometers. The task requires an experienced technician about an hour to perform.
The goal of my work is to expedite this tedious process by designing and implementing an automated mask aligner system for multilevel lens exposures. This system will automatically perform fine alignment of a mask and substrate by image correlation. A CCD (Charge Coupled Device) camera captures the images of the mask and etched substrate. These images are digitized
by a VICOM image analysis computer. I have developed an algorithm for correlating the two
images. This algorithm utilizes a fast hill-climbing technique for finding the translational and angular difference between two images. I have configured a computer to use the output of this algorithm to control the movement of piezo-electric translators. These piezo-electrics position the substrate underneath the mask. The piezo-electric devices offer an extremely high degree of accuracy (about 100 - 200 angstroms) which cannot be achieved with manual micrometers. Hence, they are a very important part of this system and their properties will discussed in later sections of this thesis.
BINARY
PHO1
AMPLITUDE
TORESIST
SUBSTRATE
EXPOSE
REACTIVE
PHOTORESIST
AND WET ETCH
ION ETCH
REMOVAL
FOUR-LEVEL
PHASE ELEMENT
Figure 3: BINARY ELEMENT FABRICATION
MASK
4
El,
Ug
Chapter 1
Understanding the Automated Mask Aligner System
As mentioned in the introduction, the mask aligner system automates the process of aligning masks to optical substrates. A diagram of the system is shown in figure 1-1. In this section I will outline how the system operates. I will describe in more detail the design and the testing of the individual system components in the sections to follow. The image correlation program is the brains of this entire project and its design, while only outlined here, will be described in greater detail in a later section. Prior to operating the system, the technician must check to see if the VICOM image analysis computer is operational. Appendix lists steps for troubleshooting the VICOM.
A Nikon microscope with a CCD camera attached to its body allows the technician to view
the mask and the substrate on a TV monitor simultaneously. The TV monitor has an additional benefit of allowing several people to watch the alignment process at once. A BASIC program on a Turbo-XT personal computer allows the technician to control the alignment process. When the technician turns on the PC and enters "align" followed by return, the PC starts a system control routine written in BASIC on the PC. The PC is connected via an RS232 line to a VAX mainframe in another room. After the PC starts the system control routine, the PC runs a batch
file which automatically logs the technician into an account on the VAX computer. Once the
technician is logged onto the VAX, the image correlation program starts automatically. The program asks the user to focus the microscope on the substrate. The user does so and hits a key. Then the program calibrates the system. The correlation program runs a calibration test. This is necessary because the alignment stage, microscope, and CCD camera do not always have the same orientation with respect to each other. The correlation program needs to have some frame of reference by which to do the correlation and hence the alignment. The program sends a command to the VICOM to digitize and store the image of the substrate on the VAX hard disk. Next, the program sends a command to the PC via the RS232 line. The system control routine,
PZT's
PZT AM
rLF
/7
PZT AMPLIFIER
Li
TURBO XT COMPUTER
WITH 6 CHANNEL DIA BOARD
Filcum.
.
Tka'-
C evee.-*s 4ke
Allgnr
TV MONITOR --- '
VICOM
VAX MAINFRAME
INPUT
OUTPUT
00' ___ I -N A 7 I 45 .s rft
iwhich is designed to trap messages sent over the RS232 lines, reads the message and moves one of the piezo-electric devices by a certain amount. The correlation program commands the VICOM to digitize and store this new image. With these two images the program computes the calibration factor for the alignment process. The correlation program then sends a message to the PC to move the piezo-electrics back to their original position.
Now the correlation program asks the technician to focus the microscope on the mask. The technician does so and hits a key. The technician does not have to do anything else. The correlation program once again commands the VICOM to digitize and store the image of the mask on the VAX hard disk. The correlation program calls two subroutines. The first subroutine reads the images of the mask and substrate from, the VAX hard disk and computes the coordinates of the centroids of the two images. The correlation program uses these coordinates to calculate the x-y offset (in pixels, as the image is represented on the VICOM monitor) between the mask and substrate. The second subroutine utilizes an iterative hill-climbing technique to rapidly calculate the angular offset between the mask and substrate.
So far all of the data calculated by the correlation program is in terms of pixel lengths. These x-y and angular displacement data have to be translated from pixel units into the voltage levels necessary to drive a set of piezo-electric transducers. This translation is performed by a subroutine called by the correlation program. How this translation is performed will described in the section on software.
The output of the correlation program is sent to the PC via an RS232 line. A data-trapping program written in BASIC on the PC stores this data as variables. A BASIC subroutine uses the variables to drive the PC's D/A (digital-to-analog) conversion card. The analog voltages that are the outputs of the D/A card drive an amplifier which, in turn, drives the piezo-electrics. Finally, the three piezo-electrics push the section of the alignment stage which holds the substrate into its desired orientation.
This is not a closed loop system. The system is designed to perform a highly accurate alignment on its first try. Real time feedback control cannot be accomplished in software because the number of calculations necessary to perform a correlation are too great.
Now that I have outlined what the system does, I will describe in detail how each of the individual hardware components operates and how they have been designed or configured to meet the needs of this thesis.
Chapter 2
System Hardware
2.1 Microscope & Camera
I feel that the best pieces of hardware to start off thesis with are those devices which provide the aligner system with its primary input. The key issues at this point of the thesis are
(1) resolution, (2) magnification, (3) field of view, and (4) depth of field. In this section I will
address these issues while a discuss how I configured this stage of the system.
The first step in the development of the automated mask aligner system entailed mounting a high resolution CCD camera to the body of the same Nikon microscope used for manual alignment. The Nikon microscope can be adjusted to utilize one of 4 different objectives: 5x,
40x, 60x, and 100x. The following table lists important data for these microscope objectives.
Working
Magnification Numerical Aperture Distance (mm)
5x 0.1 7.528 40x 0.5 5.26 60x 0.7 4.898 10Ox 0.8 3.264 Focal Length(mm) 37.64 5.26 3.49 2.04
Table 2-I: Properties of the objectives
The masks and substrate under the microscope can be examined using back or front illumination. Light entering the microscope through the objective lens is focused out to infinity.
This collimation of light inside the microscope is important in trying to implement television microscopy. The CCD camera that I chose to use was a Sony XC57 high resolution
black and white camera. The CCD contains 510x492 picture elements. The camera has a horizontal resolution of 380 lines and a vertical resolution of 525 lines. The minimum illumination for the camera is 3 lux. The sensing area of the CCD is 8.8mm x 6.6mm. I removed the camera's lens in order to expose the CCD to the collimated light within the microscope.
In order to allow many individuals to watch the alignment process at the same time, the video signal from the CCD camera is sent via a 75 ohm coax cable to the video input of a Sony Trinitron color monitor. The specifications for the Sony Trinitron and Sony XC57 CCD camera
are listed in the Appendix .
Two key issues are: (1) what is the resolution of the objectives and CCD camera together, and (2) how much of the specimen can be seen on the TV screen given the four objectives (i.e., the system's field of view). The resolution of a given objective (defined as the minimum resolvable spot size) of a given objective can be calculated from the following formula:
AxXF A
where Ax is the spot size in meters, X is the wave length of the light used to illuminate the specimen, F is the focal length of the objective, and A is the diameter of the objective lens. The assumed wavelength of light is 5500 angstroms. Using this value and the data given in table 1, we can calculate the diameter of the smallest spot resolvable by our objective lenses.
Magnification Ax(pm) 5x 2.80 40x 0.55 60x 0.39 10Ox 0.34 Table (2)
Table 2-II: Resolution of the Objectives
The resolution of this system is determined primarily by the objective lens. The CCD camera and television monitor can only reduce the total system resolution. The resolution of the
CCD camera is a function of its number of picture elements on a sensing area of 8.8mm x
100x objective a spot of 0.34m in diameter will be magnified to 34pm on the CCD. Since this is greater then the size of CCD picture element, system resolution is not reduced. For the 60x objective a 0.39pm spot will be magnified to 23.4m, which still fully encompasses a CCD picture element. As we decrease the objective magnification to 40x, resolution begins to drop dramatically. A 0.55pm diameter spot will be magnified to 22 pm. This spot diameter is still
greater than the diagonal of one picture element which is 21.9pm.
At 5x magnification the minimum spot size of 2.8pm will be projected onto the sensing
area as a 14prm spot. Since this is below the size of the picture elements, resolution will be determined by the size of the picture elements rather than by the objective lens. This means that the minimum resolvable spot size for a system using a 5x objective and a CCD camera is
21.9 jm-4 m
5
This is a poor level of resolution given that the smallest feature size can be less than Ipm. Thus, the 5x objective lens is used by technicians in the laboratory for roughly orienting the substrate underneath a mask.
In order to calculate the field of view of the system, consisting of the microscope's objective lens and CCD camera we divide dimensions of a CCD picture element by the magnification of the objective lens.
Objective lens Field of View
5x 1.32mm x 17.76mm
40x 0.165mm x 0.22mm
60x 83Rm x 147pm
10Ox 66tm x 88p m
Table 2-I1: Objective fields of view
Also, the Sony Trinitron TV monitor has a 2% zoom factor which reduces the effective field of view by 2%.
The final issue in this section is depth of field. This issue is important because one of the constraints on the aligner system is that it has to be able to focus on one image at a time, either the mask or the substrate. After testing the correlation program with various masks and
substrates I found that depth of field would not be a problem.
2.2 Vicom Image Analysis Computer
The VICOM Digital Image Processor is a combination of general purpose computational and image processing elements. The VICOM contains an internal microcomputer for direct user control but also has the capability of being operated as a peripheral device to the VAX computer for digitizing, subsampling and storing images.
The output of the CCD camera described in the section on optics is transmitted into a TV monitor in the clean room and into the video input port of the VICOM I/O Box. The VICOM I/O box can be found in the computer room on top of the VICOM disk drive unit. Occasionally, other workers in the laboratory must remove the CCD camera cable from the VICOM. Therefore, whenever one is using the alignment system, one must check that the CCD camera is connected to the VICOM. The cable is marked with a green tag and can be found behind the VICOM disk drive unit.
If the camera is connected to the VICOM, and the VICOM is switched on and functioning properly, the question becomes: What does the VICOM do to an image coming from the camera? When the VICOM receives a real-time image from a camera, the image is sampled as
512 x 512 pixel arrays. When the camera receives an image, each pixel is represented as a 16-bit
integer for logical and graphics operations. However, for my thesis, I am utilizing the images in mathematical operations. The VICOM manual states that if one wishes to use images for arithmetic operations one must convert the pixels from 16-bit integers to 16-bit two's complement numbers. In the next paragraph I will show how I did this. In two's complement format, pixels are scaled in amplitude between plus and minus one with an amplitude of zero representing black and amplitude of one representing white. I do not utilize the negative amplitude representations in this thesis.
When the operator digitizes the image, the last sampling of the real time image is loaded into one of four 512 x 512 x 16 bit memory circuit boards. Once an image has been digitized, the memory configuration of the VICOM can be changed in order to extract a 128x128 pixel subsection of the original image. This ability to extract and store a smaller section of an image is very important because it can reduce the number of calculations performed by the correlation program.
Now, I shall explain how I programmed the VICOM to perform the various tasks necessary for this thesis. As mentioned previously, one of the first tasks of the correlation program is to capture and digitize the image of the substrate. The correlation program does this
by calling a VICOM command file called PRIME1.VC. The mechanics of how the correlation
program calls a VICOM command file are explained in the software section. For now, allow me to focus on the VICOM itself. The PRIME1.VC file looks like this:
zer 1 vds clo=3 two (7) cam zer I vds clo=3 cam zer 1 vds clo=3 cam dig 2 mem 2>1 (128 128 128 128 1 1 1 1) Figure 2-1: PRIME1.VC
The "zer 1" command clears memory circuit board #1 by loading it with an image whose pixels all represent zeroes (black). The vds clo=3 command sets the VICOM's intemal clock source to phase-lock loop. Selecting phase-lock loop as the clock source is necessary in order to synchronize the VICOM with the CCD camera's signal frequency which is 59.94 hz vertically
and 15.734 khz horizontally (see Appendix . The "Two (7)" command performs the conversion from 16-bit integer pixel representation to 16-bit two's complement representation. The "cam" command activates continuous video acquisition from the CCD camera. Sometimes the VICOM's phase-lock loop does not perfectly lock onto the CCD camera's video frequency. The manifestation of this is a image that scrolls across the VICOM monitor. This is a problem because attempts to digitize a scrolling image can result in a split image. To solve this problem I repeat the above four commands, with the exclusion of the "two(7)" command, twice. Each successive iteration improves the phase-locking. The "dig 2" command digitizes the image and stores it into a secondary array. The MEM command removes a 128*128 pixel section from the center of the original image. Now the image is ready to be stored on the VAX hard disk.
2.3 AOB6 Digital-to-Analog 1/0 Board
By going from a discussion of the VICOM to describing the AOB6 D/A board, I have
skipped software control. However, I think it will be helpful to anyone considering using, repairing, or possibly redesigning this system if I separate the hardware issues from the software issues. With this in mind, allow me to describe the function of the AOB6 D/A board.
The AOB6 board is an analog/digital I/O expansion board for the IBM PC and its compatibles. The board is built by Industrial Computer Source (ICS). The board provides 6 channels of 12 bit analog output and 24 lines of digital I/O. The 6 independent 12 bit D/A
converters are individually switch and jumper selectable to the following ranges:
0to 10 volts 0 to 5 volts
-2.5 to +2.5 volts -5 to +5 volts
-10 to +10 volts
4-20mA current loop
Figure 2-2: D/A board output options
The D/A board has a rear 37 pin D type connector. Each D/A output uses one pin. See figure 2-3 for connector assignments. My application only requires 3 channels, which are indicated in the
L.L. GND. D/A #0 Out L.L. GND. D/A #1 Out L.L. GND. D/A #2 Out L.L. GND. D/A #3 Out DIG. COM. PBO PB1 PB2 PB3 PB4 PBS PB6 PB7 D/A #4 Out D/A #5 Out 19 37 18 36 17 35 16 34 15 33 14 13 31 12 30 11 29 10 28 9 27 8 26 7 25 6 24 5 23 4 22 3 3 21 PAO PAl PA2 PA3 PA4 PA5 PA6 PA7 PCO PCi PC2 PC3 PC4 PC5 PC6 PC7 L.L. GND. L.L. GND. 20
Figure 2-3: Pin Assignments for D/A board
PA Port PC Port
)
PB Port -I-i - i I i - - m"t-The purpose of the D/A board is to interface between the PC and the piezo-electric amplifier. The PC, by communicating with the VAX, has calculated how much a given PZT has to be moved by. The PC then converts this positioning data into a number between 0 and 4095
(12 bit decimal representation for 10). This number is written to the D/A card which converts this number into a DC voltage between 0 and 10 volts.
The piezoelectric amplifier that I am using requires input voltages between 0 and 10 volts.
I set the D/A channels to output in this voltage range by setting the board's dip switches to the
following configuration: 5
L20
Slider A (-Jfp) 101 10 5 Slider B 20 U B Slider C (BOTr1,tt)Figure 2-4: Dip switch configuration for 0-10V operation
The location of the dip switches on the board are shown below. Before inserting the board into the PC one must also set the jumper cables to voltage mode. The Base address switch is preset at &H300 (300 Hex, 768 Decimal). This address allows a software program on the PC to send data to the D/A card for conversion. Once the board has been plugged into the PC, one has to write a program to control the board. ICS provides the following BASIC program for performing this data transfer operation:
D/A 0 range D/A 0 transf jumper D/A voltage) jumper Base address switch switch fer /current -o:- _-; 2 Ei
7
3
LJ
- --D/A D/A D/A D/A D/A D/A -- D/A D/A D/A 0 0 0 1 2 2 2 iHoop zero zero adj. F.S. adj. Iloop zero zero adj. F.S. adj. Hoop zero zero adj. F.S. adj.D/A 3 Iloop zero
D/A 3 zero adj.
D/A 3 F.S. adj. D/A 4 Hoop zero D/A 4 zero adj.
D/A 4 F.S. adj.
5 hloop zero 5 zero adj.
D/A 5 F.S. adj.
Figure 2-5: D/A Board Configuration
D/A
1000 XH% = INT(D/256) 'high byte
1010 XL% = D - XH%*256 'low byte
1020 OUT BASE + 2*N, XL% 'write low byte to D/A
1030 OUT BASE + 1 + 2*N, XH% 'write high byte to D/A
1040 RETURN
D = data (range 0 - 4095 decimal)
N = D/A channel number (range 0-5)
Figure 2-6: D/A board control routine
2.4 Piezo-electric Transducers and Piezo-Electric Amplifier
Now that the computer will generate 0 to 10 volt signals, these same signals must be amplified in order to drive the PZT's. The amplifier chosen is a model CTC-265-1 high voltage
amplifier, built by Control Technics Corp. It can produce between 0 and -1000 volts at +/- 22
milliamperes. It has a slew rate of 6 volts/microsecond. The PZT's I am using are model
CTC-6095-15's (specifications are in Appendix ) which are also made by Control Technics. The
key issues in selecting what types of PZT's to use were:
1. maximum excursion
2. minimum excursion
3. maximum load capacity
The maximum excursion of these PZT's is 15 microns, which is sufficient for our application. Minimum excursion is important because the technicians have to align microlens features which are less than half a micron in width. The PZT's have to be able to make movements smaller than this. The CTC-6095-15's provide excellent resolution. If one divides the maximum excursion of the PZT's by their voltage range, the resolution of the CTC-6095-15's is 15/volt nanometers! Finally, the springs contained within the alignment stage are very strong and can generate up to
25 lbs of force on a PZT. In this respect the CTC-6095-15's provide a very sufficient safety
2.5 Mounting PZT's to the Alignment Stage
Mounting PZT's to the alignment stage is a task which must be done with extreme care because any movements by them would ruin an alignment. First I will describe the alignment stage itself and how one operates it. Then, I will discuss the issues that went into designing the PZT couplings. Finally, I'll describe how I designed the PZT's.
Figures 2-7 and 2-8 shows the alignment stage. The alignment stage consists of 3 levels. The first level, which is in contact with the table, does not move. A set of three manual micrometers are mounted to the stage at this level. The second level is a moving stage. The manual micrometer heads push against this level. Springs within the stage force this level of the alignment stage to the right and towards the operator. This stage also contains a holder for the optical substrate. Two fiber optic cables which enter the alignment stage from the rear of the stage have their terminations just below the substrate. These fiber optic cables provide helium-neon laser and diffuse back illumination to the substrate. Also, a tube from a vacuum pump terminates at the substrate holder to provide suction which holds the substrate in place.
The top level, which is mechanically uncoupled from the bottom stage, contains a holder for the mask. A tube from the vacuum pump enters the stage and terminates in an air-tight gap between the mask and substrate. When the technician completes an alignment, he applies suction pressure to contact the mask to the substrate.
If PZT's are to be mounted to the alignment stage, they should be mounted on the tips of
the manual micrometers already present. This allows the technician to perform gross alignment with the micrometers. Coupling the PZT's to the micrometers reduces the excursion range of the micrometers by about 3mm, however. The micrometers have an excursion range of 15 mm. Mounting PZT's to the tips of the micrometers moves the micrometers 9mm (the length of a PZT) away from the alignment stage. Therefore, either a new mount or an extension to the old mount must be designed. Clearance between the bottom of the PZT and the top of the first level of the alignment stage was a problem. Also, the PZT coupling must have a tight fit around the micrometer head. A tight fit will prevent the PZT from tilting when shear force is applied to its
=
7
Figure 2-7: On-side view of the alignment stage
I
A
I.
.l
/I,7~
tip in a direction perpendicular to its long axis. The PZT's have steel ball tips which are only
75/1000" in diameter. Since the alignment stage is made out of aluminum, the steel tips
eventually etch grooves into the stage. The tips then catch the ends of these grooves when the alignment stage is pushed laterally with respect to the PZT. I ordered the PZT's with the steel ball tips because they reduce friction between the PZT and the alignment stage. It is this friction which can cause rotation of the PZT away from the long axis of the micrometer. Finally, the position of the cable entering at the side of the PZT can also be a problem. A tight coupling fit around the micrometer head will cause the PZT to rotate about its long axis due to friction between the coupling and the micrometer head. Eventually, the cable would be forced against the first level of the alignment stage. This causes the cable to bend, damaging the inner conductor of the cable at the point of entry into the PZT where it cannot by repaired.
The following is a description of a design which solved these problems. I ordered the PZT's with tapped holes in their base so that a coupling could be screw-mounted into the PZT. I designed the sleeve of the coupling with a tight tolerance in order to avoid any lateral movement
by the PZT's. The micrometer head has a diameter of 0.197", so I designed the inside of the
coupling sleeve to have a diameter of 0.2005". The couplings are square and wide enough so that they are flush with the top of the first level of the alignment stage. Being square prevents the couplings and the PZT's which are attached to them from rotating and inflicting damage on the cables. Finally, I cut out 2" x 1/4" filar polished stainless steel strips (20/1000" thick) and epoxied them to the stage at the points where the steel ball tips of the PZT's make contact with the aligner.
Chapter 3
Software Control
So far, the alignment system, as I have described it, is just a mass of bones and uncontrolled muscle. Now I will describe the brain that makes it all work. The software that controls this automated mask aligner system can be divided into two main branches of control united by a single MS-DOS command-level language file. Figure 3-1 presents a high level block diagram of this software system. I will describe this system by first describing the configuration of the skull, the ALIGN.BAT program. Then I will describe the PC program. Finally, I will describe the VAX software.
3.1 The PC Control Batch File
My goal throughout this project has been to make this software package as non-interactive
as possible. I wanted to design the software system in such a way as to require as little information from the technician as possible. With this in mind I will begin describing the
ALIGN.BAT file.
The ALIGN.BAT file automatically executes the following commands as soon as the PC is tumed on:
cd mobius mobius
task login3 aowens (my-password) gwbasic PC8 /c:5000
This routine runs a task file, which automatically logs the user into an account on the VAX, and runs a BASIC program that captures data sent to the PC from the VAX via the PC's COML port. The "cd mobius" command sets the directory to the location of the MOBIUS program. MOBIUS is a PC-to-host integration software package marketed by Fel Computing. It is a powerful package which allows a user to custom design his/her own network to perform most any task
AL I GN.BAT
/ TRANSLATE CALIBR CALI B/
VAX
DISK
CAMERA
ATE
FIND-CENTER
VICOMT
HILL-CLIMB
POLAR
INTEGRATE
FIND
CENTER
Figure 3-1: Block Diagram of Control Software
D/A
PC8.BAS
TRANS.COR
HILL-CL IMB~
POLAR
requiring communication between a PC and a host. In my case the host is the VAX mainframe. I used MOBIUS for its terminal emulation capabilities. The "mobius" command activates the
MOBIUS system which was previously copied onto the PC's hard disk. The MOBIUS system
acts like an adjunct to the MS-DOS command level interpreter in that it allows the PC to recognize certain commands specific to the MOBIUS software package, such as "task."
The "task" command is a MOBIUS command which executes .TSK files. These files are batch files which execute MOBIUS commands. The LOGIN3.TSK file is listed in Appendix . The LOGIN3.TSK file was originally "LOGIN.TSK," which is a facility included with the
mobius software package. I had to modify this task file because it was not compatible with the
DEC-22 system. The original LOGIN.TSK is listed in Appendix .The lines of the original code which were deleted have been underlined, and lines which have been inserted are boxed. The
LOGIN.TSK program takes a usemame and a password and automatically logs the user into my
account on the VAX. Because of the incompatibility problem, certain commands such as "EnterTe" were not being recognized. LOGIN.TSK was unable to log one into an account and start a program running on the VAX. After discussing this problem with an engineering sales representative at Fel Computing, he came to the conclusion that I needed to order the updated version of the Mobius software package.1 Instead of ordering another MOBIUS package, I decided to delete the lines which were causing the problem and add the line "SEND 'run transcor'." This automatically executed the image processing control routine which has been written in FORTRAN for the VAX. I also added the line "send logout" to close the VAX account
once the alignment process was complete.
The "gwbasic pc8 /c:5000" command executes a BASIC program. This program controls the transfer of data from the VAX to the D/A board. It runs in parallel with the image processing control routine on the VAX. It will be described in detail in the following section.
'One thing I have learned by doing this project is that ordering equipment is process filled with too many
intangibles. I once ordered a set of PZT's through an engineering sales representative at Control Technics. After promising me that he could send them to me in less than two weeks, I did not finally receive them until two months and several phone calls later.
3.2 PC Control
The main control routine on the PC side of the alignment system package is PC8.Bas. While the Transcor routine is busy controlling the VICOM and performing numerous calculations, the PC8 program waits for the expressions "D/A", "ERRVIC","ERRCEN","FOCUS", or "VXDONE" to be received at the COM1 port. When it sees "D/A", the PC8 program processes the next 12 bytes, which will be necessary for driving the D/A card. "ERRVIC" signals the PC8 program to tell the user that the VICOM is not functioning properly. On an "ERRCEN" message the PC8 program tells the user that the misalignment is beyond correction by the PZT's. When the PC8 program sees "FOCUS", it asks the user to focus on the mask and hit return. Finally, the "VXDONE" string signals PC8 to end the alignment process.
3.2.1 VAX to PC Networking
A listing of PC8.BAS is in Appendix . The main issue in the design of the PC8.BAS BASIC program was the following: How do I make the PC "listen" to whatever is happening on the VAX and do something about it (i.e., drive the D/A board) when the VAX program writes something to the PC's screen? The question contains part of the solution. The ALIGN.BAT file executes some commands and put the PC into terminal emulation mode. Whenever the VAX program prints an alphanumeric, this entails sending the PC those same symbols via its COMI port. Hence, the solution to this PC-VAX networking problem was to find a way to monitor data entering the COMI port's I/O channel. In order for the PC8.BAS program to act when it receives a proper VAX command, it must know what the VAX command looks like. The commands are character strings which the VAX program prints to the screen, which means that it it has to be sent at the COM1 port. These character strings have the formats mentioned in the previous paragraph.
The command executed by line 20 allocates a buffer to support RS-232 communications with the VAX. This buffer is assigned the logical unit number 1 and can be treated as if it were a
file for the purposes of executing read's and write's. This statement specifies the COMI port as the "file" which PC8.BAS will read from. In order to allocate a buffer to the COMI port the parameters of the incoming data stream, such as baud rate, parity, and stop bit must be specified. In the case of the VAX, these data stream parameters are 9600 bits/sec, 0 for odd parity, and 7 (i.e., every seventh bit of the incoming data stream is a stop bit respectively). The DS and RS parameters suppress request to send and control data set ready "handshaking" at the COMI port. Without these parameters, the PC8 program cannot signal the arrival of data from the VAX FORTRAN program. The "ON COM(1) GOSUB 80" command creates an event trap such that whenever an ascii string arrives at the COMI port the program executes line 150. The program will stay in a loop until it sees something at the COML port. Line 150 is a check in case a null character is sent to the COM1 port.
As bytes arrive at the COM1 port, line 150 counts the number of bytes. Lines 170 - 190
load the incoming character stream into a one dimensional array buffer, B$. Next, the program performs a ring buffer operation. As more data enters the COMI port, it is attached to the end of the array which can hold up to 5000 characters (line 1). The program uses two pointers, I and J, to parse through the incoming data string and check it against a list of valid data strings ("D/A", "FOCUS","ERRVIC", "ERRCEN", "VXDONE"). "J," which points to a position within the incoming data stream, is constantly updated. "I" is updated whenever a match between a letter of the incoming data and a letter within the stored array occurs. As matches occur, a new array, C$,
is formed consisting of the valid letters matched so far. If a mismatch occurs at any time in the process, then J is reset to 1, and C$ is cleared.
If the "J" pointer reaches the end of the data string buffer, B$, before a complete string
match occurs, (an example of this is in line 280), the program goes back to line 150 to receive more data from the COMl port. If a string match occurs, the program transfers control to line
3000, 3100, 3200, or 3300 depending on what the valid data strings were. For example, when a
match occurs on "D/A", the next 12 bytes are stored into the string buffer J$ and control is transferred to line 4000. These 12 bytes contain the data necessary to control the PZT amplifier.
Lines 4100 - 4150 control the D/A card by using this data. When this operation is complete, a
message is sent to the VAX computer to continue its process. After a successful string match the program closes the file connected with the COMI port (line 480), erases the data contained in the ring buffer arrays B$ and C$ (line 470), and loops back to the beginning of the program. The program will continue execution until it receives "ERRCEN","ERRVIC"," or "VXDONE" at
which it prints a message to the user and ends.
3.3 The Image Correlation Program
Now, we are finally entering into, what I feel is, the control part of the alignment system.
Up until now much of what this thesis has dealt with has been hardware. Even the PC8.Bas
program is fairly hardware-intensive in that it (1) has to interact with the RS-232 port and (2) has to control a D/A board. However, in TRANSCORFOR we see a highly algorithm-driven software routine designed to produce data rather than signals.
In order to understand TRANSCOR, one must first understand its most fundamental task: correlating two images in X, Y and 0. By "correlation" I mean that process by which one finds out how much one has to move an image "left" or "right," "up" or "down," and by how much one has to rotate the image such that when it is overlaid above a similar image, the best match is
achieved.
In this thesis I have divided the problem of correlating two images into two parts. The first part deals with finding the x-y offset between the two images, and the second entails finding the
0 offset between the two images.
In order to calculate the x-y offset between the two images, I must first compute the coordinates of their centroids. I use the following algorithm to calculate the centroid of an image:
128 128
11 x(Intensity(xjy))
128 128
x1:1:(Intensiy(xjy)) X-OY=O
128 128
S y(Intensity(xjy))
128 128
S (Intensity(xjy))
The images as seen by TRANSCOR are two dimensional (128, 128) arrays. 128 x 128 pixels is the next lower image size below 512 x 512 that the VICOM will work with. Doing calculations on a 128 x 128 image is much faster than performing those same calculations on a
512 x 512 image. Using the algorithm above, calculating the centroid of a 128 x 128 image
requires 32,768 summations compared to 524,288 summations for a 512 x 512 image. Each array element contains a number from 0 to 1 representing the intensity of the image at that point. In my algorithm X represents columns and Y the rows. Once the centroid coordinates have been found, TRANSCOR subtracts the x and y centroid coordinates of the second image. The result
is the x-y offset between the two images.
Finding the angular offset between two images is more complicated and requires more computations. The purpose of the angular offset algorithm is to calculate the angle that you have to rotate one image so that it most closely matches a second image. The technique for doing this is the following:
1. Transform the x-y coordinates of the images into polar coordinates.
2. Rotate image #1 by a known delta-theta (i.e. 1 degree).
3. Multiply the two image arrays together.
4. Compare the multiplicand with the previous multiplicand.
5. Increment delta-theta by a known amount
6. Repeat steps 2-5 until the difference between successive multiplicands becomes
minimal. The desired value at this point is delta-theta.
There are several issues that arise in implementing this algorithm which I will address when I describe the hill-climb-polar and the integrate subroutines. Now, I will describe the implementation of TRANSCOR and its subroutines. Listings of the FORTRAN code can be found in Appendix .In the chapter titled "Understanding the Automated Mask Aligner System" I described in superficial terms what TRANSCOR does.
The first issue I would like to address concerns how TRANSCOR and CALIBRATE routines tell the VICOM to capture and digitize images. The way these programs control the VICOM is by calling three programs: vicprocess, vicinit, and vic 128. All three of these programs were written by Dr. David Biron, a computer scientist at Lincoln Laboratories. VICPROCESS accepts a file containing a list of VICOM commands and transmits them to the VICOM for execution. VICINIT is a program which initializes the VICOM hardware. VIC128 takes an image in a file called IMAGE.IM in my account on the VAX.
The second issue was how to read the images from the VAX disk when I needed them. I borrowed two more programs, which were written to perform this VAX retrieval task, from David Biron: diskrd and unpack. Diskrd reads a file with the given filename from the VAX disk and loads it into the two-dimensional array which can be used in any mathematical calculations. Unpack converts the data from 16-bit longwords into pairs of 8-bit words. IOSTAT is an integer returned by Vicinit indicating whether the Vicom initialization was successful or not. If the VICOM initialization is unsuccessful, then the Alignment System will not work. TRANSCOR and CALIBRATE check the iostat variable. If iostat is not equal to 1, the program sends a message to the user and ends. In Appendix , I list steps that one can take to trouble-shoot the VICOM.
FINDCENTER is a fairly straight-forward program. It implements the weighted average algorithm discussed earlier to compute the centroid of an image.
The HILLCLIMBPOLAR subroutine is designed to work for offset angles no greater than 10 degrees. I decided to "hard code" this value into my program so that the technicians would not have enter an angular correlation range every time they performed an alignment. Originally, I had written a subroutine called POLAR which computed angular offset by repeatedly rotating one image and multiplying it by the second image. It would rotate and multiply an image over a range of 10 degrees and use the "MAX" FORTRAN function to find the angle of rotation which produced a match. I found this technique to be extremely time consuming. This routine required 15 to 20 minutes to run. HILLCLIMBPOLAR cut this run
time down to 90 seconds. HILLCLIMBPOLAR uses a hill-climbing technique to find the maximum multiplicand. It starts at an offset angle of zero and calls INTEGRATE to compute the multiplicand. Then it rotates the first image, which is the image of the substrate, by a preset delta-theta of 0.2 degrees. If the second multiplicand is greater than the first by more than 2000
(I will discuss how I arrived at this number in the chapter about testing the system), the
subroutine rotates the first image by the difference between the maximum angular offset, 10 degrees, and the minimum angular offset, 0 degrees, divided by two. If the second multiplicand was less than the first by more than 2000, the subroutine rotates the image halfway in the other direction. The subroutines iteratively cuts the range of possible angular offsets in half until either the difference between two multiplicands is less than 2000, or the range of possible angular offsets is less than 0.3 degrees.
The INTEGRATE subroutine performs the bulk of the calculations for HILLCLIMBPOLAR. The main task of INTEGRATE is to rotate and multiply two image arrays. The image arrays and the rotational offset angles are supplied as input by HILLCLIMBPOLAR. INTEGRATE returns the value of the multiplicand. In order to understand the nested do loops and the long condition checks which the INTEGRATE routine performs, imagine a situation where you have two black and white postcards with pictures of checkered boards on them (see figure 3-2). Imagine now that a pin pierces both post cards through their centers. Also, the pin has a string attached. If you could somehow multiply the intensities of the two images by "eyeball", one way that you could do it would be to stretch the string out, so that it forms a radius to an imaginary circle. Starting from the center with the string at 0 degrees with respect to the x axis, you move from the center to end of the radial. As you go along, you would translate your radial and angular position into a position in Cartesian coordinates because the intensity elements that you are multiplying are squares not arcs. Also, as you move along the string, summing multiplicands as you go, you reach situations where the string goes beyond the edge of the post cards. At these points you would say the multiplicands are undefined (in the INTEGRATE routine they are defined as having 0 intensity. When you
radian
Figure 3-2:
reach the end of the string, you would rotate the string 1 degree and continue summing multiplicands. This process continues until the string has traveled 360 degrees and the entire postcard stack has been integrated. If INTEGRATE receives a entire postcard stack has been integrated. If INTEGRATE receives a rotational offset as input that is greater than 0, then the integration process starts with the radial at that given offset angle above the x axis of the first
postcard. The squares of the postcard directly beneath the string become the new x axis. The
integration is now performed as usual, but the resulting integral, of course, will be different.
3.4 CALIBRATE
At the beginning of TRANSCOR, the CALIBRATE subroutine is called. This subroutine is listed in Appendix . This routine calibrates the system. First, it waits for the user to focus on the substrate and hit return. Next, it controls the VICOM using the PRIME1.VC batch
file discussed earlier. A program written by Dr. David Biron, in our group, writes images from the VICOM to the VAX's hard disk.
"PRINT*, d_to_a" command to move the PZT's with -500, -750, -750 volts respectively. 2048,
3071, 3071 are the 12 bit representations of 5, 7.5, and 7.5 volts respectively. The PZT amplifier
amplifies these D/A outputs to -500, -750, -750 volts. Printing the dtoa variable initiates the process discussed in section 3.2.1 about PC8.
Next, the angular correction factor is calculated. This is necessary in order to define some absolute frame of reference for the system. Now the subroutine calls the ROTATIONALCAL routine which computes the rotational calibration factor of the system. This entails figuring out
by how much PZT#1 and PZT#2 have to be moved in order to achieve one degree of rotation.
ROTATIONALCAL is listed in Appendix.
3.5 Translate
This routine is listed in Appendix and is used to translate the data from TRANSCOR into the voltage levels needed to align the mask and substrate. It takes the offset data computed in TRANSCOR and angular and translational correction factors computed by CALIBRATE and generates the final voltage values by a trigonometric algorithm. These values are sent via the RS232 lines to PC8.
Chapter 4
Testing & Results
After configuring the system's hardware (CCD Camera, TV monitor, VICOM, PZT's, and
D/A board), the testing of the system consisted of three parts: (1) Image Correlation, (2) VAX to PC networking, (3) system test.
The first part of testing the system was to test the software's ability to rotationally correlate two images. My first version of TRANSCOR called the subroutine POLAR instead of HILLCLIMBPOLAR to compute the angular offset between two images. POLAR is listed in Appendix.
POLAR performs the same function as HILLCLIMBPOLAR except that instead of performing the fast hill-climbing technique discussed earlier, POLAR iteratively multiplies two images for a range of angles specified by the user. For each angle, the program writes the angle and multiplicand data to a file, which is used for drawing graphs of the data. The program continuously updates variables containing the maximum multiplicand of the two images and the offset angle at which this value occurred. This program required 20 to 25 minutes to run because of the vast number of computations executed.
I wanted to eventually use a hill-climbing approach to compute offset angles in order to
reduce this computation overhead. However, this required that the distribution of image multiplicand versus offset angle be a smooth Gaussian curve. If this curve was not smooth, the hill-climbing algorithm might mistake a local maximum in the multiplicand-offset angle curve for the absolute maximum value. This would produce a false offset angle.
Using the data written to file #99, I generated graphs of image multiplicand versus offset angle. Figures 4-1, 4-2, 4-3 show plots from three separate sets of images. In the first two plots we see lots of discontinuities. What caused this was that I was performing edge detection techniques on the images. This had the effect of passing the image through a spatial high-pass filter, adding spatial noise to the curve. However, figure 4-3 shows a smooth Gaussian-like
curve. In this case, no edge detection was performed on the image. Thus, much of the noise was reduced. The conclusion gathered from this experiment was that I could use the hillclimbing technique with non-edge-detected images.
Testing the HILLCLIMBPOLAR program was trivial now because it performed the same operation as POLAR but in fewer steps. To test HILLCLIMB_POLAR I used images stored on the VICOM disk. Using the VICOM, I could manually rotate an image and store it back onto the disk. Since I knew how much I had rotated the images by, it was a simple matter to test the accuracy of HILLCLIMB-POLAR. When I tested the program, I found the subroutine to be accurate to within 0.2 degrees. This means that for a substrate that was 1000pm wide, the correlation program would have a maximum offset error of 3.5Rm at the edges. To improve this I lowered the step size for rotating the image to 0.1 degrees and lowered the threshold value for minimum difference between multiplicands at different offset angles to 2000 units. This brought my angular resolution down to 0.1 degrees or 1.8 pm error over a distance of 1000 pm.
To test the PC8 networking program I wrote a test program in FORTRAN on the VAX which waits to receive a return key input from the PC and then sends over 500 characters back to the PC via the COM1 port. Embedded within the 500 characters was the data string "PLEASE
FOCUS ON THE MASK". This program allowed me to test several different issues: 1) Could the networking program run by just
hitting a return key?
2) Could the COM1 port handle over 500 bytes
arriving from the RS232 lines?
3) Can the program parse through all of the data
and pick out the string "PLEASE FOCUS ON MASK" .
Resolving the first issue required the use of the LIB$GETINPUT VAX library routine. In order to give the networking program the ability to handle vasts amounts of data arriving at the
COM1 port, I allocated 5000 bytes to the receive buffer. I implemented this memory allocation
in ALIGN.BAT via the statement "gwbasic align /c:5000". The last issue was resolved by implementing the "ring buffer" approach described in section 3.2.1.
Finally, the system as a whole had to be tested. The final test entailed using the system as outlined in the manner outlined in the introduction and seeing if it worked. And if so, how
C)
c
-o.c
G
c
W3o.
0.
0.
uo
)jjq
o
Figure 4-1: Image intensity vs. Angle of rotational displacement-44-09
0
x
0.7:)
0.
0.
0. C>/-O
-45-I I .--- I II
-II0.
O.
7,
0.
uo
o
19JJoj
Figure 4-2: Image intensity vs. Angle of rotational displacement2
-O0
0x
a) CT Ca'
-0.
00
-0.
0
a) (0 (-4.CD
0.0c-0.
0.0>
0. (91-0.
0
0.
0C
c.
7
.
i 0 O
-46-0.
0.
0. 0. 16$ -0.0
-0.
0
0.
O -4.-CD
0
0
UO'-;1o
-jJJoo
Figure 4-3: Image intensity vs. Angle of rotational displacementa
x
m
C
a-I I iaccurate was it. By the time that I had reached this stage, all of the individual components had been tested and shown to work. Also, the following interfaces had been tested and shown to work: 1) CCD camera > VICOM 2) VICOM <> VAX 3) VAX <> PC 4) PC > D/A > PZT amplifier 5) PZT's > alignment stage.
Since I knew that all of these interfaces worked, the only remaining issues were: (1) how accurate the correlation and calibration routines were, and (2) would the PZT couplings provide a stable enough platform for consistent PZT motions. The stability of the PZT's about the alignment stage proved to be the primary issue, and more stable couplings are being designed for them.