Biofuel Supply Chain Challenges and Analysis
bySooduck Chung
B.S. Materials Science & Engineering / B.S. Technology Management Seoul National University, 2009
Michael Farrey B.S. Mechanical Engineering
University of Dayton, 2002
Submitted to the Engineering Systems Division in Partial Fulfillment of the Requirements for the Degree of
Master of Engineering in Logistics
at the
Massachusetts Institute of Technology
June 2010 M AS SACHUSETTSLINS TIUT OF TECHNOLOGY
JUL 2 8 2010
LIBRARIES
ARCHIVES
© 2010Michael Farrey & Sooduck Chung
All rights reserved.
The author hereby grants to MIT permission to reproduce and to distribute publicly paper and electronic copies of this document in whole or in part.
Signature of A uthor... ... ... . ---...---- . -- -Master of E e Logistics Program, Eng ring Systems Division
May 8,2010
Certified by. .. . . .
Dr. Jarrod Goentzel Executive Director, Masters of Engineering in Logistics Program Thpsis 5aorvisor Accepted by...--- - - -I
ossi Sheffi Professor, Engineering Systems Division Professor, Civil and Environmental Engineering Department Director, Center for Transportation and Logistics Director, Engineering Systems Division
Biofuel Supply Chain Challenges and Analysis
by
Sooduck Chung And Michael Farrey
Submitted to the Engineering Systems Division on May 7, 2010 in Partial Fulfillment of the
Requirements for the Degree of Master of Engineering in Logistics
Abstract
Liquid fuels such as gasoline and diesel are traditionally derived from petroleum. Since petroleum has the potential to be exhausted, there is interest in large scale production of fuels from renewable sources. Currently, ethanol and biodiesel are liquid fuels that are mainly derived from field crops. This paper examines the supply chain challenges and issues that exist for bringing biofuel production up to scale. One major challenge that exists is how to transport the feedstock from a farm to a refinery in the most cost efficient manner. One way to improve
transportation efficiency of feedstock is to increase the energy density of the feedstock. However, increasing the density of a feedstock comes with a cost. We use switchgrass as a case study and examine the tradeoff between higher transportation costs in transporting a less energy dense feedstock to processing a feedstock to increase its energy density. We show that creating ethanol from switchgrass in the United States is not competitive in price to gasoline without government subsidies, but as the supply chain matures, efficiencies gained will narrow the gap.
Thesis Supervisor: Jarrod Goentzel
Table of Contents Abstract ... 2 List of Figures ... 5 List of Tables ... 6 1 Introduction... 7 1.1 Ethanol Background... 7 1.2 Biodiesel Background... 9 2 Feedstock ... 10
2.1 Feedstock for Ethanol ... 10
2.1.1 Virgin Feedstock... 11
2.1.1.1 Grains - Corn, W heat, and Sorghum ... 11
2.1.1.2 Non-grains - Sugarcane, Sweet Potato, and Switchgrass... 12
2.1.2 Residues ... 15
2.1.3 Corn... 16
2.1.3.1 Current Ethanol Production From Corn... 16
2.1.3.2 Location of Crop and Yield ... 18
2.1.3.3 W et M illing and Dry M illing... 19
2.1.4 Switchgrass ... 23
2.1.4.1 Current Production... 23
2.1.4.2 Location of Crop and Yield ... 24
2.1.4.3 Cellulosic Ethanol Production ... 26
2.1.5 Ethanol Conclusions ... 28
2.2 Feedstock for Biodiesel... 30
2.2.1 Virgin Feedstock... 30
2.2.1.1 Vegetable oils - Soybean, Canola, and Sunflower ... 30
2.2.1.2 Anim al fats... 32
2.2.13 Algae oils ... 32
2.2.2 Recycled waste vegetable oils ... 33
2.2.3 Soybean... 33
2.2.3.2 Location of Crop and Yield ... 34
2.2.3.3 Biodiesel Production from Soybean Oil ... 36
2.2.4 Canola ... 37
2.2.4.1 Current Production... 38
2.2.4.2 Location of Crop and Yield ... 39
2.2.4.3 Biodiesel Production from Canola Oil... 40
2.2.5 Biodiesel Conclusions... 41
2.3 Feedstock Conclusions... 42
3 Biofuel Supply Chain Overview ... 43
3.1 Feedstock Production... 44
3.1.1 Feedstock Production Supply Chain Decisions ... 45
3.1.2 Feedstock Production Challenges ... 45
3.2 Feedstock Logistics... 46
3.2.1 Feedstock Logistics Supply Chain Decisions ... 48
3.2.2 Feedstock Logistics Challenges... 48
3.3 Biofuel Production ... 50
3.3.1 Biofuel Production Supply Chain Decisions ... 51
3.3.2 Biofuel Production Challenges ... 52
3.4 Biofuel Distribution ... 53
3.4.1 Biofuel Distribution Supply Chain Decisions... 53
3.4.2 Biofuel Distribution Challenges ... 54
3.5 Biofuel End Use... 55
3.5.1 Biofuel End U se Supply Chain Decisions ... 56
3.5.2 Biofuel End Use Challenges ... 56
4 Cost Analysis for Ethanol Production with Switchgrass ... 57
4.1 Switchgrass Supply Chain Issues... 57
4.1.1 Switchgrass Production... 57
4.1.2 Switchgrass Harvesting... 60
4.1.3 Switchgrass Storage ... 63
4.1.5 Switchgrass Transport... 66
4.2 Economic Analysis of Switchgrass as a Feedstock for Ethanol ... 67
4.2.1 Planting and Cultivation ... 68
4.2.2 Harvest and Storage ... 68
4.2.3 Transportation from Farm to Refinery... 69
4.2.4 Refining and Destination Costs ... 70
4.2.5 Estimated Total Costs ... 71
5 C onclu sion ... 7 5 List of Figures Figure 1. U.S. Consumption of Ethanol... 8
Figure 2. U.S. Biodiesel Production, Exports, and Consumption... 9
F igure 3 . C orn ... 16
Figure 4. U.S. Corn Production and Use for Fuel Ethanol. ... 17
Figure 5. Corn for All Purposes 2008 Planted Acres by County... 18
Figure 6. Dry Milling Process... 21
Figure 7. W et Milling Process. ... 22
Figure 8. Figure of Switchgrass... 23
Figure 9. Land Available for Switchgrass. ... 25
Figure 10. Bioethanol Production Process... 27
Figure 11. Thermochemical Cellulosic Ethanol Production Process... 28
Figure 12. Yield of ethanol from each feedstock... 29
F igure 13. S oybean . ... 33
Figure 14. Soybeans 2008 Planted Acres by County... 35
Figure 15. Schematic of Biodiesel Production Path. ... 36
F igure 16. C anola... 37
Figure 17. U.S. Canola Oil Production and Demand 1987-2009. ... 38
Figure 18. Area of Canola as a percentage of area in chops in Canada, 2006... 39
Figure 19. Canola Planted Acres by County for Selected States in 2008... 40
Figure 20. Yield of biodiesel from each feedstock... 42
Figure 2 1. Five Stages of Biofuel Supply Chain. ... 44
Figure 22. 2012 cost competitive target... 51
Figure 23. Expected Switchgrass Harvest Yields by Region. (dry ton per acre) in 2005 ... 59
Figure 24. Advanced Options for Harvest and Collection of Switchgrass... 61
Figure 25. Automatic Mower... 61
Figure 27. Flow Diagram for Densification of Biomass to Pellets or to Small Particles... 65
Figure 28. Schematic Layout of a Typical Biomass Pelleting Plant... 66
Figure 29. Schematic View of Combined Method. ... 73
List of Tables Table 1. Projected Y ield of Sw itchgrass... 58
Table 2. Cost Comparison of Bailing, Loafing, and Chopping. ... 63
Table 3. Bulk D ensity of Switchgrass... 65
Table 4. Transport costs for each mode of preprocessing. ... 70
Table 5. Estimate Landed Cost at the Refinery for Combinations of Harvesting Method and R efinery Scale...-- ... - -. ---... 72
1
Introduction
During the past ten years, the United States has seen a great deal of growth in the liquid biofuel sector. A biofuel is a fuel that has been generated from a living or recently living
organism. The biological matter is known as a "feedstock" before it is converted into a biofuel. The organic nature of the feedstock makes energy sources considered "renewable." The two dominant liquid biofuels used in transportation are ethanol and biodiesel, and we will focus our discussion on these two products. First, we discuss the different types of feedstocks that can be used to produce these biofuels. Next, we discuss supply chain challenges for the biofuel industry. Last, we dig deep into the logistic issues involved in switchgrass to ethanol conversion starting at the farm and ending at the pump. Finally, a cost analysis of switchgrass is given for six
combinations of harvesting, preprocessing, and production scale options. The methods discussed differ by the way the switchgrass has been processed to increase the energy density of the feedstock during transportation.
1.1
Ethanol Background
Ethanol has been envisioned as a fuel for the automobile for over a hundred years. The first mass produced car, the Ford Model T, was designed to run on pure ethanol. In the time since, cars have strayed away from being able to run on pure ethanol. Ethanol is typically mixed with petroleum based gasoline. A typical car in the United States can run on a mixture called ElO. This nomenclature means the fuel has 10% ethanol and 90% gasoline. The U.S. does have blends
which go up to E85, 85% ethanol and 15% gasoline. However, E85 blend requires a special engine to accept this fuel. These vehicles are called "flex fuel" vehicles.
Figure 1 below shows the ethanol production, consumption, and importing of ethanol in the U.S. As the figure shows, in 2001 there was about 1.8 billion gallons of ethanol consumed in the U.S. Contrast this with 9.2 billion gallons consumed in 2008, and in just seven years the ethanol consumption has grown by over 520% (USDOE, 2010a). As the market grew and continues to grow, the supply chain must grow alongside and adapt to gain efficiencies and economies of scale where appropriate.
U.S. Production, Consumption,
and Trade of Fuel Ethanol
M) 0) 0 C0 0: 0 0 0 0 0D 0D a) M) 0 0D 0D 0D 0 0) 0 0D 0D V_ N N N ON N N N N' CM Net Imports Production -Consumption
Figure 1. U.S. Consumption of Ethanol. (source: http://www.afdc.energy.gov/afdc/data/fuels.htmI) 10,000 9,000 8,000 7,000 6,000 5,000 4,000 3,000 2,000 1,000 0 -1,000
1.2
Biodiesel Background
Biodiesel is another liquid biofuel that can be used to replace a traditional incumbent fuel. Biodiesel is similar to ethanol because it can also be blended with its fossil fuel counterpart, diesel. It also has the same naming mechanism. A mixture of 20 percent biodiesel, 80 percent diesel is called B20. B20 is commonly the highest blend which diesel engines will use without voiding the engine warranty. Pure biodiesel can only be run in special diesel engines without being blended.
Figure 2 below shows the production, exports, and consumption for biodiesel in the United States. The amount of biodiesel produced in the U.S. is roughly twenty times less than ethanol. However, biodiesel's growth on a percentage basis is dramatic. The amount of biodiesel consumed in 2008 was over thirty times more than the amount of biodiesel consumed in 2001. This rapid growth is expected to continue into the future as long as governmental mandates and subsidies for renewable fuels exist.
U.S. Biodiesel Production, Exports, and Consumption
700
600
500
E
400
M Production 0=
cc300
M Net Exports 0O 20
200
a Consumptiono 100
0
-100
2001 2002 2003 2004 2005 2006 2007 2008
Figure 2. U.S. Biodiesel Production, Exports, and Consumption.
(http://www.afdc.energy.gov/afdc/data/docs/biodieselproduction_consumption.xls) 9
2
Feedstock
In this section, we examine multiple feedstocks used to create biofuel which show promise to be brought up to scale in the United States. Feedstocks will be examined for both ethanol and biodiesel, as feedstocks for each have different characteristics. At the end of the broad feedstock overview for ethanol, corn and switchgrass are examined in further detail. For ethanol, corn has been the dominant feedstock thus far, but switchgrass has shown promise since it can be grown
with high yields in a variety of places. Next, after a brief overview of biodiesel feedstock, soybean and canola are discussed. Soybean has enjoyed a similar position in the biodiesel
industry when compared to corn in the ethanol industry. It is the incumbent feedstock, but canola has shown promise with potential for high yields on a per acre basis.
2.1
Feedstock for Ethanol
Ethanol is most commonly created through a process which first converts starches from biological matter to sugars. The sugars are then fermented to produce ethanol. In this section, we give multiple examples of ethanol feedstock followed by two feedstocks with potential to be brought up to scale: corn and switchgrass. In this section, yields will be given in terms of gallons of ethanol produced, and then a gasoline gallon equivalent number is provided as well since one gallon of ethanol is not energetically equivalent to a gallon of petroleum derived gasoline. Energy content of fuels is typically given based on British Thermal Units (BTU) and it takes roughly 1.5 gallons of ethanol to produce the same energy content as a single gallon of gasoline.
2.1.1 Virgin Feedstock
A feedstock is considered virgin feedstock if it is created from a crop whose intended
primary purpose is to be converted into a biofuel. Two types of virgin feedstock examined are grains and non-grains. An example of non-virgin feedstocks is recycled feedstock. Recycled feedstocks used to create ethanol are typically forest residue or organic material leftover from a crop harvested for food.
2.1.1.1 Grains - Corn, Wheat, and Sorghum
Corn, also known as maize, is the most widely grown food crop in the United States, and it is also the most commonly used feedstock in ethanol production in the United States, consisting more than 92% of feedstock used (USDOE, 2009b). In 2010, 13.1 billion bushels of corn are estimated to be produced domestically in the United States, and of this amount, 4.2 billion bushels of corn, or 38.4% of domestic production, are estimated to be used for ethanol production (Food and Agricultural Policy Research Institute [FAPRI], 2010). As recently as 2004 there was just over a billion bushels of corn being used to produce ethanol (FAPRI, 2010). The rapid growth of corn-based ethanol production may be linked the increased price of corn for food use since the amount of corn being used for ethanol is outpacing the increases in yields per acre and population growth.
Wheat is a grass cultivated worldwide, and originated from the Fertile Crescent region of the Western Asia. According to the Food and Agriculture Organization of the United Nations, wheat is the third most-produced cereal in the world (2010). The top world producer of wheat is China, which produced 109 million tonnes in 2007, followed by India with 75.8 million tonnes, and the
United States with 56 million tonnes (Food and Agricultural Organization of the United Nations
[FAO], 2010). The traditional usage of wheat is in food and beverage production. However,
ethanol production with wheat is maturing rapidly in the United Kingdom (Pagnamenta, 2009). It is seen as a promising biofuel feedstock for regions which are not optimal for growing corn. Two recently opened ethanol refineries in the UK are expected consume 2.3 million tonnes of wheat, and there is a possibility that ethanol production would make the United Kingdom a wheat importer for the first time in its history (Pagnamenta, 2009).
Sorghum is a tall annual plant (Sorghum vulgare) and belongs to the family Gramineae. This plant looks similar to corn and has similar usages. It is estimated that sorghum originated in Africa, and it historically has thrived in warm regions of Africa and Asia. Sorghum is known for its strong drought resistance and this is an attractive quality of the crop to potential importers, including the United States ("Sorghum", 2008). Sorghum can be grown on marginal land and also has broad agro-ecological adaptation. Moreover, sorghum uses nutrients efficiently, and the growth cycle of sorghum is about four months, relatively short compared with other grains (Sweet Fuel Project, 2010). The production of sorghum can be highly mechanized, so it has low labor costs. These advantages make sorghum attractive as a future feedstock for ethanol. 383 million bushels of sorghum are expected to be produced in the United States in 2010 (FAPRI, 2010).
2.1.1.2 Non-grains - Sugarcane, Sweet Potato, and Switchgrass
Sugarcane is any of six to thirty-seven species (depending on taxonomic system) of tall perennial grasses of the genus Saccharum. Sugarcane is an Asian-native tropical grass and known to be first cultivated in India. Because of its large terminal panicle and nodded stalk,
sugarcane appears to be similar to corn and sorghum ("Sugarcane", 2008). Sugarcane offers a high energy balance and high greenhouse gas (GHG) reduction so is considered to be sustainable. Ethanol production from sugarcane has not been shown to have significant impact on food
supply or prices in Brazil. They produced a third of the total world sugarcane production in 2007,
by producing 550 million tonnes (metric tons) (FAO, 2010). This makes them the biggest
producer of sugarcane in the world. Due to this large amount of sugarcane production, ethanol is widely used in cars in Brazil. In Florida, whose climate is similar to Brazil's, one acre of
sugarcane field yields roughly 405 gallons of ethanol (Rahmani & Hodges, 2006). This number is derived under the assumption that only sucrose, sugar, is used for the ethanol production. After Brazil, India is the 2nd largest worldwide producer of sugarcane with production of 355 million tonnes, and the United States is 9th worldwide in sugarcane production with 27.8 million tonnes
(FAO, 2010).
Sweet potato (Ipomoea batatas) is an annual root plant and belongs to the family of
Convolvulaceae. Its root is starchy and sweet so it is commonly used as food. Despite its name, the sweet potato is not closely related to the potato (Solanum tuberosum). Sweet potatoes are a member of the morning-glory family (Convolvulaceae), while potatoes belong to the Solanaceae family, along with tomatoes, red peppers, and eggplant ("Sweet Potato", 2008). The sweet potato production in the United States in 2007 amounted to 1.8 million pounds (about 837,000 tonne) and is growing moderately (FAO, 2010). There has been an increasing amount of research dedicated to analyzing its viability as a future feedstock. Researchers from North Carolina State University reengineered the sweet potato and improved the starch content in it. Although it does not taste as good as normal sweet potato, this new sweet potato can produce twice the starch content of corn, which can be broken down into sugars for ethanol production (NCSU, 2007).
However, the high transplant cost of sweet potatoes still remains a challenge. Sweet potatoes are planted by manually transplanting them to the ground. Craig Yencho, an associate profecssor of Horticultural Science at N.C. State, is trying to find a way to plant sweet potatoes in the same way Irish potatoes are being planted, which is mechanically planting 'seed parts' to the ground.
(NCSU, 2007) If they successfully achieve this goal, the planting cost would be reduced by half,
and ethanol production with sweet potatoes can be much more cost effective and feasible when compared with ethanol production with corn (NCSU, 2007).
Switchgrass (panicum virgatum) is a perennial grass which originated from warm regions of North America, and is widely distributed in Mexico, the United States, and Southern Canada. Switchgrass has a deep and strong root system so it can be grown on marginal land, not suitable for the production of most crops such as corn. Therefore, the land used for the production of food crops does not need to be sacrificed to grow switchgrass. Switchgrass has been conventionally used as ground cover to conserve soil and prevent erosion, and is suitable to grow on land used for foraging and grazing (Rinehard, 2006). In addition, switchgrass can also be used as a
feedstock for biofuels such as ethanol, and it can be genetically altered to produce biodegradable plastics as a byproduct. The use of switchgrass for the production of biodegradable plastic was investigated starting in 2008 by Metabolix, a company based in Cambridge, Massachusetts. According to its website, www.metabolix.com, the Metabolix research team has developed a way to produce polyhydroxyalkanoates (PHAs, a biodegradable polyester) from switchgrass, adding to the value of the crop.
2.1.2 Residues
Residues from crop processing, logging and forest operations can be used for ethanol production. Theoretically, all materials that can be broken down to sugar have potential as feedstock for ethanol. According to the researchers from Michigan State University, 130 billion gallon of ethanol can be produced annually from crop residues and wasted crops. Total dry wasted crops in the world could be converted to 13 billion gallon of ethanol, and other lignocellulosic biomass, such as corn stover, sugarcane bagasse, and wood residues, could be converted to 117 billion gallon of ethanol annually (Kim & Dale, 2004). However, there should be careful assessment on the use of crop residue for ethanol production. A researcher from
Kansas State University argues that removal of crop residues from agricultural cropland would directly influence the quality of cropland and require the change of field management practices (Blanco-Canqui, 2010). In addition, the logistics of the crop residues is not cost-efficient, since the energy density of the residues is so low. At the same time, the production of ethanol from this residue is more costly than production from crops.
2.1.3 Corn
Figure 3. Corn. (source: http://en.wikipedia.org/wiki/File:Koeh-283.iR)
This section goes into greater detail about the current corn consumption in the United States. Corn is primarily grown in the upper Midwest, but it is not limited to this area. It grows here because the soil allows high yields and there are established croplands. We examine sample yields for corn in different parts of the U.S and explain two different ways to convert corn into ethanol. These processes, known as wet milling or dry milling, are discussed at the end of this section.
2.1.3.1 Current Ethanol Production From Corn
In the United States, corn historically has been predominantly grown for feed, sweeteners, cereals, or sold as an export. In recent years its use as the primary feedstock for ethanol has shown exponential growth. As shown below in Figure 4, the amount of corn being used for ethanol started to grow greatly starting around 2001. According to the Biomass Energy Data
Book, 706 million bushels of corn were being used for conversion to ethanol in 2001 (Wright, Boundy, Badger, Perlack, & Davis, 2009). When compared to 2008's 3,600 million bushels of corn harvested for ethanol production, this shows over 500% growth in that short period of time
(USDOE, 2009c). This equates to 30% of all domestic corn consumption in 2008, rising to an
expected 38.4% in 2010 (FAPRI, 2010). It has remained the dominant feedstock for ethanol. In
2006, over 92% of ethanol production was derived from corn, roughly 4,500 million gallons (USDOE, 2009c).
U.S. Corn Production and Use for Fuel Ethanol
14,000 12,000 0 10,000 (02
8,000
*
-- ProductionC 6,000 -=- Used for ethanol
-_
4,000
2,000 (0 M0 0 N (0 M o N "I ( 0 a) 0 o ) 0 Ca o o 0 0) ~ ) ~ )0 ~ a 0CD ( 0 0 YearSource: AFDC
Figure 4. U.S. Corn Production and Use for Fuel Ethanol. (Source: USDA National Agricultural Statistics Service and Economic Research Service)
2.1.3.2 Location of Crop and Yield
As Figure 5 below shows, corn is primarily grown in the upper Midwest in a region
known as the "corn belt." States with high amounts of corn farming are: Illinois, Indiana, Iowa, Kansas, Michigan, Minnesota, Missouri, Nebraska, Ohio, South Dakota, and Wisconsin. Illinois and Iowa are the two largest corn-producing States in the United States, producing just under
30% of the national corn crop (USDA, 2008b).
Corn for ain 2009
Production by County and Location of Ethanol Plants As of January 14, 2009
< IBom PsA~W
10 M eo - 14 -- Y-49 P%
0W^* 9 *A1 S4 C
Figure 5. Corn for All Purposes 2008 Planted Acres by County. (source:
http://www.nass.usda.gov/Chartsand_Maps/EthanolPlants/U._S._EthanolPlants/index.asp)
Figure 5 also shows the location of ethanol plants, where corn is the primary feedstock used to produce ethanol. As one would expect, the ethanol plants are commonly located closely
to the fields where corn is grown. This is because corn has less energy density than ethanol. It is more cost efficient to transport ethanol fuel longer distances rather than the feedstock because of this energy density difference. Hence, the fuel is produced in the upper Midwest and shipped in its most energy dense stage, as a liquid fuel, to where the demand exists.
It is estimated that in 2010, farmers in the United States will have a yield of 165.2 bushels per acre, leading to 444.4 gallons of ethanol of yield per acre for wet milled corn or 452.6 gallons if it is dry milled (FAPRI, 2010). This equates to a gasoline gallon energy equivalent of 296.3 gallons of gasoline for wet milled corn and 301.7 gallons of gasoline
equivalent for dry milled corn. Traditionally the amount of crop grown per acre and efficiency of the process to convert corn into ethanol will both increase from one year to the next. These trends both lead to an increase of ethanol produced per acre of corn planted from one year to the next. However, one must keep in mind that yields do vary from region to region. In 2008, the
USDA published Agricultural Statistics which 2007's contained corn yields per state. The State
yielding the lowest bushels per acre of corn planted was Alabama with 79 bushels per acre; this is in contrast to Washington which yielded 210 bushels per acre. The two States which produce the most corn, Iowa and Illinois had statewide yields of 171 and 175 bushels per acre
respectively (USDA, 2008b).
2.1.3.3 Wet Milling and Dry Milling
To be converted into ethanol, corn must undergo a fermentation process. A different process, cellulosic conversion, is discussed for switchgrass being used as a feedstock. There are two different processes for creating ethanol from corn: dry mill or wet mill processing.
dominant. Dry milling plants are much smaller than wet-milling plants and require much less energy to operate (USDOE, 2009d).
The U.S. Department of Energy describes both the wet milling and dry milling process on its webpage titled "Starch- and Sugar- Based Ethanol Production" (2009d). A high level
overview for both milling processes follows which was summarized largely from this webpage.
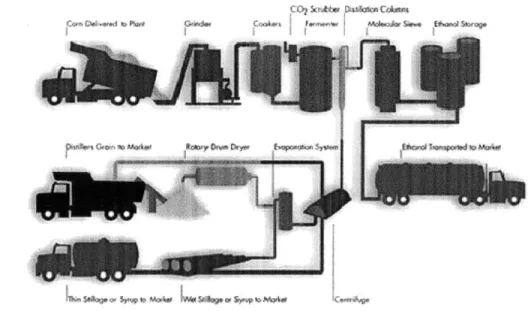
In dry milling, the corn is ground to a pulp the consistency of flour. Next, water and enzymes are mixed with the corn, with an increased temperature to change the starches to glucose. Now the mixture is cooled and yeast is added which ferments the mash producing ethanol. Figure 6 below shows the dry milling process from feedstock to end product. Note there
are multiple byproducts of the process which all contribute to the profitability of the crop. For one there is the ethanol to be used as a fuel. Other outputs are dried distillers grains with soluble
(DDGS) used in livestock feed due to its high protein content and also carbon dioxide released
during fermentation can be sold to the soft drink industry (Renewable Fuels Association [RFA], n.d.).
Figure 6. Dry Milling Process. (source: http://www.ethanolrfa.org/resource/made/)
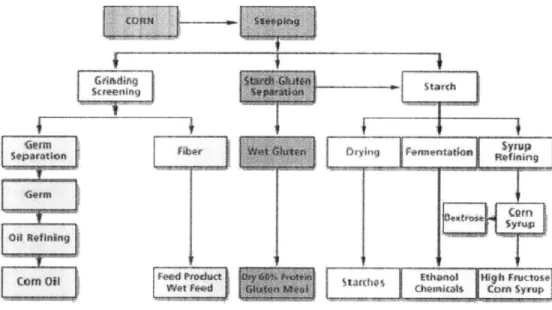
For the wet-milling process, the main outputs of the process are ethanol and corn
sweeteners. First, the starch and protein in the corn grain are separated by placing the grain in hot water. The solution is then ground and processed, extracting byproducts via a set of steps which ends with the starch being dried to produce sweeteners and the sugars fermented into ethanol
(USDOE, 2009d). Figure 7 shows the wet milling process for corn. Similar to dry milling, there
are also other outputs to the wet milling process than only ethanol. The Renewable Fuels
Association lists multiple byproducts which add to the processes' profitability. (n.d.) Corn oil is one byproduct extracted from the corn. Additionally, a corn gluten meal product of the wet milling process is sold to the livestock industry. Completely unrelated to the food industry, the residual water leftover from the process can be used as an alternative to salt to melt ice from roads. Lastly, any starch leftover can be fermented into ethanol similar to the dry mill process,
Figure 7. Wet Milling Process. (source: http://www.ethanolrfa.org/resource/made/)
Dry milling and wet milling are different processes and consequentially both have different yields of ethanol per bushel of corn. Dry milling currently produces 2.74 gallons of ethanol per bushel of corn and wet milling produces 2.69 gallons of ethanol per bushel of corn (FAPRI, 2010). Thus, dry milling is slightly less than 2% more efficient for ethanol conversion than wet milling. Dry milling is more common than wet milling because it uses less energy per gallon of ethanol produced, and is typically optimized for ethanol production. (USDOE, 2009d).
2.1.4 Switchgrass
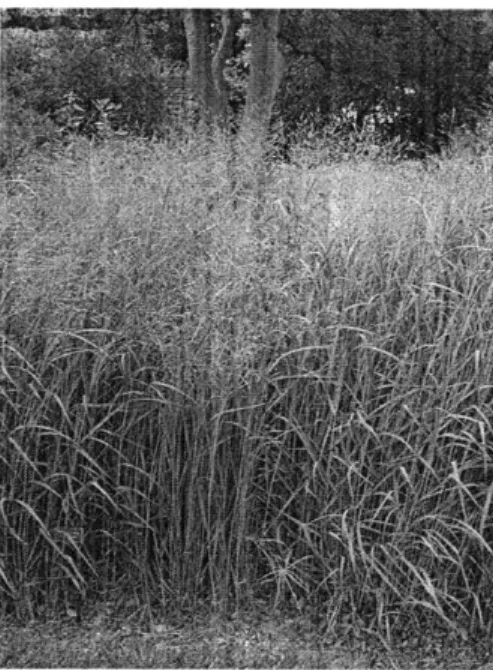
Figure 8. Figure of Switchgrass. (source: http://en.wikipedia.org/wiki/File:PanicumVirgatum.iog)
This section goes into greater detail about the current state of switchgrass farming in the United States. Switchgrass is a native crop to the U.S. and can be grown in most areas across the country, but States such as North Dakota have a great deal of land available which could support switchgrass farming. We identify two different ways to convert switchgrass into ethanol, through biochemical or thermochemical conversion, and they are discussed at the end of this section.
2.1.4.1 Current Production
Switchgrass currently is not a major crop grown for biofuel, but it shows great promise. First, it is a native crop to North America, so it will naturally resistant to pests, diseases, and requires little fertilizer to achieve high yields (Bransby, n.d.). There are two main types of switchgrass, upland and lowland. Lowland switchgrass tends to be taller than upland
switchgrass, with lowland switchgrass reaching heights of 12 feet compared to upland's height of five to six feet (Bransby, n.d.).
Because switchgrass is a perennial grass, it is important to maintain switchgrass over the year to guarantee stable supply. It may take three or more years for switchgrass stands to firmly take place on the ground. Once settled, switchgrass stands would stay productive for 10 or more years (Oak Ridge National Laboratory [ORNL], 2008). To ensure the productivity, ample
nitrogen and water should be supplied to the soil. Phosphate and potassium are also recommended to maintain nutrient-balanced soil (Samson, 2007).
Currently the market for switchgrass as an energy crop is extremely small. In fact, the United States Department of Agriculture's National Agriculture Statistics Service does not have data on the crop since its current market is so small.
2.1.4.2 Location of Crop and Yield
Switchgrass is an attractive feedstock because it can be grown in a great variety of soil and climate conditions. Yields in the Southeast of the United States appear to be the highest domestically, followed by the "Corn Belt" region, and the lowest yield is in the Northern Plains
(Rinehart, 2006). Rinehart also mentions that switchgrass depletes the ground of a large amount of nitrogen so the farmer must take active measures to put additional nitrogen into the
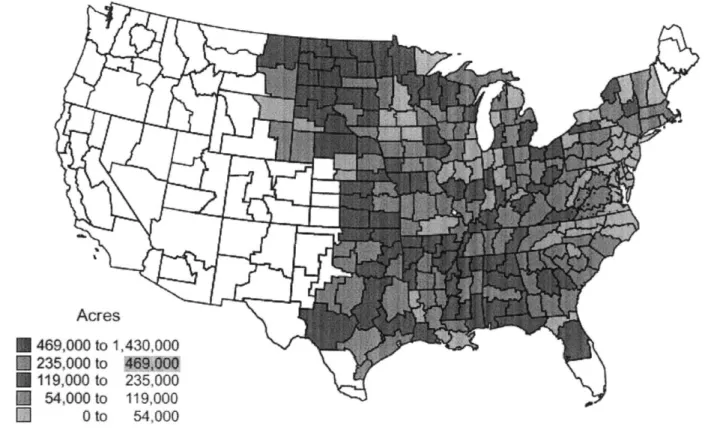
agroecosystem to maintain productivity. Figure 9 was shows where sites for switchgrass farms are feasible (De La Torre Ugarte, Walsh, Shapouri, & Slinsky, 2003). There is little land available on the Pacific Coast or in the Rocky Mountains. However, the North Central region appears to have land which may be available if switchgrass production is scaled up.
Acres * 469,000 to 1,430,000 E 235,000 to 469,00 * 119,000 to 235.000 54,000 to 119,000 0 to 54,000
Figure 9. Land Available for Switchgrass. (source: http://www.usda.gov/oce/reports/energy/AER816Bi.pdf)
As stated above, the yield of the crop varies by location. For example, the Southeast can have a yield between 7-16 tons of crop per acre, and the "Corn Belt" can produce 5-6 tons per
acre, and lastly, 1-4 tons per acre in North Dakota (Comis, 2006). The Oak Ridge National Laboratory estimates that one ton of switchgrass feedstock may be converted to 100 gallons of ethanol (Oak Ridge National Laboratory, n.d.). This would lead to a range of 100 gallons per acre at a low producing farm in North Dakota to a high end of 1,600 gallons of ethanol per acre at a high producing farm in the Southeast. This high end equates to a gasoline gallon energy equivalent of 1,066.7 gallons of gasoline per acre. Tradeoffs exist since high yield cropland is typically more expensive to purchase. The reverse can also be true as well: land which is cheap to purchase may not have high enough yields to be competitive and sustain economically viable switchgrass production.
2.1.4.3 Cellulosic Ethanol Production
Currently there are few cellulosic ethanol manufacturers. However, since the technology shows great promise, there is a great deal of research rapidly advancing the state of the art. Two conversion processes are being considered for cellulosic ethanol conversion, biochemical
conversion and thermochemical conversion.
The U.S. Department of Energy's Alternative Fuels and Advanced Vehicles Data notes there are two key steps for biochemical conversion: biomass pretreatment and cellulose
hydrolysis (2009b). During pretreatment, the hellicellulose component of the biomass is broken down into simple sugars and these are then removed to be fermented. Then in cellulose
hydrolysis, the remaining cellulose component of the biomass is reduced to the simple sugar glucose (USDOE, 2009b). Finally, the sugar is fermented to create ethanol. Figure 10 below gives a graphical description of the biochemical conversion process. The cost of the cellulosic ethanol process is estimated at $2.20 per gallon with the enzymes costing $0.30-0.50 per gallon, compared with $0.03 per gallon for corn (Weeks, 2008). The cost of enzymes must come down significantly in order for cellulosic ethanol to be competitive. There are currently no large cellulosic ethanol producing refineries.
Bioethanol Production
Figure 10. Bioethanol Production Process. (http://wwwl.eere.energy.gov/biomass/abcs_biofues.html#prod)
The Alternative Fuels and Advanced Vehicles Data Center also gives a description for a thermochemical conversion, which is different than the biochemical conversion (USDOE,
2009b). For a thermochemical conversion from switchgrass to ethanol, first chemicals are added
to the biomass and then heat is applied to create syngas (carbon monoxide and hydrogen) which then is reassembled into ethanol (USDOE 2009b). Figure 11 shows the thermochemical process for changing a biomass such as switchgrass into ethanol.
Schematic of a
Thermochemical
Cellulosic
Ethanol Production Process
Indirect Gasifier Flue Gas :i 771'1 Dryer Mixed Biomass ____ Separations Air Methano Recycle
Higher Alcohol + Water
(optional) + Ethanol
Figure 11. Thermochemical Cellulosic Ethanol Production Process. (source: http://www.afdc.energy.gov/afdc/ethanol/production-cellulosic.html)
2.1.5 Ethanol Conclusions
As has been shown, there are different facilities and methods required for producing ethanol depending on which feedstock is used. There are tradeoffs involved with using corn or switchgrass as the dominant feedstock. Currently corn being used as a feedstock is the most economical and prevalent, but it displaces land that would otherwise be used to produce food. Switchgrass is more expensive to refine, but it can be grown on marginal lands that likely would not be farmed. This translates into cheaper land investment for a dedicated switchgrass farm.
Below yields for different feedstocks are given in Figure 12. Data for Figure 12 is extracted from the book Plan B 2.0: Rescuing a Planet Under Stress and a Civilization in Trouble by Lester Brown in 2006 except the yield for switchgrass. The yield for switchgrass is calculated based on data in the research of Sokhansanj et al. in 2009 by using conversion rate of 0.38 liter
kg1, which found in Schmer et al. (2007). As shown in the Figure 12, the yield of ethanol from
switchgrass is higher than that from corn on a per acre basis, because switchgrass grows quite
tall and dense in a field. Switchgrass has number of other benefits. First of all, because of its perenniality, switchgrass requires less tillage, there is also less soil erosion, and it needs less fertilizer than most field crops (Bransby, n.d.). Second, switchgrass grows well at almost any soil type in the United States. When Dave Bransby, a forage scientist at Auburn University, planted
switchgrass on land which was futile after cultivation of king cotton for two centuries, switchgrass prospered (Oak Ridge National Laboratory, n.d.). Third, we can add value to the crop which does not relate to ethanol conversion. As mentioned above, one such example is Metabolix Inc. who look to improve the profitability of ethanol extraction from switchgrass by collecting bio-degradable plastic out of switchgrass as a byproduct.
Ethanol Yield (L/ha)
8000 7000 6000 4 5000 -4000 2000 1000 0
Sugarbeet Sugarcane Switchgrass Cassava Sweet Corn Wheat sorghum
Figure 12. Yield of ethanol from each feedstock.
As the figure shows, there are feedstocks that produce higher yields than switchgrass and corn, but they are not economically viable due to the limited locations they can be grown.
2.2 Feedstock for Biodiesel
There are several different types of organic material that can be used to produce biodiesel. Biodiesel is produced through a process which combines oils with an alcohol and a catalyst to form ethyl or methyl ester (Wright, Boundy, Bader, Perlack, & Davis, 2009). This section gives background information about potential feedstock which can be turned into biodiesel, and it ends with two oilseed crops with great potential to be brought up to scale for the production of
biodiesel: soybean and canola. In this section, yields will be given in terms of gallons of biodiesel produced, and then a gasoline gallon equivalent number is given as well since one gallon of biodiesel is not energetically equivalent to a gallon of petroleum derived gasoline. Energy content of fuels is typically given based on British Thermal Units (BTU) and it takes roughly .88 gallons of biodiesel to produce the same energy content as a single gallon of gasoline.
2.2.1 Virgin Feedstock
As noted in the feedstock for ethanol section above, there are two types of feedstock: virgin and recycled. Three types of virgin feedstock are examined for biodiesel: vegetable oils, animal fats, and algae.
2.2.1.1 Vegetable oils - Soybean, Canola, and Sunflower
A soybean is an oilseed that can be crushed to produce an oil which also can be a
feedstock for biodiesel. There are two major products that come out of the bean crushing process, meal and oil. First, the oil is extracted from the soybean. According to the United States
Department of Agriculture, eighteen to nineteen percent of a soybean's weight is oil, and this is extracted by a process known as "crushing" (USDA, 2008a). Soybean meal is what is left after
the bean has been crushed. The oil can be used as cooking oil, in food products, or as a feedstock for biodiesel. The meal is typically used as livestock feed since it has an extremely high amount of protein in it. Ninety-eight percent of the soybean meal produced domestically is used as feed for livestock. Also, soybean consists of 90% of the total U.S. oilseed crop (USDA, 2008a).
A feedstock that has been used as a dominant feedstock for biodiesel outside the US,
particularly in Europe, is the oil extracted from canola. Canola is a variety of the crop known as rapeseed. Rapeseed oil is not fit for human consumption, so breeders created canola, which was able to be consumed without side effects. While the current canola footprint in the U.S. is small, it has been growing in the Northern Plains of the US. In the US, it grows in regions with a short, dry season where soybean or corn is not an attractive crop. Canada is a source of over half the world's canola/rapeseed oil export (Cassius, 2009) Canola is an oil seed, similar to soybean, where the seed is crushed and oil is extracted to leave meal. Canola meal is second to soybean meal as the largest protein meal in the world (USDA, 2010a). There is a price premium for canola oil over soybean oil due to increasing demand for canola for food use. The lower cost of
soybean oil causes it to be a more attractive feedstock for biodiesel.
Similar to the other oilseeds, sunflower oil is also a potential feedstock for biodiesel. In the U.S., almost half of the sunflower seed produced is used for birdseed, snacks, and baking. The rest is crusted into oil and meal. The primary growing region for the sunflower crop in the
U.S. is the upper Midwest. Sunflower oil has the same problem as canola. Its oil is in high
demand for edible uses, and this causes the price to increase and make it more difficult to be a viable feedstock for biodiesel unless diesel prices are extremely high (USDA, 2009d).
2.2.1.2 Animal fats
Animal fats have similar fatty acids as vegetable oils, so they are also a candidate feedstock to produce biodiesel. Large poultry, pork, and beef providers have started to use animal fat waste to produce biodiesel. In 2007, Tyson Foods partnered with large oil company ConocoPhillips and synthetic fuel producer, Syntroleum, to produce biodiesel. One third of all the animal fat in the U.S. is produced by Tyson Foods, so the company has access to a large amount of raw material (Anderson, 2007). Relationships like these are highly reliant on high fuel prices and government subsidies. This program was cancelled when the government subsidy was altered, making the program less profitable for Tyson Foods.
2.2.1.3 Algae oils
Alga is a photosynthetic organism that lives primarily in water. Oils from algae are another potential feedstock for biodiesel. Two types of algae that can be used to produce the requisite oils are macroalgae and microalgae. Macroalgae can be seen with the naked eye. Conversely, microalgae cannot be seen without the help of a microscope. Microalgae have the potential to produce 250 times the amount of oil as soybeans per acre (Hossain, Salleh, Boyce, Chowdhury, & Naquiddin, 2008). The high yield potential of microalgae makes it an attractive feedstock when being brought up to scale. Currently, alga has not been brought to scale because of the high cost of capital to produce reactors at such a large scale. Also, research on how to produce high yields at a large scale is not in a mature stage making large scale production competitive.
2.2.2 Recycled waste vegetable oils
Waste products from other processes which leave oil as twaste provide the opportunity to recycle the oils into biodiesel. Restaurants are the logical source of waste vegetable oils. The amount of waste vegetable oil produced in the U.S. was estimated at 2.9 billion gallons
(Environmental Protection Agency [EPA], 2009). This would be capable of offsetting almost 1% of the U.S. oil consumption. A major advantage of recycling vegetable oils is the price. Often times, waste oil can be procured very cheaply or even free from restaurants. However, collection of waste oils is labor intensive and requires a great deal of coordination with restaurants to pick up the waste oil. So while the feedstock may be cheap, costs add up in transporting the feedstock to a refinery. If there were trucks making runs to each restaurant for another purpose, there may be the opportunity to pick up waste vegetable oils and fill space that otherwise would be empty on a truck.
2.2.3 Soybean
Figure 13. Soybean. (source: http://en.wikipedia.ore/wiki/File:Sovbean.USDA.ioa) 33
This section goes into greater detail about the current state of soybean farming in the United States. We discuss how soybeans are typically grown in the same areas corn is around the Midwest, and we give an average yield in terms of gallons of biodiesel produced per acre of harvested soybeans. Lastly, we discuss how the oil is extracted from soybeans and then refined into biodiesel for use as a liquid fuel.
2.2.3.1 Current Production
Soybean is a crop which is increasingly in demand both domestically in the U.S. and abroad since it can be used as both food and a feedstock for biodiesel. In 2009, it is estimated that 1,904 million pounds of soybeans out of 18,753 million pounds of newly grown soybeans will be used for biodiesel production (USDA, 2010b). This equates to around 10% of the total soybean grown in the U.S. being used as a feedstock for biodiesel or 300 million bushels. This number is set to grow to 2,600 million pounds by 2013 (USDA, 2010b).
2.2.3.2 Location of Crop and Yield
Similar to corn, soybeans are primarily planted in the Midwest in the "corn belt." The major soybean producing states are Illinois, Indiana, Iowa, Minnesota, Missouri, Nebraska, and Ohio. Also, there are some counties in southeastern North Dakota with very high plantings. Figure 14 below shows the planted acreage by county.
25AX00- 24,
-0CO 149,909 I MOW00 *
U N -nl 8 OAIK1J '&tS.*St,
Soybeans 2008 Planted Acres by County
7-,
USDA
Figure 14. Soybeans 2008 Planted Acres by County.(source: http://www.nass.usda.gov/ChartsandMaps/CropsCounty/sb-pI.asp)
The Food and Agricultural Policy Research Institute (FAPRI) at the University of Missouri has put forth various yield predictions for the soybean crops in future years. In 2010, estimates show a yield of 44.0 bushels per acre of Soybeans. (FAPRI, 2010) After being crushed,
11.4 pounds of soybean oil will be extracted per bushel of soybeans, from which it takes 7.7 pounds of crude soybean oil to be turned into a gallon of biodiesel (FAPRI, 2007). Using these numbers as the basis for calculations, on average an acre of soybeans will yield 501.6 pounds of crude soybean oil, which can be used to create 65.1 gallons of biodiesel. This equates to a gasoline gallon energy equivalent of 66.4 gallons of gasoline.
2.2.3.3 Biodiesel Production from Soybean Oil
The first step once the soybean crop has been harvested is to extract the oil from the soybean. This is done through a process known as crushing. The soybeans are processed in a way that extracts the soybean oil and leaves a high protein meal which is then typically used as a high protein additive to animal feeds.
Biodiesel is created from the soybean oil that was extracted. Biodiesel is made up of chemical compounds called fatty acid methyl esters. The United States Department of Energy's Alternative Fuels and Advanced Vehicles Data Center explains the production of these esters (20 1Ob). First the oils and fats go through a preprocessing step which removes water and
contaminants. After pretreatment, the fats and oils are mixed with an alcohol, typically methanol, and a catalyst, typically sodium hydroxide. This process creates the chemical compounds methyl ester and glycerin of which the esters are used as biodiesel (USDOE, 2009a). Below in Figure
15, the process if further broken down in greater detail.
Recycled Sulfuric Acid Greases + Methanol
Vegetable Dilute Acid
Oils Esterification
Methanol + KOH -*- Transesterification
Methanol Crude Glycerin Crude Biodiesel Recovery
Glycerin Refiningj Refining
Glycerin Biodiesel
Figure 15. Schematic of Biodiesel Production Path.
(source: http://www.afdc.energy.gov/afdc/fuels/biodiesel production.html) 36
2.2.4 Canola
Figure 16. Canola. (source: http://en.wikipedia.org/wiki/File:Koeh-169.jpg)
In this section we go into greater detail about the current state of canola farming in the United States. We discuss how there is currently a shortage of domestic canola and the U.S. is reliant on importing canola oil. In the U.S., North Dakota supplies most of the domestic canola oil, and Canada has found success growing canola all along their southern border with the U.S. Lastly, we discuss how the process for converting canola oil into biodiesel is similar to how soybean oil is converted.
2.2.4.1 Current Production
The United States relies on importing canola to meet its demand. Figure 17 below shows the gap between what the U.S. is producing to domestic consumption. The difference between the two bar graphs is the amount of canola that must be imported to meet demand.
Milion pounds
3,500 - .
% Productmn OomesCe ceup~en
2,800 2.100 1,400-70D0 0--1987-88 1990-91 1993-94 1996-97 1999-00 200203 2005406 2008-09 0e0
Source. USDA, Economic Research Service using data from, Oil Crops 000
Yearbook. 000
ERS
Figure 17. U.S. Canola Oil Production and Demand 1987-2009. (source: http://www.ers.usda.gov/Briefing/SoybeansOilcrops/Canola.htm)
Canola oil commands a higher price in the U.S. than soybean oil, so the amount of biodiesel created from soybean oil dwarfs the amount created from canola oil. The price difference is because canola oil demand has risen thanks to the food industry at a rate greater than soybean oil demand. In 2006, the amount of biodiesel created from soybean oil was ten times the amount created from canola oil (FAPRI, 2007). Also, in the U.S. cars run primarily on gasoline explaining why ethanol is the primary domestic biofuel. However, in Europe the majority of cars run on diesel fuel. Due to this, Europeans create more biodiesel than in the U.S.
2.2.4.2 Location of Crop and Yield
As Figure 19 below shows, in the United States, canola is primarily grown in North Dakota with some plantings in Montana as well. As previously stated, the United States relies on importing canola oil to meet its needs. Canada remains the largest importer of canola to the U.S. Figure 18 shows the Canadian provinces of Alberta, Saskatchewan, and Manitoba have a high percentage of canola crops in their southern regions. As the map shows, canola is primarily grown in areas with short growing seasons and dry weather.
Map I Area of canola as a percentage of area in crops in Canada, 2006
B
F 8 o as a p a r s n , 20hsa
0. - 74
~ ii)
Figure 19. Canola Planted Acres by County for Selected States in 2008. (source: http://www.nass.usda.gov/ChartsandMaps/CropsCounty/cn-pI.asp)
The FAPRI has also estimated yields in 2012, which is 1557 pounds per acre (2006). Canola oil can be extracted at 0.383 pounds per pound of canola. Using an estimate of 7.7 pounds of oil per gallon of biodiesel gives an estimate of 77 gallons of biodiesel per acre of harvested canola (FAPRI, 2006). This equates to a gasoline gallon energy equivalent of 78.6 gallons.
2.2.4.3 Biodiesel Production from Canola Oil
Canola is crushed and the oil is extracted in a process similar to how oil is extracted from soybeans leaving canola oil and canola meal. The meal has uses outside of the biodiesel industry. Once the canola oil has been extracted, the transesterification process for this oil is very similar
Canola 200M Planted Acres by County
for Selected States
Aces 10uD- 24J,9 -o o - e 25 0 WUy 90.M~~i
USDA
to the process for converting soybean oil to biodiesel which is discussed in the soybean crop section.
2.2.5 Biodiesel Conclusions
Similar to ethanol, there are many different feedstocks which can be used to produce
biodiesel. Palm oil and coconut are very high yield, but they need a very unique environment in which to grow and are rarely grown in the U.S. Figure 20 shows that Rapeseed, of which canola is derived, has much higher biodiesel yield per hectare compared with soybean. Rapeseed is the main source of biodiesel feedstock in Europe, especially in Germany. However, it has not been widely accepted in the U.S., because farmers have little experience of growing canola. This is changing and farmers in Canada have been growing canola on a large scale. Canada was recorded as the top producer of rapeseed in 2008 while producing 12.6 million metric ton (Boland, 2010). Canada can be a stable source of rapeseed once companies in U.S. decided to produce biodiesel from rapeseed. Plantings in the U.S. are also increasing in North Dakota, as Figure 19 shows.
Biodiesel Yield (L/ha)
5000 4500 4- --- -4000 -3500 - -3000-2500
--Fiur02.0ied+fioiee fro each
feed-to--1500
--1000 500 0
Oil palm Coconut Rapeseed Groundnut Sunflower Soybean
Figure 20. Yield of biodiesel from each feedstock.
2.3
Feedstock Conclusions
As this section has shown, the number of feedstock options is large and type of feedstock is diverse for the biofuels ethanol and biodiesel. The incumbent feedstocks for ethanol and biodiesel, corn and soybean, are dominant because they also have value as food crops. Getting farmers to produce crops with higher yields for conversion to biofuels can be difficult. Producing a food crop which doubles as a biofuel feedstock, such as corn or soybean, reduces risk for the farmer since they have a higher ability to sell the crop in case the biofuel market drops out.
Compare this to producing a crop such as switchgrass which outside of growing switchgrass for conversion to ethanol, it has little value as a field crop. These types of tradeoffs which currently exist in the biofuel production industry are common in industries which are relatively new or experiencing rapid growth.
Biofuel Supply Chain Overview
The supply chain for biofuel is described graphically in Figure 21 and is composed of five major stages: feedstock production, feedstock logistics, biofuel production, biofuel
distribution, and biofuel enduse (Hilliard & Middleton, n.d.). The feedstock production stage includes issues including land availability, seeding, growing, yield, and the environmental impact of growing the feedstock. Beyond production, there is concern with using feedstocks that can also be used for food such as corn versus a non-edible feedstock such as switchgrass.
However, the causality between the increasing use of feedstock and the rising world food price is not easily proven. The feedstock logistics stage includes all the issues related to moving
feedstock from cropland to refineries. This stage is composed of four smaller steps, which are harvesting, storing, preprocessing, and transportation (Biomass Research and Development
Board, 2008). The biofuel production stage is where the feedstock is converted into the biofuel. Improvements at this stage include increasing the yield of conversion for the biofuel from feedstock, developing byproducts that can be sold in addition to the fuel, optimizing conversion processes, and identifying best practices in related industries to use as benchmarks. Once achieved successfully, these improvements will make biofuel price competitive to that of gasoline. Issues in the biofuel distribution stage primarily occur because of geographical dislocation between the supply, which is mostly in the Midwest, and the demand, which are where population centers are on the West and East Coasts. One major issue is insufficient delivery capacity (Biomass Research and Development Board, 2008). The current biofuel distribution infrastructure, which includes storage and blending stations, rail cars and trucks, as well as the manpower for driving vehicles, are not sufficient to meet growing demand to deliver
biofuel. At the same time, some valves, seals, and gaskets in storage and blending stations are required to be replaced if a higher blend of biofuel may corrode them (Biomass Research and Development Board, 2008). The biofuel enduse stage focuses on how the consumers access the biofuel. Two significant levers in driving demand are cost efficiency and sustainability. Cost efficiency is the biggest issue, since the current biofuel costs more than its fossil fuel counterpart even with government subsidies. The sustainability of biofuel is being challenged by a
significant amount of research. U.S. government and researchers who support biofuels need to further research and improve the sustainability of biofuel in terms of carbon footprint and net energy balance. Research must be performed to make sure higher biofuel blends do not damage existing vehicle engine parts at the end use stage of the supply chain.
Supply oE
Figure 21. Five Stages of Biofuel Supply Chain. (source: Hilliard & Middleton, n.d.)
3.1
Feedstock Production
This stage consists of issues related to the feedstock itself and its production, such as research and development of feedstock, location of feedstock, seeding and fertilizing, and the costs of each step. Among these issues, research and development of feedstock and growing feedstock to increase the feedstock yield are agricultural or biochemical research issues and out of scope of this paper, therefore we will not delve into these issues. However, we state reasonable
3.1.1 Feedstock Production Supply Chain Decisions
Many decisions exist for parties interested in producing feedstock for use in biofuels. The first decision is which feedstock to grow. For a crop such as switchgrass, there would be more financial risk than growing corn. In addition, issues such as where and how to grow that feedstock, along with how to improve yield and reduce cost, are all important decisions.
3.1.2 Feedstock Production Challenges
There are a number of challenges involved in feedstock production. One major challenge for the industry is to minimize the price increase of food crops due to scarcity because the crop is being used for biofuel instead of food. Research conducted by the National Corn Growers Association argues that recent price increases of corn are not because of ethanol production, but due to rising oil prices (National Corn Growers Association, 2008). However, based on the basic supply and demand relationships, crop prices rise if the increase of crop consumption for biofuel production outpaces the increase of crop production. This can lead to increasing prices and food supply issues, especially in developing countries. Therefore, adequate forecasting of biofuel feedstock needs and crop production is necessary to identify and restrain possible food price increases. Using of 2"d and 3rd generation feedstock, which are non-food feedstock, can be an
alternative to reduce the consumption of crops for biofuel production. Finding cropland and cost-efficient farming techniques for 2nd and 3rd generation feedstock are challenges that will always
persist. On top of these efforts, farmers growing a crop they are not familiar with is another significant challenge.
Improving sustainability is also another challenge and many sustainable initiatives can actually reduce cost at the same time. For example, using water more efficiently will reduce the amount of water required for the crop. Developing an eco-friendly way to protect crops from insects or diseases would reduce use of chemicals, and it can also possibly lead to a cost reduction.
Improving the yield of a feedstock is another major challenge, because this is directly related to unit cost of feedstock.
An assessment of the environmental impact of feedstock cultivation of each feedstock is another challenge to be addressed. Environmental implications such as effect of feedstock cultivation on the quality of soil, water, and air should be analyzed because environmental concerns are the main reasons why biofuel is produced in the first place. Improving the net energy balance, which is relationship of maximizing energy output and minimizing the amount of energy input, and net carbon reduction of growing feedstock is also a critical issue.
3.2
Feedstock Logistics
The feedstock logistics stage contains all steps required in delivering feedstock from the field to the conversion facility. In the case of cellulosic ethanol, this logistics cost is one of the major cost drivers and constitutes as much as 20% to the finished product cost. This stage is composed of four main elements (Biomass Research and Development Board, 2008):
b. Storage -providing steady supply of feedstock without spoilage (activities include: where to locate storage facilities, what preparation steps are required of the feedstock before placed into storage, and other inventory issues)
c. Preprocessing and grinding -transforming feedstock to a more energy-dense form for efficient transportation, and preprocessing feedstock to facilitate the conversion process
d. Delivery & transportation -moving feedstock from the farm or forests to the refinery in a cost-efficient manner
The cost incurred in this stage is one of the major cost drivers. Despite the significance of logistics in the whole biofuel supply chain, this area has received minimal governmental attention.
Two goals of feedstock logistics are to ensure stable supply of quality feedstock over time and transport feedstock in a cost efficient manner. However, these two goals are not easy to achieve because of the nature of feedstock and its production. First of all, feedstock is normally harvested during a specific season, once a year, and the feedstock needs to be stored and
preserved to provide steady supply throughout the course of the year, increasing storage and holding costs. Moreover, year-to-year production naturally varies, and other agricultural
irregularities, such as crop rotation, make producing a predictable amount of supply difficult.
Solutions to these logistics issues can be divided into two categories; the industry can either improve the efficiency of existing logistics system or develop new technologies. To operate the existing logistics system more efficiently, the design of feedstock collection, storage, preprocessing, and delivery systems should be optimized based on the feedstock type,