Pollinating animals in the urban environment
Ernest Ireneusz Hennig&Jaboury Ghazoul
Published online: 12 August 2011
# Springer Science+Business Media, LLC 2011
Abstract Urban environments contain habitats for flowering plants and their pollinating animal species. It is, however, unclear how the urban matrix influences plant-pollinator processes. We recorded plant diversity, floral abundance, flower visitor diversity and plot visits at 89 plant patches within the city of Zürich. The urban matrix surrounding each site was analyzed for the landscape metrics edge density and the extent of green area up to 200 m radius. The correlation between edge density and bee diversity and visitation frequency varied over the entire spatial range, while the correlation for syrphid diversity and visitation frequency levelled off at 80 m radius. In contrast, the correlations with green area were more consistent, with bee diversity levelling off after 100 m, while syrphid diversity and visits continued to increase. The variation in the correlation of bee visits was partly accounted for by the large contribution of honeybees. Plant diversity significantly affected bee diversity and visits, and syrphid visits. Floral abundance had a positive effect on bee visits and bee diversity. Syrphid diversity had a negative interaction with floral abundance and green area. The extent of green area increased bee diversity and visits, and syrphid visits, while edge density reduced visitation by bees. This study showed that plant diversity and floral abundance in urban environments promote pollinating flower visitors. The extent of green area and edge density are important urban mosaic attributes that affect pollinator abundance and visitation frequency at multiple scales.
Keywords Urban matrix . Spatial scale . Bees . Syrphids . Diversity . Visitation frequency
Electronic supplementary material The online version of this article (doi:10.1007/s11252-011-0202-7) contains supplementary material, which is available to authorized users.
E. I. Hennig (*)
:
J. GhazoulETH Zürich, Institute of Terrestrial Ecosystems, Ecosystem Management, Universitätstrasse 16, 8092 Zürich, Switzerland
e-mail: [email protected] J. Ghazoul
Introduction
Human population continues to increase, particularly in urban areas which now contain more than half the world’s population (Cohen2003; Crane and Kinzig2005; Grimm et al. 2008). For Europe, despite decreasing population overall, approximately 80% of the population will be expected to live in cities in the next 20 years (United Nations2008). As population density in cities increases, and as cities themselves continue to grow, there are likely to be impacts on the semi-natural elements of urban environments through habitat degradation or loss. This has social implications in that exposure to nature for most of the world’s population (i.e., those living in urban areas) may be increasingly restricted (Crane and Kinzig2005). Given such concerns, we should be aware of the potential for urban areas to provide opportunities for human interactions with nature. Indeed, urban areas do have potential to support surprising amounts of biodiversity (Niemelä1999; Rebele1994), but this potential can be enhanced by the structure and composition of urban areas, in other words the urban habitat matrix.
Habitat heterogeneity, which has been demonstrated to support species diversity (Di Gulio and Nobis2008), can be high in urban environments which may include a variety of forms of suitable habitats for plants and insects. For example, green roofs provide new space for plant and animal species (Brenneisen2006; Kadas2006; Oberndorfer et al.2007) while derelict’brown-field’ sites such as inoperative railways, and green areas such as parks and gardens, harbour many animal species (McFrederick and LeBuhn2006; Saure1996). Building complexes may even change the abiotic conditions locally, which affect animal species abundances, diversity and distribution (Godefroid and Koedam2007).
Sustainable ecosystems need not only species, but also effectively functioning ecological processes. Pollination is a supporting ecosystem service for both wild plants and many planted crops. Within the urban environment the maintenance of viable populations of flowering plants may therefore depend on insect pollinators that the urban environment supports. Recently there has been growing concern about many pollinator groups, which are thought to be declining in intensively managed and transformed landscapes (Biesmeijer et al.2006; Vamosi et al.2006). A decline in pollinator abundance and diversity may result in pollen limitation and reduced reproductive success in plants. At the same time, low plant diversity may sustain fewer pollinator species.
Urban environments can provide a range of resources for pollinating animals, including nesting sites and nutritional resources (Cane et al. 2006; Hopwood 2008; Saure 1996), within, for example, gardens (McFrederick and LeBuhn2006; Osborne et al.2008b) and along roadsides (Hopwood2008). In addition to the extent of suitable habitats to support pollinators, the foraging ability of insects and hence their potential role as pollinator service providers, depends on the connectivity among suitable habitats in the urban environment (Donaldson et al. 2002; Gilbert et al.1998; Tewksbury et al.2002; Townsend and Levey 2005). Roads and railroads, for example, have been shown to reduce the movement of pollinating animals (Bhattacharya et al.2003). The urban matrix can therefore play a major role in determining pollinator movement, diversity, and density.
Among Hymenoptera and Diptera the bees (Apoidea) and syrphid flies (Syrphidae) are among the most important pollinators of many flowering plant species (Buchmann and Nabhan1996; Kevan and Baker1983; Ssymank et al.2008). While in this respect bees and syrphids perform similar ecological functions, they also differ in many traits. Endothermy among many, and perhaps most, bees and wasps extends the lower temperature limit of foraging making bees more effective pollinators over more time (daily and seasonally) than most syrphids, few of which have endothermic capabilities (Ghazoul and Willmer 1994;
Heinrich1975; Morgan and Heinrich1987; Willmer and Stone2004). It also allows bees to achieve longer foraging distances, particularly in inclement weather, and therefore reach more isolated flower patches. Furthermore, the social structure of bees and the requirement for pollen by larvae ensures that there is high demand for pollen by bees, which explains higher foraging activity by bees on flowers than other insects. To analyze how these two pollinator groups, and pollination processes, respond to the urban environment we investigated pollinator diversity and floral visitation with respect to the area of green space, density of habitat edges, and habitat diversity at different scales on bee and syrphid fly diversity and their patch visit frequency at 89 locations within an urban matrix.
Green areas constitute any patch of vegetation within the urban matrix. This may include relatively large areas such as parks, which themselves might consist of several habitat types, or smaller patches such as urban gardens, vegetated strips along roads, vegetated derelict plots, or even green roofs. These green areas often provide breeding, nesting, and foraging sites for bees and syrphids (e.g., McFrederick and LeBuhn2006; Saure1996; Stuke1998). Small green areas might be used as “stepping stones” on foraging bouts between larger areas (Dearborn and Kark2010; Dover and Settele2009).
Edges are the boundaries between urban land use types, and their quantification is thus subject to the number of land uses recognised and mapped. Linear features and habitat edges in farmland serve as foraging routes for bees and syrphids (Van Geert et al.2010) and few bee species such as bumblebees choose edges for nest sites (Osborne et al. 2008b). There is also evidence that linear features and habitat edges in rural and suburban landscapes might act as a barrier to the movement of bees and syrphids (Bhattacharya et al. 2003; Wratten et al.2003). Given this uncertainty, we explore how density of habitat edges at different scales affects the abundance and diversity of the urban pollinator community.
Materials and methods
Study site
The city of Zürich has 380,499 inhabitants (2008) and is the largest city of Switzerland, located in its north-eastern part. Population growth in the city from 1998 to 2008 was 8.2% (Statistisches Amt Zürich2008), and is expected to increase as the entire Swiss population is projected to grow by up to 20% in the next 50 years (Giannakouris2008). Zürich covers an area of 8,774 ha, of which about 60% is paved (buildings, streets), and 37.5% consists of forests, parks and agricultural land (Statistisches Amt Zürich2008). Few study sites (27 out of 89) were located within the Zürich urban centre, while the rest were located towards the edge of the centre where there are more extensive green areas (Fig.1).
Data collection
Plant diversity and pollinator visits
Green areas within the city such as parks, green strips along roads, and gardens, were randomly chosen for observations on plants and pollinators between 26th May and 10th September 2008. At each of the 89 sites observations on flower visitors and plant species were conducted once within 2×2 m plots. Most (40.4%) flowering plant patches within which these plots were located were relatively small (up to 1,500 m2) with only few plots located in the midst of a wider expanse of flowering plants. The flowering plant community
within each plot was not obviously different in composition to the surrounding patch, though this was not quantitatively assessed. The number and identity of each flowering plant species, and flower visitation frequency and identity of each pollinator visiting the site were recorded. Records were made only for flower visitors landing on flowers and actively searching for rewards. We counted every insect entering the plot as a new individual. While this may overestimate the actual number of individuals visiting the plot, we assume that the consistent application of this rule across all plots allowed unbiased comparison across plots. Observations of pollinator visits lasted 40 min between 0900 and 1700 on sunny days. The observer spent 10 min at the corner of each plot before moving to the next corner so as to avoid bias due to shading. Familiarization with the identity of flower visiting insects in this region was obtained through extensive field observations and collection as part of earlier studies. Even so, some insects remained difficult to identify to species (including, for example, some Lasioglossum and Bombus bees). Where possible these were caught for later identification. We were able to identify 71% visitors to species, and 92.6% to genus. Specimens were determined using relevant keys (Amiet1996; van Veen2004; Oosterbroek2006).
Plant species at each plot were identified (following Bässler et al. 1996) and the number of flowers of all plants were counted after each observation period. Densely clustered floral heads of Asteraceae, Apiaceae and some flowers of Fabaceae (e.g., Trifolium spp.) were considered as single flowers. Sites that contained only a single flowering plant species were selected at locations, where there were no other heterospecifics at least within 20 m of the plot, so as to avoid site misinterpretation. Similarly, and so far as casual visual assessment allowed, the 2 ×2 m plots were positioned to reflect the surrounding flowering community mix.
Fig. 1 The ArcGIS-map shows the city of Zürich and the different landscape elements forest, green area, paved area, building and water. Red dots represent the 89 study locations
Landscape metrics
Two landscape metrics, the extent of green area and edge density were used to quantify spatial structure around each of the 89 patches within the urban environment of Zürich using ArcGIS 9.2 (Environmental Systems Research Institute (ESRI) Inc.2006). This was done at a variety of spatial scales, as described below. Green area included meadows, grassland, gardens, and parks (but not forests), and was calculated as the proportion of green area (m2) to the total area (m2). Edge density (m ha−1) was defined as the edge length of green areas divided by its total area. We do not distinguish between the types of land use adjacent to green area patches. For each site, values for the two landscape metrics were calculated for multiple scales from 20 to 100 m radius (i.e., 1,260 to 31,500 m2) in 10-meter-steps, and from 100 to 200 m (i.e., 125,500 m2) in 25-meter-steps. We used a maximum 200 m radius scale from each observational plot, because successful pollen transfer among insect-pollinated plant species has been previously shown to be less than 200 m (mean 130 m) in urban habitats (Van Rossum and Triest 2010). While it is well known that several bees, particularly honeybees and bumblebees, can cover far greater distances within single foraging bouts, it seems far less probable that pollen is successfully transferred between conspecific plants over such distances, particularly in urban matrices, although beyond the abovementioned study there is little direct evidence to support this contention. Nevertheless, other reasons for limiting the scale to 200 m radius are that, first, beyond this scale changes in the two landscape metrics were marginal and, second, surveyed areas centered on observation plots began to overlap.
Analysis
Landscape metrics
We performed Spearman‘s rank correlation of the response variables “diversity” of bees and syrphids, “patch visits by bees” and “patch visits by syrphid flies” with the landscape metrics at each distance. The extent of green area as a proportion of the total area was arcsine square root transformed before the analysis. Spearman’s correlation coefficient ϱ of each analysis was plotted against the area analyzed to show the degree of correlation at each scale (i.e., each of the 10–25 m radius increments).
Statistical analysis
We calculated Shannon diversity index for plants and pollinators. Shannon diversity index accounts for the number of species and their abundance. We used flower number to represent plant abundance. Floral abundance was used independently in the analyses, because it describes resource amount. Though some frequent plant species may influence the attractiveness of patches to flower visitors, we considered the effect of particular plant species as part of the error term in the model.
We analyzed the diversity and the ratio visitation frequency/floral density of bees and syrphid flies against the landscape metrics, plant diversity, and floral density using multiple linear regression. Interactions between plant diversity and floral abundance with the landscape metrics were used to account for large and local scale effects. For landscape metrics, we chose only scales with highest correlation values.
As the diversity and the ratio visitation frequency/floral density of syrphids consist of many zero values (54% and 27%, respectively), we performed for these two variables Wilcoxon
(exact) tests on edge density and green area at highest correlation values. For significant differences between the means, multiple linear regressions were applied on non-zero values.
Explanatory variables were investigated for multicollinearity using variance inflation factors. Variance inflation factors larger than five indicate multicollinearity (Sheater2009; Zuur et al. 2009). We removed multicollinearity by centering all explanatory variables around their mean (i.e., substracting each value from the mean). Models were investigated for violation of homodascity and normality. Transformations of explanatory and response variables were applied to achieve assumptions. We tested for spatial independency of residuals using Moran’s I following the procedure described in Dormann et al. (2007).
Stepwise reduction of non-significant explanatory variables using F-test was applied to find the most parsimonous model. For all calculations the statistical program R was used with the packages vegan (Oksanen et al.2009) to calculate bee, syrphid, and plant diversity, the package exactRankTests (Hothorn and Hornik2006) for the Wilcoxon exact tests, the package faraway (Faraway2009) for the investigation of the variance inflation factors, and the packages ncf (Bjornstad2009) and spdep (Bivand et al.2009) to calculate the Moran’s I. Results
Pollinator species
A total of 2,862 visits by 148 insect species were recorded, averaging to 32 visits per patch. Species accumulation curves for species richness of syrphids and bees approached but did not reach an asymptote at 89 sites observations, the same being the case for plants (Fig.2). Thus while we are confident that we have comprehensively“sampled” most members of the pollinator and plant communities within the city of Zürich, new rare, transient or occasional flower visitor species are likely to be found.
Most plot visits were by Hymenoptera (79.5%) and Diptera (17.5%). The most common visits within each of the two groups were made by Apoidea (98%) and Syrphidae (82.2%), respectively. Apoidea were mostly represented by honeybees (Apis mellifera) (48.7%) and bumblebees (28.6%), among which the most frequent observed species was Bombus pascuorum (18.5%) (for full species list see Online Resource1). Among the syrphid flies,
0 20 40 60 80 20 40 60 80 100 120 140 Sites
Accumulated Species Richness
Pollinators Plants Bees Syrphids Fig. 2 Species accumulation
curves for pollinator, plant, bee and syrphid diversity with 95% confidence intervals using the method“random” in the package vegan from the statistical program R
the four most common species were Eristalis cf. tenax (23.4%), Episyrphus balteatus (13.1%), Cheilosia scutellata (12.2%), and Sphaerophoria scripta (11.7%).
Hymenoptera were the most species-rich group (65 spp., 44%), although the number of Diptera species is approximately equal (61 spp., 41.2%). Apoidea (55 spp., 84.6%) and Syrphidae (34 spp., 55.7%) were the most species rich families within each group. For this reason, both families were independently analysed for the effects of plant diversity, floral abundance and landscape metrics.
As honeybees (Apis mellifera L.) accounted for 50.5% of all bee plot visits (1,086 out of 2,150 plot visits) we conducted additionally analyses on bee plot visits excluding honeybees.
Plant species
We recorded 67 plant species from 19 plant families (Online Resource 2). The most species-rich plant families were Asteraceae (17 spp.), Fabaceae (11 spp.), and Lamiaceae (8 spp.). Most flowers were counted for Fabaceae (9,965), Asteraceae (4,180), and Lamiaceae (1,133). On average 5.02 ± 2.3 (mean and standard deviation) plant species and 212.2 ± 221.2 flowers were recorded. Maximum plant species number was 12 plant species and maximum floral abundance was 950 flowers in a single plot. Minimum values were one plant species and 18 flowers. The most frequently recorded plant species was Trifolium pratense L. (Fabaceae) (61 out of 89 plots, Fig.3), which had the largest floral
Plot Frequencies
Tr.pr Tr.re Ga.al Be.pe Pl.la Tr.ca Lo.co Hy.ra Ce.ja Ra.re
0 10 20 30 40 50 60
Fig. 3 The ten most frequent plant species and their plot frequencies in 89 plots: Tr.pr = Trifolium pratense; Tr.re = Trifolium repens; Ga.al = Galium album; Be.pe = Bellis perennis; Pl.la = Plantago lanceolata; Tr.ca = Trifolium campestre; Lo.co = Lotus corniculatus; Hy.ra = Hypochoeris radicata; Ce.ja = Centaurea jacea; Ra.re = Ranunculus repens
abundance (3,164). When considering the number of plots a plant species was observed, Rhinanthus alectophorus (Scop.) Pollich s.l. (Scrophulariaceae) was the species with the largest floral abundance in the study (245.75 flowers/plot).
Landscape metrics
Edge density of green area
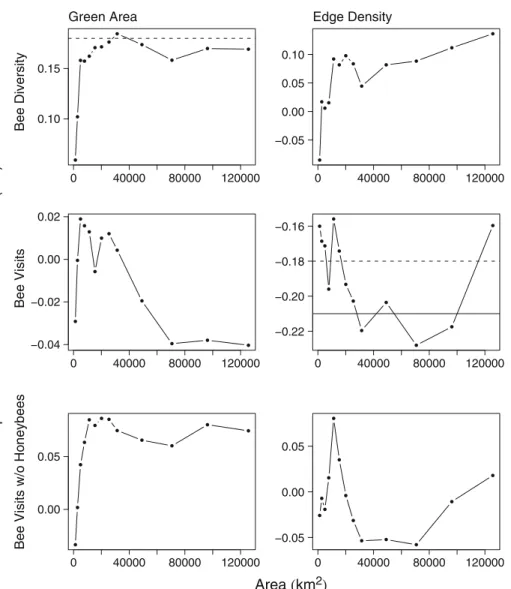
Edge density explained considerably more of the variation in syrphid diversity and syrphid visit frequency (maximum value 10.7% and 9.7%, respectively, at 80 m radius or≈ 20,000 m2) than that of bee diversity (maximum value 1.9% at 200 m or≈125,500 m2), bee visit frequency (maximum value 5.2% at 150 m radius or 70,000 m2), and bee visits excluding honeybees (maximum value 0.64% at 60 m or≈11,500 m2).
Bee diversity was negatively associated with edge density at the lowest scales (≈ 1,250 m2), and positively thereafter, while bee visits were almost negatively correlated and showed considerable variation in correlation. Similarly bee plot visits excluding honeybees showed considerable variation in correlation with edge density (maximum value of 0.64% at 60 m radius), but were more weakly correlated with edge density than plot visits of all bees. Correlation coefficients of bees were negative below 50 m radius (≈ 7,500 m2), and between 80 and 175 m (i.e., ≈ 20,000–95,000 m2), while otherwise positive (Fig. 4). By contrast, edge density positively influenced syrphid diversity and visitation frequency at all scales, reaching an asymptote at 100 m radius (≈ 31,500 m2) for diversity and visitation frequency (Fig.5).
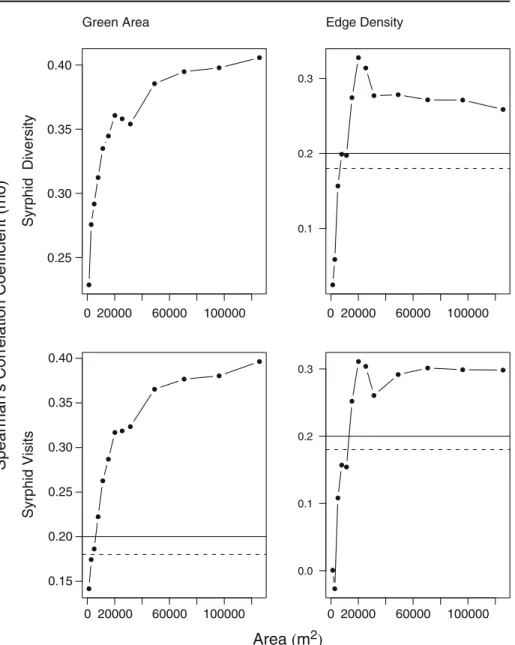
Green area
As with edge density, the extent of green area explains far more of the variation in syrphid diversity (maximum 16.5% at 200 m radius) than for bee diversity (maximum 3.4% at 100 m radius), and similarly for syrphid visit frequency (maximum 15.7% at 200 m radius) than in bee visit frequency (maximum 0.2% at 200 m radius). There was always a positive effect of green area on bee and syrphid diversity, and syrphid visits (Fig. 5). Bee visits were negatively correlated with green area at radii below 30 m (≈ 2,500 m) and above 100 m (≈ 31,500 m2). Excluding honeybee visits correlation was only negative at the lowest scale (20 m radius) and increased thereafter with scale, reaching an asymptote at 60 m radius (≈ 11,000 m2, Fig.4). Almost all curves followed an asymptotic form with the exception of bee visits, which showed considerable variation at scales below 100 m radius. For bee diversity there was a levelling off at 100 m radius scale (≈ 31,500 m2), while this occurs more gradually and at larger spatial scales for syrphid flies (Fig.5).
Bees and syrphid flies
Bees
Bee diversity increased significantly with plant diversity (t =4.3, p < 0.001) and green area size (t = 2.46, p = 0.02). We found bee abundance to increase also significantly with plant diversity (t = 3.94, p < 0.001), green area size (t =− 2.19, p=0.03) and floral abundance (t = 4.02, p < 0.001), while edge density affected negatively bee visits (t =−
2.3, p = 0.02). Moran’s I values for the model residuals of bee diversity (Moran’s I =− 0.51, p=0.7) and bee visits (Moran’s I=− 1.01, p=0.84) showed no significant spatial pattern of residuals, which indicated no effect of spatial autocorrelation on parameter estimation.
Removing honeybees, bee plot visits increased with plant diversity (t=4.2, p<0.001), floral abundance (t=3.3, p=0.001), and green area size (t=2.19, p=0.03). There was no spatial autocorrelation of model residuals (Moran’s I=− 0.64, p=0.74).
0 40000 80000 120000 0.10 0.15 Bee Diversity Green Area 0 40000 80000 120000 −0.05 0.00 0.05 0.10 Edge Density 0 40000 80000 120000 −0.04 −0.02 0.00 0.02 Bee Visits 0 40000 80000 120000 −0.22 −0.20 −0.18 −0.16 0 40000 80000 120000 0.00 0.05
Bee Visits w/o Honeybees
0 40000 80000 120000 −0.05
0.00 0.05
Spearman‘s Correlation Coefficient (rho)
Area (km2)
Fig. 4 Correlation between of extent of green area and green area edge density with bee diversity, bee visits, and bee visits excluding honeybees across the 89 sampled locations. Note the differences in scale at the y-axis. Solid lines show the p-value at 0.05 and dashed lines at 0.1. There was no significant correlation between bee visits and extent of green area as well as bee visits and edge density. No significant correlation was also found between edge density and bee diversity, and the extent of green area and bee visits
Syrphids
We found highly significant differences between sites with and without syrphid diversity when accounting for the size of green area at 200 m radius and edge density at 80 m radius (Table1). Similarly, there was a significant difference between field sites with and without syrphid visits when considering the size of green area at 200 m radius (Table1). There was
0 20000 60000 100000 0.25 0.30 0.35 0.40 Syrphid Diversity Green Area 0 20000 60000 100000 0.1 0.2 0.3 Edge Density 0 20000 60000 100000 0.15 0.20 0.25 0.30 0.35 0.40 Syrphid Visits 0 20000 60000 100000 0.0 0.1 0.2 0.3
Spearman‘s Correlation Coefficient (rho)
Area
(m
2)
Fig. 5 Correlation between the extent of green area and edge density with syrphid diversity and syrphid visitation frequency across the 89 sampled locations. Note the differences in scale at the y-axis. Solid lines show the p-value at 0.05 and dashed lines at 0.1. All correlation coefficients between syrphid diversity and the extent of green area were significant with p<0.05
no significant difference between field sites with and without syrphid visits considering edge density at 80 m radius (W=893, p=0.08). For both syrphid diversity and plot visits there were larger mean values for edge density and green area size when syrphids were observed (Table1).
Syrphid diversity increased with floral abundance and green area (t=2.38, p=0.02), but there was no effect of floral abundance (t=0.44, p=0.66) and green area (t=1.38, p=0.18) alone on syrphid diversity. More syrphids visited plots with larger plant diversity (t=2.11, p= 0.04) and with increasing size of the surrounding green area (t=2.24, p=0.03). With increasing number of flowers, however, fewer syrphids visited the plots (t=− 2.3, p=0.03). As with bees, models for syrphid diversity (Moran’s I=1.25, p=0.11) and syrphid visits (Moran’s I=1.16, p=0.12) showed no significant spatial residual pattern.
Discussion
Scale effects of landscape metrics
Landscape factors influenced diversity and visits of bees and syrphids at flowering patches at different spatial scales. In almost all cases, the correlation between diversity or visit frequency of both pollinator groups with the landscape metrics of extent of green area and edge density became stronger at larger scales. In semi-natural and natural landscapes correlation coefficients of bee species richness as well as visits with proportion of seminatural habitats also increased with scale (Steffan-Dewenter and Tscharntke 2002). This reflects that the variation in bee diversity and visits can be explained by the extent of green area and edge density at larger scales than 200 m radius even in urban environments, although other studies reported reduced foraging ranges of bees in cities (Lopez-Uribe et al. 2008; Van Rossum and Triest2010). Given, however, the large foraging ranges of bees up to 1.5 km (Darvill et al. 2004; Gathmann and Tscharntke 2002; Osborne et al. 2008a; Zurbuchen et al.2010), green areas can function as habitats for foraging and as“stepping stones” on long-distant foraging bouts (Dearborn and Kark2010; Dover and Settele2009), while edges of green areas can be expected to serve as foraging routes (Osborne et al. 2008b).
Our results also provide evidence that the variation of syrphid density and diversity in urban environments is more explained at larger (i.e., above 100 m radius or≈31,500 m2) than smaller scales. These results corroborate earlier studies (Meyer et al. 2009; Sommaggio 1999) and can be referred to the response of the five most common syrphid species Episyrphus balteatus, Eristalis tenax, Sphaerophoria scripta, Syrphus ribesii, and Syritta pipiens in our study (which account for 59.6% of syrphid floral visits and 58.1% of recorded syrphid plot visits (Online Resource1)). These species travel distances of several
Table 1 Mean and standard deviations of landscape metrics for field sites with syrphid species and without syrphid species. Test statistics is derived from Wilcoxon exact test
No syprhids Syrphids W P-value Diversity Edge density 0.09±0.03 0.1±0.02 1,162.5 0.008
Green area 0.46±0.26 0.62±0.21 1,254 0.0005 Visits Edge density 0.088±0.029 0.1±0.025 893 0.08
kilometres while migrating in natural environments (Gatter and Schmid 1990) and are known synanthropic species (Bankowska 1980). Although there is little information on foraging ranges of these syrphids (and syrphids in general) in urban environments, the potential for long-distance movement exists and that explains larger correlation coefficients with increasing scale in our study.
The stronger positive response of syrphid diversity (compared to bee diversity) to landscape metrics over the entire scale (Figs.4and5) can be also explained by the different biology of syrphids and bees. In contrast to bees parental care is not known from syrphids (van Veen2004). Additionally, syrphid larvae depend on different resources than adults and live in different habitats (Sommaggio1999; van Veen2004). Areas with increased mosaic richness of habitats and landscape structures promote therefore syrphid species richness and abundance (Haenke et al.2009), which is more likely to be found in larger green areas and with a larger density of green area edges.
Edge density of green area
For bees (unlike syrphids), as scale increases the correlation of species diversity against edge density continues to increase. This suggests that as habitats are increasingly dissected at larger scales a wider range of bee species are observed at the local patch scale. Presumably, this is due to the larger ranges of many bees (in contrast to syrphids) such that larger scales better reflect the habitat structure that supports wide ranging bees. Thus, bee diversity is a function of large scale habitat structure. On the other hand, green edges provide nesting sites for bees (Osborne et al. 2008b). An increased edge density offers opportunities of breeding for many bee species, which can explain the positive correlation. For bee visits, the scale relationships expressed by the results are apparently explained by the different spatial area over which different bees forage (Gathmann and Tscharntke 2002; Greenleaf et al. 2007). At smaller scales different responses of large and small foraging bees to edge density are reflected by larger variation in the correlation coefficient. Removing honeybees (densities of which are strongly dependent on urban honeybee-hives) reduced the variation and made the correlation positive at scales between 50 and 70 m radius. Although the correlation coefficients still varied considerably, we conjecture that the variation is due to species specific responses of bees to edge density, although there is little information on such specific responses of bee species to urban green edges.
An increase in the edge density/syrphid visitation rate correlation coefficient with scale is obviously explained by the importance of edges for syrphids. Syrphids require different microhabitats for larval and adult growth (van Veen 2004). Flowering trees and shrubs provide larval food and resources. In urban environments trees and shrubs often grow or are transplanted along edges of green areas (Hopwood 2008; Lundholm and Marlin 2006), while the green area core is most often a lawn used for recreational activities. The increasing correlation thus reflected larger resource amount with increasing edge density of green areas.
Edges also facilitate movement (hence visits) of syrphids that forage over larger areas, at least up to 20,000 m2after which there is no further improvement in the correlation of edge density with increasing scale. Syrphids have been shown to be sensitive to different barriers (Wratten et al. 2003), which may differ in the extent to which they influence syrphid movements. Responses of edges on movement of insects across the landscape can be, however, species specific. As no direct comparison of edge types or their effects on insect activity has been made within urban environments, we know little about the specific responses of syrphids to these habitat elements.
In contrast to the abovementioned explanations, which refer to the biology of bees and syrphids, the shape of areas can also determine movement patterns (Ims 1995, and references therein). Green areas with higher edge densities also have an irregular shape with concave and convex boundaries. Curved boundaries can act as channels for emigration and immigration (in Ims (1995): Hanski and Peltonen 1988; Hardt and Forman 1989), promoting bee and syrphid movement. This is obviously supported by our results as there was positive correlation between green area edge density and syrphid visits. In contrast, bee visits were negatively correlated over the entire scale (i.e., from 20 to 200 m radius) with the exception when honeybees were removed. Presumably honeybees prefer open spaces and the location may be easier to communicate in the hive (Steffan-Dewenter and Kuhn 2003).
Green area
The correlation for bee and syrphid diversity with green area was positive over all scales indicating a positive relationship of green area with diversity of these groups, although the strength of the relation levels off at a radius of 100 m (≈ 31,500 m2) for bee diversity, while for syrphid diversity it continues to improve. Thus, syrphid diversity is more strongly related to the extent of green area than bee diversity.
The correlation pattern between the visit frequency of syrphids and green area resembles the results for syrphid diversity with a maximum value at the largest scale (≈ 125,500 m2), though the curve continues to rise more steeply than in syrphid diversity. In other words, as the extent of green area increases at larger scales both syrphid diversity and visits increases. These responses may be related in that higher syrphid diversity may itself increase visitation frequency as different flowers partition resources.
In contrast, bee visit frequency showed much variability at scales between 1,250 and 50,000 m2(i.e., 20–125 m radius), but tended to level off thereafter. The variability refers to visits by honeybees, because the correlation of bee plot visits were similar to results for bee diversity after removing honeybees. For honeybees presumably other factors are more important in explaining the variability, including flower composition or the management of the green area (Brown and Freitas 2002; Smith et al. 2006). Moreover, honeybees can forage over large distances (Goulson 2003), which is why they can be affected by other factors not accounted for by the spatial scale of our study. Finally, honeybees are usually kept in hives and might be buffered against negative impacts of urbanization such as fragmentation and habitat alteration, which could affect the search for adequate nesting sites. For wild bees, however, a positive correlation with green area indicates the importance of green patches as foraging and nesting places. In areas with large support of green area structures such as parks and gardens, more wild bee species can be therefore expected (Fetridge et al.2008; Frankie et al.2009).
Local and large scale factors
We found that plant diversity and floral abundance are positively correlated with bee diversity and abundance, and syrphid visits. More diverse plant patches attract a wider range of floral visitors on account of the wider range of resources they offer (Ghazoul2006; Potts et al.2004). In rural or natural settings it is not unexpected that flower visitor diversity is correlated with plant diversity (e.g., Biesmeijer et al.2006; Ebeling et al.2008; Hegland and Boeke2006), but there are fewer studies reporting positive relationships between plant diversity and floral abundance with bee and syrphid diversity and visitation frequency in a
highly transformed urban setting, where floral resource patches are more limited in both number and extent (Ahrné et al. 2009; Kearns and Oliveras 2009). More limited flowering patch availability might be expected to undermine patterns of resource selection and differentiation by pollinators (i.e., pollinators are forced to make do with what they get), leading to a breakdown in the correlation between resource variety and pollinator diversity. This does not, however, appear to be the case for bees and syrphids, which suggests that the promotion of pollinator diversity within urban settings needs to consider not only the number of green patches at large scales, but also their floral composition at patch scales.
In contrast to floral diversity, floral abundance (independently of diversity) had no effect on bee diversity. The lack of any relation between bees and floral abundance was also found in other studies (Ahrné et al. 2009) and can be attributed to the foraging ranges of honeybees and bumblebees which can exceed several hundred meters at least in rural settings (Gathmann and Tscharntke2002). This species accounts for the majority of floral visits by bees. While foraging ranges are less clear in urban centers, it is feasible that honeybees briefly use green areas such as lawns, gardens or meadows as stepping stones between the nest and more rewarding sites which might even lie beyond the periphery of a city such as Zürich. In such a case, floral visitation by honeybees is less a function of patch quality but rather whether it lies along the path between the nest and a larger resource area (Angold et al.2006; Dearborn and Kark2010; Dover and Settele2009).
In contrast to bee species, syrphid species were influenced by the number of flowers in the plots as might be expected for insects that have smaller foraging ranges and therefore are more dependent on patches within a smaller locality. A greater number of syrphid species in plots with larger floral abundance can be simply attributed to greater availability of resources (MacLeod1999; Sih and Baltus1987). Syrphids also have a range of habitat requirements for breeding and foraging (van Veen2004): larvae of some species occur in tree holes, in muddy ponds, or hunt on aphids, while most adult syrphids forage on flowers or suck plant sap. We expect that larger green areas will provide this diversity of breeding requirements and with increasing flower number would have attracted more syprhids. We conjecture that the negative effect of increasing floral density and green area on syrphid visits is referred to larger resource availability with increasing patch size. The likelihood for finding more rewarding floral spots increases with patch size and fewer syrphid visits could have been then observed at a single floral spot.
This study emphasizes the importance of green area for diversity and visits of bees and syrphids in our urban environment. Our results showed that green area was the only significant variable, which describes the urban matrix and affects both bees and syrphids. In particular, bee diversity and visits responded positively on green area size. This is in line with other urban studies reporting an increase of bee species with size of green structures such as parks (Ahrné et al.2009; McFrederick and LeBuhn 2006). The positive effect of green area on bees and syrphids can be attributed to the provision of food in terms of floral resources and nesting sites.
Edge density of green areas was the second important variable describing our urban environment affecting bees, but not syrphids. Although edges along green areas contain many flowering shrubs and trees, which potentially provide nesting and foraging sites for bees, we found no evidence to support this. On the contrary, increasing extent of edges was associated with reduced plot visits by bees. This may be largely due to the negative affect of edges on visitation by honeybees because excluding honeybees from the analysis resulted in no significant effect of edge density on bee visitation frequency. This suggests that honeybees presumably prefer more open areas for foraging.
Conclusion
The spatial factors (i.e., landscape metrics) edge density and the extent of green area showed a positive impact on bee and syrphid fly diversity, potentially affecting their foraging behavior and potential services to plant species within the urban environment. In addition, the importance of these metrics varied depending on the scale of analysis with the most appropriate scales being between 80 and 100 m radius (≈ 20,000 m2) and above 150 m (≈ 70,000 m2) for diversity as well as visitation frequency of bees and syrphids, respectively.
The local factors plant diversity and flower abundance influenced bee diversity and visits, while we found positive effects of plant diversity and floral abundance on syrphid diversity, while fewer syrphid visits were recorded with increasing floral abundance. The different effects on these two flower visitor groups emphasize the need to consider conservation schedule independently for each. The variation of the correlation between the landscape metrics and visits as well as diversity of bees and syrphids with scale suggests that finding appropriate schedules for realizing conservation of pollinator species within the urbanity needs to consider the spatial scale.
These results are derived from a single study of a small city. Generalizing from these results to other urban areas needs to be undertaken with caution as there is no replicability at the level of the city. It is possible that these responses differ among cities depending on the overall size (and therefore proximity to semi-natural and rural areas), levels of pollution, intensity of human activity or other factors (Schwarz2010). Although we have not done a comparative analysis, the city of Zurich does appear to contain a large number of relatively small patches of flowering plants in urban gardens, along roadsides, in parks and on rooftops, and it may represent a more hospitable urban habitat for both plants and their pollinators than other cities of comparable or larger size. There remains a need for a more comprehensive study conducted over several cities that vary in size before broader conclusions can be made with confidence.
Acknowledgements We would like to thank Dr. Chris Kettle for his help on the manuscript, and the journal editor and two reviewers for helpful comments.
References
Ahrné K, Bengtsson J, Elmqvist T (2009) Bumble bee (Bombus spp.) along a gradient of increasing urbanization. PLoS Biol 4(5):e5574
Amiet F (1996) Hymenoptera. Apidae, 1. Teil, volume 12 of Insecta Helvetica. Schweizerische Entomologische Gesellschaft
Angold PG, Sadler JP, Hill MO, Pullin A, Rushton S, Austin K, Small E, Wood B, Wadsworth R, Sanderson R, Thompson K (2006) Biodiversity in urban habitat patches. Sci Total Environ 360(1–3):196– 204
Bankowska R (1980) Fly communities of the family Syrphidae in natural and anthropogenic habitats of Poland. Mem Zoologi 33:3–93
Bässler M, Jäger E, Werner K (1996) ROTHMALER Exkursionsflora von Deutschland. Gefäßpflanzen: Grundband, volume 2. Gustav Fischer, 16 edition
Bhattacharya M, Primack RB, Gerwein J (2003) Are roads and railroads barriers to bumblebee movement in a temperate suburban conservation area? Biol Conserv 109(1):37–45
Biesmeijer JC, Roberts SPM, Reemer M, Ohlemuller R, Edwards M, Peeters T, Schaffers AP, Potts SG, Kleukers R, Thomas CD, Settele J, Kunin WE (2006) Parallel declines in pollinators and insect-pollinated plants in Britain and the Netherlands. Science 313(5785):351–354
Bivand, R, with contributions by Anselin L, Asunçao RA, Berke O, Bernat A, Carvalho M, Chun Y, Christensen B, Dormann C, Dray S, Halbersma R, Krainski E, Lewin-Koh N, Li H, Ma J, Millo G, Mueller W, Ono H, Peres-Neto P, Reder M, Tiefelsdorf M, Yu D (2009) spdep: Spatial dependence: weighting schemes, statistics and models. R package version 0.4–52
Bjornstad ON (2009) ncf: spatial nonparametric covariance functions. R package version 1.1–3
Brenneisen S (2006) Space for urban wildlife: designing green roofs as habitats in Switzerland. Urban Habitats 4(1):27–36
Brown KS, Freitas AVL (2002) Butterfly communities of urban forest fragments in Campinas, São Paulo, Brazil: Structure, instability, environmental correlates, and conservation. J Insect Conserv 6(4):217–231 Buchmann SL, Nabhan GP (1996) The forgotten pollinators. Island Press
Cane JH, Minckley RL, Kervin LJ, Roulston TH, Williams NM (2006) Complex responses within a desert bee guild (Hymenoptera: Apiformes) to urban habitat fragmentation. Ecol Appl 16(2):632–644 Cohen JE (2003) Human population: the next half century. Science 302(5648):1172–1175 Crane P, Kinzig A (2005) Nature in the metropolis. Science 308(5726):1225–1225
Darvill B, Knight ME, Goulson D (2004) Use of genetic markers to quantify bumblebee foraging range and nest density. Oikos 107(3):471–478
Dearborn DC, Kark S (2010) Motivations for conserving urban biodiversity. Conserv Biol 24(2):432–440 Di Gulio M, Nobis M (2008) Landschaftszerschneidung und Biodiversität: Barrieren oder Ausbreitungswege?
Forum für Wissen, pp. 23–30
Donaldson J, Nanni I, Zachariades C, Kemper J, Thompson JD (2002) Effects of habitat fragmentation on pollinator diversity and plant reproductive success in renosterveld shrublands of South Africa. Conserv Biol 16(5):1267–1276
Dormann CF, McPherson JM, Araujo MB, Bivand R, Bolliger J, Carl G, Davies RG, Hirzel A, Jetz W, Kissling WD, Kuehn I, Ohlemueller R, Peres-Neto PR, Reineking B, Schroeder B, Schurr FM, Wilson R (2007) Methods to account for spatial autocorrelation in the analysis of species distributional data: a review. Ecography 30:609–628
Dover J, Settele J (2009) The influences of landscape structure on butterfly distribution and movement: a review. J Insect Conserv 13(1):3–27
Ebeling A, Klein AM, Schumacher J, Weisser WW, Tscharntke T (2008) How does plant richness affect pollinator richness and temporal stability of flower visits? Oikos 117(12):1808–1815
Environmental Systems Research Institute (ESRI) Inc. (2006) ArcGIS
Faraway J (2009) Faraway: functions and datasets for books by Julian Faraway. R package version 1.0.4 Fetridge ED, Ascher JS, Langellotto GA (2008) The bee fauna of residential gardens in a Suburb of New
York City (Hymenoptera: Apoidea). Ann Entomol Soc Am 101(6):1067–1077
Frankie GW, Thorp R, Hernandez J, Rizzardi M, Ertter, Pawelek JC, Witt SL, Schindler M, Coville R, Wojcik V (2009) Native bees are a rich natural resource in urban California gardens. Calif Agr 63(3):113–120 Gathmann A, Tscharntke T (2002) Foraging ranges of solitary bees. J Anim Ecol 71(5):757–764 Gatter W, Schmid U (1990) Die Wanderungen der Schwebfliegen (Diptera, Syrphidae) am Randecker Maar.
Spixiana 15:9–100
Ghazoul J (2006) Floral diversity and the facilitation of pollination. J Ecol 94:295–304
Ghazoul J, Willmer PG (1994) Endothermic warm-up in two species of sphecid wasp and its relation to behaviour. Physiol Entomol 19:103–108
Giannakouris K (2008) Population and social conditions. Technical Report 72, EUROSTAT. European Comission Gilbert F, Gonzalez A, Evans-Freke I (1998) Corridors maintain species richness in the fragmented
landscapes of a microecosystem. P Roy Soc Lond B Bio 265(1396):577–582
Godefroid S, Koedam N (2007) Urban plant species patterns are highly driven by density and function of built-up areas. Landscape Ecol 22(8):1227–1239
Goulson D (2003) Effects of introduced bees on native ecosystems. Annu Rev Ecol Syst 34:1–26 Greenleaf SS, Williams NM, Winfree R, Kremen C (2007) Bee foraging ranges and their relationship to body
size. Oecologia 153(3):589–596
Grimm NB, Foster D, Groffman P, Grove JM, Hopkinson CS, Nadelhoffer KJ, Pataki DE, Peters DPC (2008) The changing landscape: ecosystem responses to urbanization and pollution across climatic and societal gradients. Frontiers Ecol Environ 6(5):264–272
Haenke S, Scheid B, Schaefer M, Tscharntke T, Thies C (2009) Increasing syrphid fly diversity and density in sown flower strips within simple vs. complex landscapes. J Appl Ecol 46(5):1106–1114
Hanski I, Peltonen A (1988) Island colonization and peninsulas. Oikos 51(1):105–106
Hardt RA, Forman RTT (1989) Boundary form effects on woody colonization of reclaimed surface mines. Ecology 70(5):1252–1260
Hegland SJ, Boeke L (2006) Relationships between the density and diversity of floral resources and flower visitor activity in a temperate grassland community. Ecol Entomol 31(5):532–538
Heinrich B (1975) Energetics of pollination. Annu Rev Ecol Syst 6:139–170
Hopwood JL (2008) The contribution of roadside grassland restorations to native bee conservation. Biol Conserv 141(10):2632–2640
Hothorn T, Hornik K (2006) exactRankTests: exact distributions for rank and permutation tests. R package version 0.8–18
Ims RA (1995) Movement patterns related to spatial structures. In: Hannsson L, Fahrig L, Merriam G (eds) Mosaic Landscappes and Ecological Processes, volume 2 of IALE Studies in Landscape Ecology, chapter 4, pages 85–109. Chapman & Hall
Kadas G (2006) Rare invertebrates colonizing green roofs in London. Urban Habitats 4(1):66–86 Kearns CA, Oliveras DM (2009) Environmental factors affecting bee diversity in urban and remote grassland
plots in Boulder, Colorado. J Insect Conserv 13(6):655–665
Kevan PG, Baker HG (1983) Insects as flower visitors and pollinators. Annu Rev Entomol 28:407–453 Lopez-Uribe MM, Oi CA, Del Lama MA (2008) Nectar-foraging behavior of Euglossine bees
(Hymenoptera: Apidae) in urban areas. Apidologie 39(4):410–418
Lundholm JT, Marlin A (2006) Habitat origins and microhabitat preferences of urban plant species. Urban Ecosyst 9:139–159
MacLeod A (1999) Attraction and retention of Episyrphus balteatus DeGeer (Diptera: Syrphidae) at an arable field margin with rich and poor floral resources. Agr Ecosyst Environ 73(3):237–244
McFrederick QS, LeBuhn G (2006) Are urban parks refuges for bumble bees Bombus spp. (Hymenoptera: Apidae)? Biol Conserv 129(3):372–382
Meyer B, Jauker F, Steffan-Dewenter I (2009) Contrasting resource-dependent responses of hoverfly richness and density to landscape structure. Basic Appl Ecol 10(2):178–186
Morgan KR, Heinrich B (1987) Temperature regulation in bee- and wasp-mimicking syrphid flies. J Exp Biol 133:59–71
Niemelä J (1999) Ecology and urban planning. Biodivers Conserv 8(1):119–131
Oberndorfer E, Lundholm J, Bass B, Coffman RR, Doshi H, Dunnett N, Gaffin S, Kohler M, Liu KKY, Rowe B (2007) Green roofs as urban ecosystems: Ecological structures, functions, and services. Bioscience 57 (10):823–833
Oksanen, J, Kindt, R, Legendre, P, O’Hara, B, Simpson, GL, Solymos, P, Stevens, MHH, Wagner, H (2009) vegan: Community Ecology Package. R package version 1.15–4
Oosterbroek P (2006) The European Families of the Diptera. KNNV Publishing
Osborne JL, Martin AP, Carreck NL, Swain JL, Knight ME, Goulson D, Hale RJ, Sanderson RA (2008a) Bumblebee flight distances in relation to the forage landscape. J Anim Ecol 77(2):406–415
Osborne JL, Martin AP, Shortall CR, Todd AD, Goulson D, Knight ME, Hale RJ, Sanderson RA (2008b) Quantifying and comparing bumblebee nest densities in gardens and countryside habitats. J Appl Ecol 45(3):784–792
Potts SG, Vulliamy B, Roberts S, O’Toole C, Dafni A, Ne’eman G, Willmer PG (2004) Nectar resource diversity organises flower-visitor community structure. Entomol Exp Appl 113(2):103–107
Rebele F (1994) Urban ecology and special features of urban ecosystems. Global Ecol Biogeogr 4(6):173– 187
Saure C (1996) Urban habitats for bees: the example of the city of Berlin. In: Matheson A, Buchmann SL, O‘Toole C, Westrich P, Williams IH (eds.) The Conservation of Bees, number 18 in Linnean Society Symposium, chapter 4, pp. 47–53. Academic Press
Schwarz N (2010) Urban form revisited–Selecting indicators for characterising European cities. Landscape Urban Plan 96(1):29–47
Sheater SJ (2009) A modern approach to regression with R. Springer
Sih A, Baltus MS (1987) Patch size, pollinator behavior, and pollinator limitation in Catnip. Ecology 68 (6):1679–1690
Smith RM, Warren PH, Thompson K, Gaston KJ (2006) Urban domestic gardens (VI): environmental correlates of invertebrate species richness. Biodivers Conserv 15(8):2415–2438
Sommaggio D (1999) Syrphidae: can they be used as environmental bioindicators? Agr Ecosyst Environ 74 (1–3):343–356
Ssymank A, Kearn CA, Pape T, Thompson FC (2008) Pollinating Flies (Diptera): A major contribution to plant diversity and agricultural production. Biodiversity 9(1–2):86–89
Statistisches Amt Zürich (2008) Medienmitteilung des Statistischen Amtes. Rekordhohes Bevölkerungswachstum im Kanton Zürich. Technical report, Kanton Zürich
Steffan-Dewenter I, Kuhn A (2003) Honeybee foraging in differentially structured landscapes. P Roy Soc Lond B Bio 270(1515):569–575
Steffan-Dewenter I, Tscharntke T (2002) Insect communities and biotic interactions on fragmented calcareous grasslands—a mini review. Biol Conserv 104(3):275–284
Stuke J (1998) Die Bedeutung einer städtischen Grünanlage für die Schwebfliegenfauna (Diptera: Syrphidae) dargestellt am Beispiel des Bremer“Stadtwaldes”. Abhandlungen Naturwissenschaftlicher Verein zu Bremen 44(1):93–114
Tewksbury JJ, Levey DJ, Haddad NM, Sargent S, Orrock JL, Weldon A, Danielson BJ, Brinkerhoff J, Damschen EI, Townsend P (2002) Corridors affect plants, animals, and their interactions in fragmented landscapes. P Natl Acad Sci USA 99(20):12923–12926
Townsend PA, Levey DJ (2005) An experimental test of whether habitat corridors affect pollen transfer. Ecology 86(2):466–475
United Nations (2008) World urbanization prospects: The 2007 revision population database. Technical report, United Nations
Vamosi JC, Knight TM, Steets JA, Mazer SJ, Burd M, Ashman TL (2006) Pollination decays in biodiversity hotspots. P Natl Acad Sci USA 103(4):956–961
Van Geert A, Van Rossum F, Triest L (2010) Do linear landscape elements in farmland act as biological corridors for pollen dispersal? J Ecol 98(1):178–187
Van Rossum F, Triest L (2010) Pollen dispersal in an insect-pollinated wet meadow herb along an urban river. Landscape Urban Plan 95(4):201–208
van Veen, MD (2004) Hoverflies of Northwest Europe. KNNV Publishing
Willmer PG, Stone GN (2004) Behavioral, ecological, and physiological determinants of the activity patterns of bees. Adv Stud Behav 34:347–466
Wratten SD, Bowie MH, Hickman JM, Evans AM, Sedcole JR, Tylianakis JM (2003) Field boundaries as barriers to movement of hover flies (Diptera: Syrphidae) in cultivated land. Oecologia 134(4):605–611 Zurbuchen A, Landert L, Klaiber J, Mueller A, Hein S, Dorn S (2010) Maximum foraging ranges in solitary bees: only few individuals have the capability to cover long foraging distances. Biol Conserv 143 (3):669–676
Zuur AF, Ieno EN, Walker NJ, Saveliev AA, Smith GM (2009) Mixed effects models and extensions in ecology with R. Springer