Three-dimensional flexural modelling of the Ebro Basin
(NE Iberia)
J. M. Gaspar-Escribano,
1J. D. van Wees,
1M. ter Voorde,
1S. Cloetingh,
1E. Roca,
2L. Cabrera,
2J. A. Mun˜oz,
2P. A. Ziegler
3and D. Garcia-Castellanos
1,
1
Faculteit der Aardwetenschappen, Vrije Universiteit, De Boelelaan 1085, 1081 HV Amsterdam, The Netherlands. E-mail: [email protected]
2
Facultat de Geologia, Universitat de Barcelona, c/Martı´ Franque´s s/n, 08071 Barcelona, Spain
3
Geological-Palaeontological Institute, University of Basel, Bernoullistrasse 32, 4065 Basel, Switzerland
Accepted 2000 November 18. Received 2000 November 1; in original form 2000 January 6
S U M M A R Y
The Ebro Basin, the southern foreland basin of the Pyrenees, has undergone a complex evolution in which, apart from the Pyrenees, the Iberian Range and the Catalan Coastal Ranges have played an important role, both as sediment sources and as basin confining structures. The deflected basement underlying the Ebro Basin dips north, suggesting a lithospheric-scale control on the structure of this basin. This is compatible with the results of subsidence analyses, which show that the study area is not in a local mode of isostatic compensation.
In order better to understand the mechanisms that led to the present configuration of the Ebro Basin, and particularly the relevance of the various kinds of (un)loading (e.g. surrounding fold-and-thrust belts, basin topography, subsurface loads), we carried out a 3-D kinematic modelling study that accounts for the flexural state of the litho-sphere, subjected to various loads applied at its lateral boundaries, and the sedimentary fill of the basin. We also included the effect of Neogene extensional tectonics along the eastern basin margin, which is related to the opening of the Valencia Trough.
We show the suitability of the 3-D lithospheric-scale flexural modelling approach to the study of NE Iberia. Modelling results point to a relatively strong lithosphere in this area, with values of effective elastic thickness ranging from 10 to 35 km in the Ebro Basin, increasing towards the Pyrenees. We also find that the topographic (tectonic) load itself is insufficient to explain the observed basement deflection. Thus an extra sub-surface load beneath the Pyrenees, corresponding to the underthrusted Iberian litho-sphere, is required. The effect of lithospheric stretching in the Valencia Trough on the Ebro Basin is appreciable only in its eastern part, where the lithosphere was uplifted. This had considerable repercussions on the sedimentary and erosional regime of the Ebro Basin. We have analysed the link between the stretching-related, tectonically uplifted areas and the erosional patterns observed onshore northeast Iberia.
Key words: 3-D numerical modelling, Ebro Basin, erosion, flexure, subsidence, surface processes, Valencia Trough.
1 I N T R O D U C T I O N
The northeastern region of the Iberian Peninsula (Fig. 1) is located in an area that, since the end of the Variscan orogeny, has undergone several stages of deformation involving mech-anisms such as extension, compression, or even both simul-taneously (Vegas & Banda 1982; Roca & Guimera` 1992; Salas & Casas 1993; Verge´s & Garcı´a-Senz, 2000). The resultant structural–geomorphological setting reflects the complexities of the polyphase evolution of this area.
The late Mesozoic–Cenozoic convergence of the African and Eurasian plates led to the collision of the Iberian and the European plates and the development of the Pyrenean orogen, which is characterized by a considerably thickened upper crust (Mun˜oz 1992). The Iberian Range and the Catalan Coastal Ranges developed in the interior of the Iberian plate in response to compressional deformation of Mesozoic rifted basins (Vegas & Banda 1982). The location of these three fold-and-thrust belts was controlled by pre-existing crustal weak-ness zones, provided by Mesozoic extensional fault systems
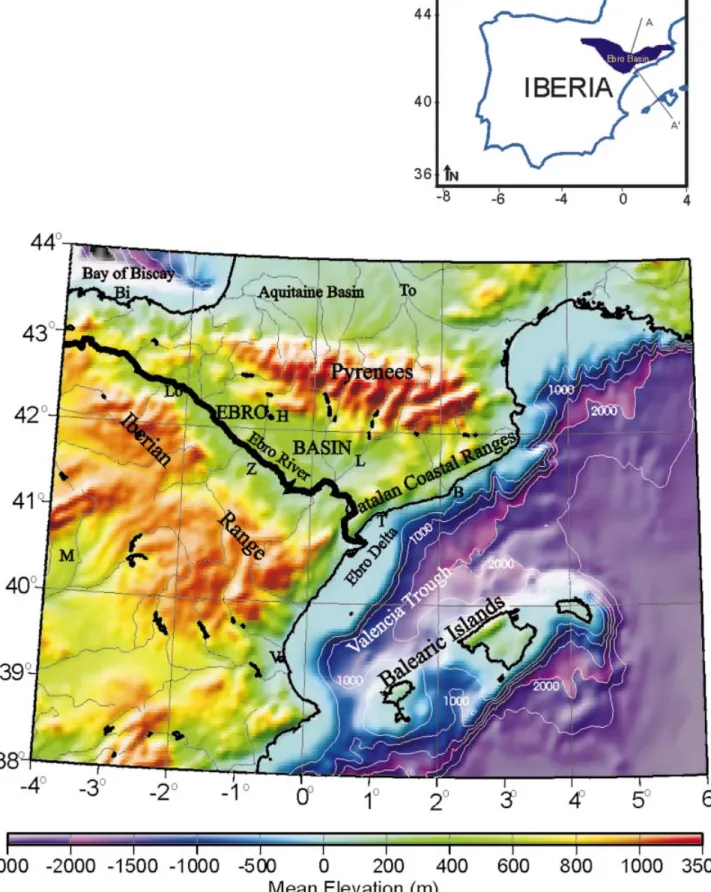
Figure 1. Topographic and bathymetric map of northeastern Iberia and the northwestern Mediterranean, including the main rivers. The Ebro River is highlighted. Note the large prograding shelf-talud of the Ebro Delta. The contour interval of bathymetry is 500 m. B: Barcelona, Bi: Bilbao, H: Huesca, L: Lleida, Lo: Logron˜o, M: Madrid, T: Tarragona, To: Toulouse, V: Valencia, Z: Zaragoza. Line A–Ak refers to Fig. 2.
(Roca & Guimera` 1992; Van Wees & Stephenson 1995; Beaumont et al. 2000). Since Late Oligocene–Early Miocene times, the eastern part of the Iberian plate has been affected by the extensional tectonics related to the opening of the northwestern Mediterranean Basin (Roca 2000). Both the crust and the lithospheric mantle are thinned beneath the Valencia Trough (Torne´ et al. 1996), although the extent to the Iberian inland, where this rifting stage deformed the lithosphere, is not well constrained. The Ebro Basin is surrounded by the Pyrenees, the Iberian and the Catalan Coastal ranges, and records the tectonic events controlling their evolution. There-fore its study can constrain the interrelationships between these events.
The configuration of the basement underlying the Cenozoic Ebro Basin, mainly northward-dipping, indicates that the Pyrenees exerted a large-scale control on the lithospheric flexure of their foreland. There are, however, a number of observations that suggest that other mechanisms contributed to the develop-ment of the Ebro Basin, thus necessitating an analysis of its 3-D (or even 4-D, if temporal evolution is included) setting (Figs 1 and 3):
(1) the Ebro Basin presents an asymmetrical triangular shape;
(2) the basement of the Ebro Basin is not uniformly deflected, neither in direction nor magnitude of plate bending, in front of the surrounding fold-and-thrust belts (Pyrenees, Iberian and Catalan Coastal ranges);
(3) During the development of the Ebro Basin, the con-trolling stress field underwent a complex evolution (Guimera` 1984), including phases of N–S compression during the Eocene and Oligocene, and NW–SE extension during the Late Oligocene–Early Miocene development of the Valencia Trough;
(4) During Plio-Miocene times, the northeasternmost part of the Ebro basin was uplifted and tilted westwards.
As the stratigraphic and structural record of the Ebro Basin and its surrounding fold-and-thrust belts is remark-ably well exposed in outcrops, and supplemented by a wealth of data coming from a variety of sources (e.g. well data, seismic sections), this area is particularly well suited for studying the evolution of foreland basins, and specifically basin flexural behaviour.
In view of this, many authors have designed flexural modelling studies in the Ebro Basin. Brunet (1986) modelled a section across the conjugate foreland basins of the Pyrenees (the Aquitaine Basin to the north and Ebro Basin to the south), including sedimentary load and varying the flexural rigidity of the lithosphere beneath the orogen. She considered a broken plate model with vertical shear forces at the boundary, thought to be related to the subducted cold lithospheric root of the Pyrenees. Desegaulx & Moretti (1988) also modelled the flexure of the lithosphere subjected to surface loads and concluded that the northwestern Iberian Range thrust front significantly influenced the basin geometry. Zoetemeijer et al. (1990) studied the flexural response of the lithosphere to topographic and subsurface loads along three profiles through the Ebro Basin, constraining their model with gravity and well data, and relating their results to observed heat flow patterns. To obtain a good fit they had to vary laterally the effective elastic thickness (Te) of the lithosphere, and, except for the westernmost profile
(Navarra–Rioja zone), concluded that subsurface loads could
be neglected. Desegaulx et al. (1990) analysed the flexural history of the Iberian and European plates, constraining their model with backstripping results and gravity data, and assuming a constant Teand no subsurface loads. They concluded that the
European plate is less rigid than the Iberian plate as a result their different stretching histories, primarily the Late Jurassic– Early Cretaceous crustal extension that weakened the European plate to a higher degree (see also Desegaulx et al. 1991). Milla´n et al. (1995) carried out flexural modelling of the lithosphere using gravity data, incorporating subsurface loads, spatial and temporal variations of Te, and the effects of palaeotopographic
variations in the external parts of the Pyrenees. Their results suggest that the pre-orogenic Cretaceous extensional phase had only a minor effect on the actual flexural rigidity of the litho-sphere. Finally, Waltham et al. (2000), analysed the subsidence history of a small part of the Ebro Basin using a flexural model, and concluded that the lithosphere as a whole is flexed down in response to its tectonic loading and that the crust is detached from the mantle lithosphere at lower crustal levels, the upper crust being subjected to stress-induced buckling (see also Cloetingh et al. 1999).
Although many authors have addressed the flexural behaviour of the Ebro Basin, their hypotheses differ widely and sometimes oppose each other. Most of the studies were carried out along cross-sections, ignoring or neglecting the effects of processes acting out of the plane of section. Only Desegaulx & Moretti (1988) carried out a 3-D analysis. Their model, however, was limited in a number of ways, namely by (1) not considering regional variations in lithospheric strength; (2) not addressing the effects of the topographic load of the Catalan Coastal Ranges and the extension in the Valencia Trough; and (3) not including the topography of the whole study area in their loading calculations. This means that they neglect a topographic load that in some cases reaches altitudes of 500–1000 m, which must have an important effect.
The objective of this paper is to study the flexural behaviour of the lithosphere in northeastern Iberia and to establish which assumptions are the most plausible in a first-order approach. For this purpose, we carried out a 3-D numerical modelling study, covering the entire area addressed, and investigated the role that various types of loads (e.g. topographic/tectonic loads, subsurface loads, etc.) play in the system, constrain-ing the amplitude and extent of the resultconstrain-ing deformations. Furthermore, we investigated the effects of other events on the Ebro Basin that traditionally are considered of second-order relevance, such as the Neogene extensional tectonics in the Valencia Trough.
2 G E O L O G I C A L S E T T I N G A N D T E M P O R A L E V O L U T I O N
The evolution of the Cenozoic Ebro Basin was influenced and controlled by the development of the thrust-and-fold belts that surround it, as well as by the opening of the Valencia Trough. In this section we describe these structural units and review the temporal evolution of NE Iberia, stressing the interplay of the individual processes that led to the actual configuration of the Ebro Basin. The differences between long- and short-wavelength phenomena and their relative relevance will be highlighted.
2.1 Morphotectonics
The Ebro Basin and its surrounding structural units have distinct topographical expressions. The main morpho-tectonic features of each structural unit are depicted in Figs 1, 2 and 5(b), and briefly described below:
The Pyrenees are a continent–continent collisional double-wedged, asymmetrical orogen that strikes E–W. The southern orogenic wedge is more developed than the northern one (Figs 1 and 2). The central (or axial) part of the chain consists of an antiformal stack of Palaeozoic basement imbrications with a maximum structural relief of 20 km, as estimated from restored crustal cross-sections (Mun˜oz 1992; Teixell 1998). The external part of the south Pyrenean wedge involves Triassic to Late Cretaceous syn-and post-rift sediments and Senonian– Early Miocene syn-orogenic sediments deposited in piggy-back basins as well as in the foreland basin. The end of the deformation migrated along-strike westwards, from the Middle Oligocene in the eastern Pyrenees to the Middle Miocene in the western Pyrenees (Verge´s et al. 1995). In contrast to the rest of the mountain chain, no underthrusting is identified in the westernmost Pyrenees (Souriau & Granet 1995; Ledo et al. 2000). The total amount of shortening is higher in the eastern and central areas (about 150–175 km, Mun˜oz 1992; Beaumont et al. 2000) than in the western Pyrenees (80 km, Teixell 1998).
Deep structure studies of the Pyrenees show that the under-thrusted Iberian lithosphere reaches depths of 80–100 km (Souriau & Granet 1995; Pous et al. 1995a,b; Ledo et al. 2000). The Iberian Range consists of folded and thrusted Palaeozoic and Mesozoic–Cenozoic rocks, cropping out along NW–SE-trending structures (Fig. 1), that resulted from the inversion of Mesozoic extensional basins (Salas & Casas 1993; Van Wees et al. 1998; Salas et al. 2000). Inversion movement commenced during the Late Eocene?–Oligocene (Guimera` 1994), at a time when the older Pyrenean thrust sequences were already formed, and continued until Miocene times. The age of the youngest Iberian structures is Early Miocene in the east and Middle Miocene towards the west. The development of this intraplate fold-and-thrust belt involved a total shortening of about 75 km with a maximum crustal thickening of 11 km (Guimera` et al. 1996).
The Catalan Coastal Ranges are the frontal part of a NE–SW-striking, inverted Early Mesozoic extensional basin, part of which is hidden beneath the Valencia Trough (Fig. 1). The structural style is mostly dominated by basement-involving steep upthrusts that reactivated Mesozoic extensional faults (Figs 2b, 5b). Crustal shortening and thickening are limited to 10–12 km and 2 km, respectively (Lawton et al. 1999). The age of the contractional structures ranges from Middle Eocene to Late Oligocene (Anado´n et al. 1985).
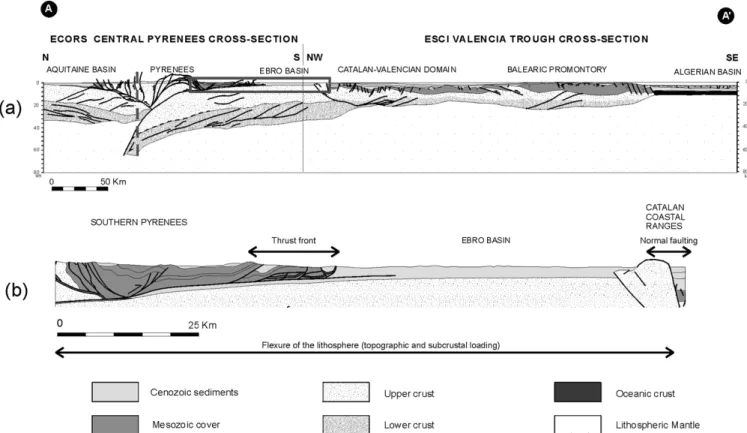
Figure 2. (a) Crustal balanced cross-section from the Aquitaine Basin to the Algerian Basin across the Pyrenees, the Ebro Basin, the Catalan Coastal Ranges and the Valencia Trough. The Pyrenees cross-section is from Beaumont et al. (2000), and the Valencia Trough cross-section from Sa`bat et al. (1997). The vertical dashed line indicates the approximate location of the assumed free, broken plate boundary (see Section 4 for explanation). (b) Zoom of the Ebro Basin and surroundings (framed area in part a) showing the different wavelengths of the tectonic processes involved in the configuration of the region. The long arrow indicates long-wavelength processes associated with lithospheric flexure arising from topographic/tectonic loads and subcrustal loads. Short arrows show short-wavelength phenomena, such as those produced by the entrapment of low-density bodies beneath the south Pyrenean thrust front and those related to the Catalan Coastal Ranges normal fault system. The approximate location of the cross-section is shown in Fig. 1.
The Ebro Basin is underlain by a 32 km thick crust that has been at best only slightly deformed since the Variscan orogeny (Figs 1 and 2). The fill of this basin consists of autochthonous flat-lying Palaeogene and Early Neogene sediments which extend beneath the thrusts of the Pyrenees and the western Iberian Range as far as 40 and 28 km, respectively (Bera´stegui et al. 1993; Salas et al. 2000). The thickest successions are pre-served close to the deformation front of the Pyrenees, attaining 4000 m in the western parts of the Ebro Basin. The age of the rocks underlying the Tertiary Ebro Basin infill is Palaeozoic and Permo-Triassic in the east, Jurassic in the centre of the basin and Permo-Triassic to the west, with Cretaceous sparsely found. The age of the youngest preserved sediments is Late Eocene in the eastern part of the Ebro Basin and Late Miocene in the western parts (Riba et al. 1983). This results from the non-deposition or erosion of thin Neogene sediments in the eastern Ebro Basin and a westward decreasing amount of erosion (Anado´n et al. 1989).
The Valencia Trough (Figs 1 and 2) is a Late Oligocene– Neogene extensional basin that is superimposed on the inverted Mesozoic basins of the Iberian and Catalan Coastal ranges (Roca & Desegaulx 1992). The major basin-bounding exten-sional faults of the Valencia Trough are located close to the Mediterranean coast, either offshore or onshore, where they reactivate the main (Palaeogene) contractional faults of the Catalan Coastal Ranges (Anado´n et al. 1985) (Figs 2b, 5b). Compressional tectonics related to the development of the Betic deformational front affected the southeastern margin of the basin (Roca & Desegaulx 1992). In the centre of the basin the crust has been substantially thinned, crustal thicknesses reaching values as low as 8 km (Sa`bat et al. 1997). The basin fill consists of a 2–3 km thick succession of Late Oligocene–Quaternary sediments unconformably overlying a fairly continuous, well-developed Palaeozoic–Mesozoic substratum (Clavell & Bera´stegui 1991; Bartrina et al. 1992). Two depositional megasequences are recognized (Roca et al. 1999): (1) the lower one is com-posed of Late Oligocene–Early Miocene syn-rift clastics and carbonates, mostly restricted to the grabens; (2) the upper one, Middle Miocene–Quaternary in age, was deposited during the post-rift stage and deeply buries the grabens and their flanks. Depositional evolution of this second megasequence is charac-terized by an initial progressive restriction of carbonate sedi-mentation, followed by the development of thick progradational shelf-slope terrigenous systems that record both the availability of large accommodation space and an increasing clastic supply from the Ebro Basin and surrounding orogens, commencing in Serravalian times (Bartrina et al. 1992; Roca & Desegaulx 1992).
2.2 Geological evolution
During Mesozoic times, Iberia was submitted to an extensional stress field related to the opening of the Atlantic and Tethys oceans and the Bay of Biscay (Ziegler 1988; Roest & Srivastava 1991). Major sedimentary basins developed along the margins of the area that presently is occupied by the Ebro Basin, which remained as a rather stable block during most of the Mesozoic. During the Late Cretaceous, the stress field changed in response to the onset of the N–S convergence of Africa and Eurasia. In NE Iberia deformation was initially localized in the area of the future Pyrenees, which were the first fold-and-thrust belt to grow. At this stage, foreland basin sedimentation was
restricted to narrow and strongly subsiding troughs in front of the inverting Early Cretaceous extensional basins (Verge´s & Garcı´a-Senz, 2000). At this time, the southward adjacent area of the Ebro Basin was uplifted, and then emerged and subjected to erosion (Puigdefa`bregas & Souquet 1986).
During the Palaeocene–Eocene, deposition of marine and continental sediments transgressed on the basal Tertiary uncon-formity of the evolving Ebro foreland basin, with the basin margin progressing southwards ahead of the south Pyrenean thrust sheets. The progressive southward advance of the thrust front resulted in the incorporation of foreland basin series into the Pyrenees, as well as the development of piggy-back basins (Puigdefa`bregas et al. 1986). Eocene foreland basin sediments occupied a wide area that extended a considerable distance southwards and eastwards of the present Ebro Basin limits (Fig. 3). This reflects the fact that during this period the litho-sphere responded by long-wavelength deflection to the loads exerted on it by the Pyrenees. Initial uplift pulses are Early– Middle Eocene in the Catalan Coastal Ranges (Anado´n et al. 1985) and probably not younger in the Iberian Range (Late Eocene?–Oligocene, Guimera` 1984, 1994).
During the Late Eocene, the progressive uplift of the western Pyrenees resulted in the closure of connections between the Ebro foreland basin and the Atlantic Ocean, implying the end of marine sedimentation. At the same time, inversion and uplift of the Iberian and Catalan Coastal ranges closed off the Ebro Basin to the SW and SE, which thus became tectonically silled. In conjunction with the progressive (basin-wards) development of the surrounding fold-and-thrust belts, more significant on the Pyrenean boundary than on any other (Fig. 2b), the area of the Ebro Basin became smaller. Moreover, the erosional base level of this now tectonically silled basin gradually rose, with detritus derived from its bounding ranges infilling the newly created accommodation space. This is particularly evident in the burial of the South Pyrenean thrust sheets by 2–3 km of their own debris (Coney et al. 1996; Fitzgerald et al. 1999).
The next cycle in the basin history began during the Late Oligocene, with the onset of rifting in the Valencia Trough (Fig. 3). This had a number of important consequences for the eastern part of the study region, namely: (1) progressive erosion of the Iberian and Catalan Coastal ranges; (2) the development of new accommodation space in the area of the rapidly subsiding Valencia Trough; and (3) lithospheric uplift of the Catalan Coastal Ranges area (rift shoulder effect).
Since the beginning of the Palaeocene, the Ebro Basin has been the site of sediment accumulation, first of both marine and non-marine and later of only continental sediments. After the Late Eocene, discharge from the Ebro Basin to adjacent areas was interrupted, due to its tectonic silling. Hence during the Late Oligocene–Early Miocene the basin surface must have been located significantly above sea level. Correspondingly, its sedi-mentary fill must have exerted an important loading effect on the lithosphere, affecting the whole region. This process con-tinued until the Middle Miocene, by which time the Ebro River had cut through the Catalan Coastal Ranges and progressively captured its present headwaters during the Late Miocene. From Middle Miocene times onwards, the sedimentary fill of the Ebro Basin was progressively eroded, with the Ebro River discharging erosion products into the Valencia Trough. Correspondingly, the lithosphere of the entire Ebro Basin was erosionally unloaded and uplifted during Late Miocene and more recent times (Verge´s et al. 1998; Fitzgerald et al. 1999).
Furthermore, the erosional unloading of the Catalan Coastal Ranges during Late Miocene and Pliocene times contributed to their uplift, which also affected the configuration of the Ebro Basin, although the relevance and duration of this is not well constrained.
During the Late Oligocene to Middle Miocene, the Valencia Trough underwent important syn-rift subsidence that was accompanied by the accumulation of basal clastics, followed by the deposition of the marine shale and carbonate sequence of the Alcanar group that, at the end of crustal extension, filled
in the rift topography (Clavell & Bera´stegui 1991). At the same time, the Catalan Coastal Ranges underwent a first phase of uplift (Roca & Guimera` 1992; Roca, 2000). From Langhian times onwards, the evolution of the Valencia Trough was characterized by post-rift thermal subsidence and the absence of significant tectonic deformation (Negredo et al. 1999). From the Serravallian onwards, the terrigenous shelf-slope complex related to the Ebro sediment supply prograded into the Valencia Trough and resulted in the Serravalian–Tortonian Castello´n Group and the Plio–Pleistocene Ebro Group, which
Figure 3. Main stages of the geological evolution of NE Iberia (after Riba et al. 1983; Rinco´n et al. 1983; Puigdefa`bregas & Souquet 1986; Mun˜oz 1992; Roca & Guimera` 1992; Salas & Casas 1993 and Coney et al. 1996). (a) Bartonian (Late Eocene): initial marine transgression. The northern part of the basin is submerged, whilst the southern part records continental sedimentation. The topography is not very developed, except in the Pyrenees. It is the final phase of marine sedimentation in the basin. (b) Chattian (Late Oligocene): the effect of the tectonic–topographic loads (mainly the Pyrenees) is important all over the basin, flexing down the lithosphere to the north. Coeval with regional N–S compression, rifting in the Valencia Trough implies an onset of NW–SE extension. During the Oligocene and Early Miocene, the Ebro Basin is closed to the sea, and it is full of continental deposits which contribute notably to the flexure of the lithosphere. In Middle Miocene times, important erosion by the Ebro river network takes place and these sediments are transported to the Mediterranean (indicated by dashed arrows), which has just started to open in this region (Late Oligocene). (c) Present day: topographic map showing various processes: long-wavelength processes such as the flexure of the lithosphere and sediment erosion; and short-wavelength ones such as Neogene–Quaternary volcanism, or normal faulting and associated grabens in the Catalan Coastal Ranges related to the stretching phase in the Valencia Trough. See text for further explanation.
are separated by the deeply incised Messinian unconformity (Clavell & Bera´stegui 1991; Roca & Desegaulx 1992). During the Messinian, low-standing sea level, large volumes of the Castello´n Group were eroded and re-deposited in the deeper parts of the West Mediterranean Basin. Therefore, a realistic material balance between sediments eroded from the Ebro Basin and the Catalan Coastal Ranges and sediments deposited in the Valencia Trough is difficult to establish.
Finally, the occurrence of Late Miocene to Recent volcanism in the eastern Pyrenees, northeastern Ebro Basin and the Valencia Trough (Figs 3 and 5b) must be emphasized. This magmatic activity is related to the rifting transfer zone between the Valencia Trough and Cerdanya to the Rhoˆne–Rhine rift in the north (onshore corresponds to La Garrotxa region and the associated NW–SE-striking fault system in Fig. 5b; Saula et al. 1994) and to the overall extensional evolution of the Valencia Trough in the south (Columbretes Islands, Martı´ et al. 1992). This activity distorted the properties of the lithosphere (Lewis et al. 2000).
In the studied region, present seismo-tectonic activity is low to moderate (Olivera et al. 1992; Masana 1994), except for the Pyrenees (Souriau & Pauchet 1998).
During Late Oligocene to Recent evolution of the Ebro Basin and the Valencia Trough, we observe a combination of long-wavelength features (loading and unloading of the Ebro Basin) and short-wavelength ones (rift-related normal faulting on the Catalan Coastal Ranges and associated grabens; volcanic activity) (Figs 2 and 3).
3 C O N S T R A I N T S F R O M S U B S I D E N C E A N A L Y S I S
In order to obtain an insight into the actual state of load compensation in NE Iberia, we carry out a subsidence analysis by backstripping wells. Such analyses (Steckler & Watts 1978) permit us to quantify the local isostatic component of basin subsidence related to the sediment infill of the available accom-modation space. The remaining, tectonic subsidence must be explained in terms of other processes, such as local lithospheric deformation, mantle-derived subsidence/uplift, or may indicate that flexural isostasy is not negligible in the studied basin (e.g. Van Wees et al. 1996).
In our analysis, we decompact sediment packages assuming local isostasy, following the procedure of Sclater & Christie (1980). For the sake of simplicity, we make a distinction only between marine and continental series, assuming average litho-logical properties. Thus, our analysis provides an estimate of the general trend, and not accurate specific values.
The database of our subsidence analysis consists of 43 wells that reach the base of the Tertiary sediments (here con-sidered as the top of the basement) (Lanaja 1987; see Fig. 1 for location). First, we refer the top of the well records to the zero reference level, preserving the observed sediment thicknesses. Following back stripping of these wells, we calculate the air-loaded configuration of the top basement surface assuming local isostasy (Fig. 4a). Finally, we correct for the observed topography (elevation of the well location above sea level) by subtracting the air-loaded basement from the topo-graphy, giving the so-called residual surface (residual surface= |topography|x |air-loaded|). If the sediment infill (topography-corrected) is locally isostatically compensated, this residual surface should be zero. Positive values of the residual surface
mean that an extra force, not related to the sediment loading, pulls the plate downwards, whereas negative values are indicative of a force that is pushing it upwards. The residual surfaces we obtained are plotted in Figs 4(b) and (c).
(a)
(b)
(c)
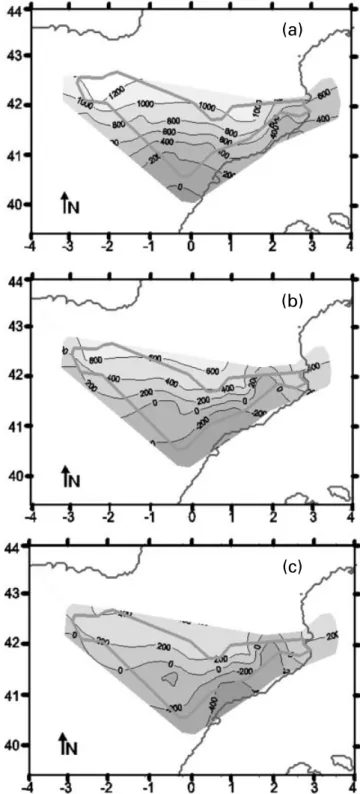
Figure 4. Contour maps of subsidence values derived from well data (Lanaja 1987). The contour interval is 200 m. The residual surface (RS) is defined as follows: residual surface=air-loaded subsidencextopography. Zero RS values imply that the sediment infill (topography-corrected) is locally isostatically compensated, positive RS values imply that an extra force is pulling the plate downwards, and negative values imply that a force is pushing it upwards. (a) Air-loaded (i.e. resulting from the back-stripping, without topographic correction); (b) residual with compaction; (c) residual without compaction (constant sediment density).
The general trend of northward-increasing values indicates the presence of a lithospheric-scale load that is deflecting the plate downwards, suggesting that the lithosphere compensates for it in a flexural mode. The ultimate cause of this trend is probably related to the Pyrenean orogenic wedge. We do not find any evidence supporting an alternative explanation of this result in terms of lithospheric deformation mechanisms, such as extension and/or asthenospheric upwelling, at least on a regional scale.
Negative and low residual surface values are apparent along the eastern and southern margins of the basin (Fig. 4b). They might be explained as a consequence of tectonic uplift induced by crustal stretching during the development of the Valencia Trough.
We also calculate the subsidence due to local isostatic com-pensation of sediment fill (topography-corrected) adopting zero compaction for sediments, in order to discern whether or not this parameter has a significant effect on the basin. The result-ing residual surface (Fig. 4c) shows lower (absolute) subsidence values and lower gradients. Thus, in the more realistic case in which compaction of the sediments is included (Fig. 4b), addi-tional loads, other than sediment fill (topography-corrected), are required to obtain a good match to the observed basement deflection.
These simple isostasy analyses suggest that the observed subsidence in the Ebro Basin is not caused solely by means of local isostasy with constant sediment density. A regional (flexural) mode of compensation appears to be more applicable in the specific case of the Ebro Basin and its surroundings, maybe with the exception of the southern central Ebro Basin. In this sense, our approach differs from some previous works which assumed local isostasy (Zeyen & Ferna`ndez 1994; Verge´s et al. 1998).
Hence, in the Ebro Basin region a 3-D analysis will be applied, including a regional flexure algorithm with sediment compaction correction. In respect of the latter, our approach contrasts noticeably with previous models (Desegaulx & Moretti 1988; Zoetemeijer et al. 1990).
4 F L E X U R A L M O D E L D E S C R I P T I O N A N D M E T H O D O L O G Y
4.1 Flexural model description
The model used in this study is based on a numerical solution of the 3-D thin elastic plate equation (considering the calcu-lated deflection itself as the third dimension; Van Wees & Cloetingh 1994). It can incorporate loads at the nodes, sub-sidence due to stretching, sediment compaction correction, and lateral variations in effective elastic thickness (Te) and depth of
necking (zn). This model has been tested by analytical solutions
(Van Wees & Cloetingh 1994) and successfully applied to real cases (Van Wees & Cloetingh 1994, 1996; Van Wees et al. 1996). Thus we consider that the lithosphere behaves as an elastic plate, the thickness of which is the so-called effective elastic thickness (Te). Teis a measure of the rigidity (D) of the plate.
For a plate with Poisson’s ratio n, and Young’s modulus E, D and Teare related as follows:
D¼ ET3
e=½12ð1 ÿ l2Þ : (1)
The relation between Te and the strength of the lithosphere
is not so simple (Burov & Diament 1995), although, generally
speaking, high values of Teare associated with strong (normally
cold and old) lithosphere, whereas low values are associated with weak (usually warm and young) lithosphere. Although this norm holds for oceanic lithosphere, there are some deviations from the rule for continental lithosphere (Watts 1992), for example due to the presence of horizontal stress fields (Cloetingh & Burov 1996). Nevertheless, Burov & Diament (1995) suggest a method to derive the Teof a non-purely elastic lithosphere
from yield strength envelopes. In Section 5.3 we discuss this subject further.
In our model, the top of the elastic plate corresponds to the top of the basement; that is, the base of Tertiary sediments in the Ebro Basin (since we study the period of foreland sedi-mentation in the Ebro Basin and syn- and post-rift sediment-ation in the Valencia Trough). Hence the subcropping Mesozoic sediments in the Ebro Basin are considered as basement for the flexural calculations, although they are assigned sediment densities in the surrounding outcropping areas (e.g. Iberian Range, southern Pyrenees and Catalan Coastal Ranges).
The initial (pre-orogenic) configuration of the model is an undeformed, horizontal plate with neither topography nor bathymetry. Thus the model ignores the Mesozoic Pyrenean rift structure, and the associated subsidence at those times in the present location of the Pyrenees (Puigdefa`bregas & Souquet 1986).
In our approach, no in-plane horizontal stresses are applied. The effect of such stresses would be to produce vertical move-ments, leading to a deepening of the foreland in the vicinity of mountain belts and uplift on the forebulge (Cloetingh et al. 1985). However, the effects of horizontal forces on the bending behaviour of an undeformed strong elastic plate are modest, of the order of a few hundred metres (Turcotte & Schubert 1982; Burov & Diament 1995). The incorporation of horizontal stresses is necessary to study rapid and specific phases of subsidence (uplift), but in the context of our modelling approach they are a second-order effect. For this reason, and because the maximum horizontal present-day stress orientations in the study area are not uniform (Delouis et al. 1993; Jurado & Mu¨ller 1997; Schindler et al. 1998; Goula et al. 1999), we opted to exclude this parameter at this stage of our modelling study.
4.2 Modelling methodology
The space created between the observed topography and the deflected basement once the loads are applied is the accom-modation space, which is filled in with sediments. We consider that these sediments have the same grain density all over the modelled region, and that they are subjected to compaction. Because this assumption underestimates the density in the zones where the crystalline basement crops out (i.e. no or negligible porosity in the rock; see location in Fig. 5b), we add a differential load (Dq) to compensate it (the additional load in Fig. 5a). The value of this load is
*q¼ ÿgwðocrustÿ osedÞ , (2)
where g=9.8 m sx2 is the gravitational acceleration, w the
distance from the surface of the observed topography to the top of the deflected plate, and (rcrustxrsed) the difference between
the crustal and sediment densities (see Table 1).
We set the distance between nodes to 5 km, which implies a high bandpass filter that enhances the most significant features
at a large scale. Since the seismic lines (ECORS Pyrenees Team 1988; Bera´stegui et al. 1993) clearly show that the lithosphere beneath the Pyrenees is not continuous because the Iberian plate is thrusted under the European plate, we choose a broken plate model to reproduce the structure of this area. We tested this hypothesis with our model by setting the Te value to
zero for the European lithosphere and obtained satisfactory results. Therefore, we use for Iberia an elastic plate with a free boundary located beneath the Pyrenees (Figs 2 and 5b).
We initially proceed by applying different loads to the plate and calculating its deflection. The calculated deflection (c) will be compared with the well interpolated surface (Fig. 6), which is the actual geometry of the top basement surface that results from the interpolation of data points collected from wells and cross-sections (Ca´mara & Klimowitz 1985; Lanaja 1987; Clavell et al. 1988; Bera´stegui et al. 1993; Verge´s 1993; Teixell 1996; Mun˜oz-Jime´nez & Casas-Sainz 1997; Verge´s et al. 1998; Sa´nchez et al. 1999), once the topographic correction (z) has
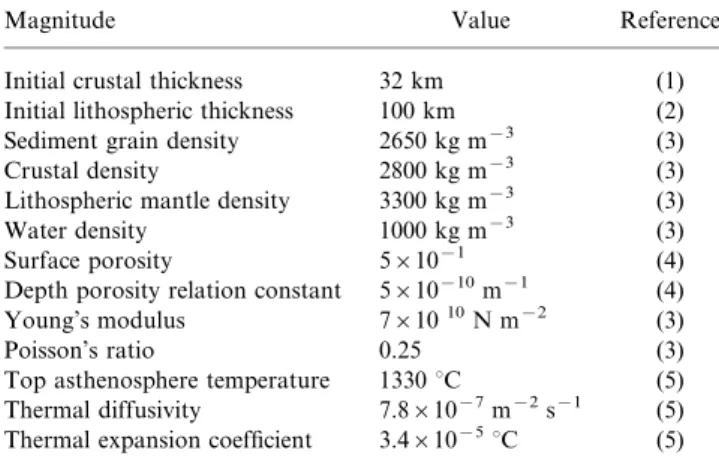
Table 1. Model parameters.
Magnitude Value Reference
Initial crustal thickness 32 km (1)
Initial lithospheric thickness 100 km (2)
Sediment grain density 2650 kg mx3 (3)
Crustal density 2800 kg mx3 (3)
Lithospheric mantle density 3300 kg mx3 (3)
Water density 1000 kg mx3 (3)
Surface porosity 5r10x1 (4)
Depth porosity relation constant 5r10x10mx1 (4)
Young’s modulus 7r1010N mx2 (3)
Poisson’s ratio 0.25 (3)
Top asthenosphere temperature 1330uC (5)
Thermal diffusivity 7.8r10x7mx2sx1 (5)
Thermal expansion coefficient 3.4r10x5uC (5)
(1) Banda (1988); (2) Pino & Helmberger (1997); (3) Turcotte & Schubert (1982); (4) Sclater & Christie (1980); (5) Van Wees et al. (1996).
Figure 5. (a) Schematic diagram showing the main modelling features. The plate of thickness Teflexes due to tectonic/topographic and subsurface
(M, F) loads applied at the free boundary of the plate, creating sediment accumulation space. Topographic (z) and well (w) data are used to constrain the calculated deflection c. When equality (c=wxz) holds, the parameters used in the calculated deflection surface c are satisfactory. z=elevation; c=calculated deflection; w=well-interpolated surface (Fig. 6); M=bending moment; F=shear forces at the broken, free plate boundary; Te=effective elastic thickness. (b) Morpho-tectonic map of NE Iberia, highlighting the most important features pertinent to our modelling (from
Riba et al. 1983; Losantos et al. 1989) and showing data locations. Only main faults concerning this work are depicted. C.I.: Columbretes Islands; C.C.R.: Catalan Coastal Ranges; G: La Garrotxa; N: Navarra; R: La Rioja.
been applied (Fig. 5a). Mathematically this is formulated as
d¼ c ÿ ðz ÿ wÞ , (3)
where d is the deviation or the difference between the two surfaces. When these two surfaces coincide, or in other words when the deviation d is zero, a perfect fit is achieved. Obviously, this approach only works onshore. For offshore areas, the bathymetry has to be considered with the proper density modification (rwaterinstead of rsed). Taking into account the
uncertainties in well data and model parameters, we consider that a deviation of less than 1000 m provides a satisfactory result. Values for parameters used in the model are listed in Table 1.
The Neogene extensional event in the Valencia Trough is also incorporated in our model. The stretching model is based on that of Royden & Keen (1980), which is a variation of the model of McKenzie (1978), by taking different stretching factors for the lithospheric mantle (bm) and the crust (bc). Our
model also includes the level of necking (zn), which is defined
as the level that would remain horizontal during extension in the absence of isostatic forces. Thus, this parameter controls the flexural response of the lithosphere during extension (Braun & Beaumont 1989; Kooi et al. 1992).
We ran the model with these loads to find the suitable parameter values and analyse the validity of our hypotheses. We repeated a trial-and-error sequence, changing the initial parameters or the set of loads, until we obtained a good fit. Results of our study are presented in the next section.
5 R E S U L T S A N D D I S C U S S I O N
The relative importance of the individual entities loading the elastic plate, as well as their spatial extents, are discussed
below. We give both qualitative and quantitative estimates of the parameters involved in the modelling, and reveal the limitations of our study. A flexural model with variable Teand
vertical forces at the free boundary of the (broken) plate yields a satisfactory result.
5.1 Topographic loads
The first inference from the flexural analysis of the present-day situation is the differentiation of two domains of flexural lithospheric response, namely the Ebro Basin and the Valencia Trough domains. The domains interfere in the Catalan Coastal Ranges and the eastern part of the Ebro Basin.
Topographic loading effects exerted on the Ebro Basin are mainly related to the Pyrenees and the Iberian Range; the Catalan Coastal Ranges have a minor effect on the basement deflection of the Ebro Basin, influencing only its eastern margin. Thus, the bending of the plate caused by the topo-graphic loads is directed approximately SSW–NNE. This result is partly due to the nature of our analysis. By using a large-scale modelling approach we are unable to discern local or short-wavelength features, and thus underestimate the load of the Catalan Coastal Ranges (see also Zeyen & Ferna`ndez 1994; Waltham et al. 2000). A more detailed version of the model may overcome this defect (see Section 5.4). On the other hand, the topographic loading exerted by the Pyrenees and the Iberian Range is much larger than the one exerted by the Catalan Coastal Ranges, which implies that the effects of the former dominate over the effect of the latter.
Initial tests and modelling predictions indicate that low Te
values fit better in the southern and western regions than in the northern and eastern parts of the Ebro Basin and southern
Figure 6. Well-interpolated surface, or depth contour map of top basement (base of the Tertiary) derived from well data (Lanaja 1987) and seismic/ structural cross-sections (Ca´mara & Klimowitz 1985; Clavell et al. 1988; Bera´stegui et al. 1993; Verge´s 1993; Teixell 1996; Mun˜oz-Jime´nez & Casas-Sainz 1997; Verge´s et al. 1998; Sa´nchez et al. 1999). Notice double vergence of the flexural basement in the southern Ebro Basin and in La Rioja (western margin). The map is blanked in those areas in which (1) the top basement is deformed by basement-involved thrusts (southern region) and therefore cannot be considered as flexural basement; and (2) an adequate database is lacking (southern and western boundaries). Thus, modelling results in these blanked areas should be taken with caution. For the shake of clarity, a validity boundary (dot-dashed line) which separates blanked and non-blanked areas is depicted in the subsequent figures. Contour lines to depth of basement are at intervals of 500 m.
Pyrenees (Fig. 7). However, the wavelength of the resulting deflection is not large enough to reproduce the configuration of the basement top, regardless of the selected effective elastic thickness. This means that the topographic load itself is not capable of accounting for the observed deflection.
In the next section, we show that the incorporation of extra loads into the model, such as subsurface loads acting on the free boundary of the broken plate, is essential in order to reproduce the configuration of the top basement with the appropriate wavelength.
5.2 Subsurface loads
The next step in our study is the inclusion of a subcrustal load distributed along the free boundary of the broken plate in order to fit the flexure of the plate. This line load (along-strike) represents the cumulative effects of, for example, bending moments, slab pull or buoyancy forces arising from the presence of buried anomalous-density bodies (Sheffels & McNutt 1986; Royden 1993).
The effect of this load along the northern boundary of the plate enhances the SSW–NNE basement deflection trend discussed in Section 5.1, and reproduces satisfactorily the wavelength of the flexed basement.
The values we obtain for the line load that provide the best results are between x1r1012
and x3r1012
N mx1 (minus sign denotes downward-directed), increasing from the
western region, where the subduction process is less developed (e.g. Verge´s et al. 1995), to the central and eastern regions. These values are slightly higher than those obtained by Brunet (1986) and Milla´n et al. (1995).
The origin of this subcrustal load in the Pyrenees is related to down-pulling forces exerted by the cold Iberian plate that underthrusts the European lithosphere (Brunet 1986; Beaumont et al. 2000; Puigdefa`bregas et al. 1992). According to several authors, only Iberian continental lower crust and mantle– lithosphere were involved in the underthrusting process (Chery et al. 1991; Mun˜oz 1992; Beaumont et al. 2000; Ledo et al. 2000). Recent geophysical studies image this slab down to depths of 80–100 km (Souriau & Granet 1995; Pous et al. 1995b; Ledo et al. 2000). Simple calculations relating the line load required in our model (x1.5r1012
Nmx1) to these geometrical constraints (slab 90 km long and 20–50 km thick, depend-ing on the amount of lithospheric material involved in the process), allow us to infer average density contrasts between the underthrusted body and the surrounding lithospheric material of about Dr#85 kg mx3(for a thickness of 20 km) and Dr#35 kg mx3 (for a thickness of 50 km). Given the continental nature of the underthrusted Iberian lithosphere, simply considering a crustal slab would lead to the existence of an upward-directed buoyancy force. Therefore, the presence of high-density bodies located at upper crustal levels (Torne´ et al. 1989), as well as European mantle elements lying on the Iberian crust (Milla´n et al. 1995), must be taken into account.
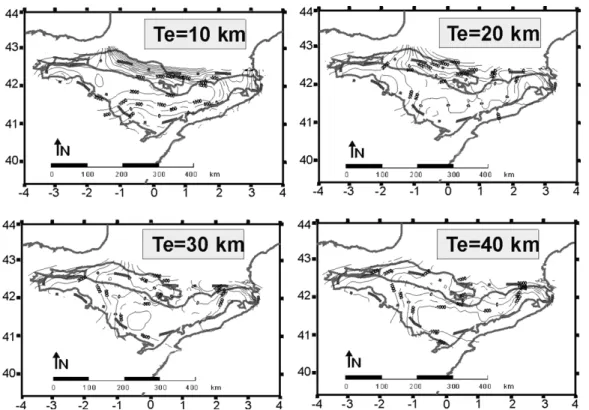
Figure 7. Modelling results for a broken plate with various (constant) Tevalues (10, 20, 30, 40 km) and a line load ofx2r1012N mx1at the
northern edge. Rifting in the Valencia Trough is neglected. The deviation dis represented [eq. (3): d=cx(zxw), where z=elevation (positive) or bathymetry (negative), c=calculated deflection (negative below reference level), and w=well-interpolated surface non-topography-corrected (positive)]. Positive d values indicate a defect of calculated load, and negative d values indicate an excess of calculated load, both with respect to the load required to match the observations perfectly. A zero value of d means an exact match between observations and calculations. The best fit is obtained for Tevalues increasing from south (#10 km) to north (#30 km) of the Ebro Basin. The dot-dashed line indicates the validity boundary for
Furthermore, we note that lower crustal material transforms into eclogite at large depths (>70 km), which significantly increases the mean density and eventually reinforces the down-ward force (see Dewey et al. 1993; Bousquet et al. 1997). Such major density transformations within the ‘subducted continental slab’, in conjunction with rheological changes, must interact in order to reach inferred density contrast. For a more process-based approach, the reader is referred to Chery et al. (1991), who carried out a thermomechanical modelling analysis taking into account density variations and various rheologies for the lithosphere.
Once the line load is fixed in our model, we continue by estimating a reasonable value for Te. For almost the whole
Ebro Basin area, relatively high values of Te(Te#20 km) are
derived (Fig. 7), although it is observed that a spatial variation in Tevalues is necessary. For instance, we reach the best fit in
the westernmost part of the basin for values of Tebetween 5
and 10 km, whilst for the central and eastern basin areas and external parts of the Pyrenees, higher values (20–30 km) are required. A trend of increasing values from the central south Ebro Basin to the north Ebro Basin and southern Pyrenees is observed as well. This Tecan be translated into flexural rigidity
(eq. 1) giving a value of D#5r1022
N m (for Te=20 km). This
high rigidity means that the lithosphere in the Ebro Basin area is relatively strong. These values are in agreement with previous model results for the northern part of the basin (Desegaulx et al. 1990; Zoetemeijer et al. 1990; and roughly with Milla´n et al. 1995), although the results for the Pyrenees are more con-troversial. While some authors support low rigidity values in the Pyrenees (Brunet 1986; Milla´n et al. 1995; Beaumont et al. 2000), others find high rigidities (Desegaulx et al. 1990; Zoetemeijer et al. 1990), in accordance with our results.
The decrease in rigidity towards the southwestern basin margin (Fig. 7) could be associated with zones of crustal weak-ness resulting from several stages of extensional and com-pressional deformation along the Iberian Range, including the reactivation and inversion of main faults during Cenozoic inver-sion movements (Salas & Casas 1993; Van Wees & Stephenson 1995). Furthermore, the presence of thrusts (including blind ones) might account for local discrepancies (Zoetemeijer et al. 1990). The same reasoning could be applied to the western-most part of the basin (La Rioja), where important thrusts bound the basin, which in this region is quite narrow (Mun˜oz-Jime´nez & Casas-Sainz 1997). For the northeastern basin edge (La Garrotxa) the previous considerations do not hold. Here, Neogene to Quaternary volcanism and related fault activity have drastically weakened and thinned the lithosphere (Saula et al. 1994; Cabal & Ferna`ndez 1995). For this reason, low values of Teare more realistic for this particular zone.
In summary, for the study region, modelling predictions clearly point to a loading mechanism dominated by topo-graphic loads in combination with variations of Te(increasing
from the Iberian Ranges towards the external areas of the Pyrenees) and subsurface loads at the northern plate edge.
Discrepancies with previous models that exclude subsurface loads (Desegaulx & Moretti 1988; Zoetemeijer et al. 1990) could be attributed to such causes as (1) the application of higher densities (or density contrasts) in basins, resulting in a larger topographic load which causes regional down-flexing of the lithosphere; and (2) a former lack of deep data constraining the flexural basement deflection beneath the external Pyrenees, leading to the exclusion of those parts of the plate where
the basement is significantly deflected. Therefore, the proposed basement geometry was unrealistically flat, and did not require an extra vertical, downward-directed load.
5.3 Spatial variations on effective elastic thickness Following the inferences of our previous modelling predictions, we include in our modelling lateral variations in Tein order to
improve the results. Teof continental lithosphere is a function
of various interdependent factors, such as rheological para-meters, geometry of the lithospheric plate and subsurface loads, including bending moments or forces caused by density con-trast. Several studies have addressed these relationships (see, for example, McNutt et al. 1988; Burov & Diament 1995; and Section 4). In summary, it can be established that Teis related
to two main observables, namely (1) the curvature of the plate (related to, for example, bending moments, dip of the plate) and (2) the surface heat flow (related to lithospheric thermal age), both in an inverse relation.
Concerning the Ebro Basin domain, our previous modelling investigations predict an increase in Te from south to north
(Fig. 7). However, the curvature is higher in the southern Pyrenees than in the Ebro Basin, with the exception of curvature relative maxima in La Rioja and La Garrotxa (western and northeastern Ebro Basin, respectively). This trend would not be expected from the aforementioned Te dependence on the plate
curvature.
We also analysed the possible relationships between the thermal regime and Te. As shown in the heat flow map of Iberia
(Ferna`ndez et al. 1998), some areas of NE Iberia are charac-terized by important spatial variations in surface heat flow (see also Cabal & Ferna`ndez 1995). A general decrease in heat flow values from the Ebro Basin towards the Pyrenees is recognized. Ferna`ndez et al. (1998) interpreted these heat flow lateral changes as related to variations in lithospheric thick-ness. Likewise, Zoetemeijer et al. (1990) correlate this heat flow pattern with lateral changes in lithospheric rigidity and corres-pondingly Te (higher Te in the orogen than in the basin).
Interestingly, it thus appears that our data show an inverse correlation between plate curvature and surface heat flow data. In the Valencia Trough domain, the lithosphere is rather weak as it underwent intense rift-related thinning and heating during Late Oligocene-Early Miocene times. This is reflected by high heat flow values (Ferna`ndez et al. 1998). For this reason, low Te values are expected in this region, as previously
proposed by Watts & Torne´ (1992) and Janssen et al. (1993).
5.4 Stretching in the Valencia Trough
Although this study does not aim to analyse the flexure of the lithosphere in the Valencia Trough, we incorporate this mode of deformation in order to investigate the possible effects of extension in the Valencia Trough on the Ebro Basin.
We find that deflection in the Valencia Trough domain due to the topographic loads discussed above (Section 5.1) turns out to be of secondary importance when extension is considered. The removal of lithospheric material and its substitution by sediments and asthenospheric material with a different density dramatically changes the system of loads. In this case there are two new model parameters that control the dynamics of the lithosphere beneath the Trough: (1) the distribution and amount of lithospheric thinning (i.e. map of stretching factors);
and (2) the depth of the necking level (defined in Section 4). We take the level of necking as a free parameter, although we expect it to be not very shallow, in order to produce the observed rift flank uplift, and not very deep, in order to avoid extremely large values of subsidence (Kooi et al. 1992).
The choice of the limits of the areas to which stretching factors are applied is crucial. In general, the closer we choose the boundaries of the thinned area (i.e. bc=1, bm=1) to the
centre of the Ebro Basin, the larger the effect on the flexure beneath the Ebro Basin. First, estimates of stretching factor values are taken from the literature: bc factors, of crustal
stretching, derived from seismics by Collier et al. (1994) and Roca (2000); and bmfactors, of lithospheric mantle stretching,
from flexural 2-D modelling (Watts & Torne´ 1992) and gravity and geoid modelling (Ayala et al. 1996). Although the maps from Collier et al. (1994) do not show that lithospheric thinning extends onshore, we set the boundary bc=1 beneath the Catalan
Coastal Ranges, according to geological and geophysical data (Roca & Guimera` 1992; Vidal et al. 1997). In order to obtain a good fit, these stretching factor values need to be modified, although their distribution pattern (i.e. high values on the axis and gradual decrease towards the Iberian margin) is not altered. Since the lithosphere of the Valencia Trough was strongly affected by the Late Oligocene–Early Miocene rifting phase and is very thin on its axis, low values of Teare expected (Watts
& Torne´ 1992; Janssen et al. 1993), and local isostasy would be a reasonable assumption for the centre of the basin, but not for its flanks (Negredo et al. 1999). In our modelling we set Te
between 0 and 15 km for this region.
To validate parameters applied in our modelling, we expect to find an uplift of the Catalan Coastal Ranges of a few hundred metres, and in the centre of the basin a depth to basement (top of pre-rift sediments) of 4–6 km. However, it must be realized that the rifting model we used (based on Royden & Keen 1980) assumes instantaneous initial stretching and therefore no syn-rift cooling of the basin. Such a model can lead to an overestimate of the total subsidence by about 16–20 per cent (e.g. Jarvis & McKenzie 1980). This could be the case for the Valencia Trough, in which the initial tectonic sub-sidence phase lasted some 8.5–12 Myr and gave way to thermal subsidence around Late Burdigalian–Langhian times (Watts & Torne´ 1992; Roca 2000).
We tested several positions for the bm=1 boundary, various
thinning factor values and lateral variations of the effective elastic thickness. The results are illustrated in Figs 8, 9 and 10. Fig. 8 is constructed by setting bm=bc (=b), and locating
the boundary of the unstretched region (b=1) beneath the Catalan Coastal Ranges, about 10 km from the coast line. We choose a pattern of Tevariations inferred from our previous
modelling predictions. A necking level of 15 km provides the best fit.
Fig. 9 shows a modification of the previous model, by placing the boundary bm=1 within the Ebro Basin, about
60 km from the coast line, in agreement with the modelling predictions of Watts & Torne´ (1992) and Ayala et al. (1996), and retaining the rest of the stretching factors as in Fig. 8. Te
variations are derived in the same way as in the preceding case (Fig. 8). The difference between this model and the previous one is that uplift of the Catalan Coastal Ranges occurs as a result of lithospheric mantle stretching distributed over a broad area including the eastern margin of the Ebro Basin. In this model, the necking depth is lowered to 12 km.
Fig. 10 is a variation of Fig. 8, obtained by applying Te
variations inferred from the heat flow map of Ferna`ndez et al. (1998) by a simple inverse linear relation. Hence we set a relatively high Te for the southern Pyrenees (25–35 km), and
a lower value to the south (20 km). Finally, following several authors (Watts & Torne´ 1992; Negredo et al. 1999), we adopted for the Valencia Trough a relatively low Tevalue (5–15 km).
In this case, we used a depth of necking of 15 km.
The distinct scenarios proposed in Figs 8, 9 and 10 yield satisfactory results in the central and eastern parts of the Ebro Basin and in the Valencia Trough. It is, however, more difficult to obtain a good fit in the western part of the study region.
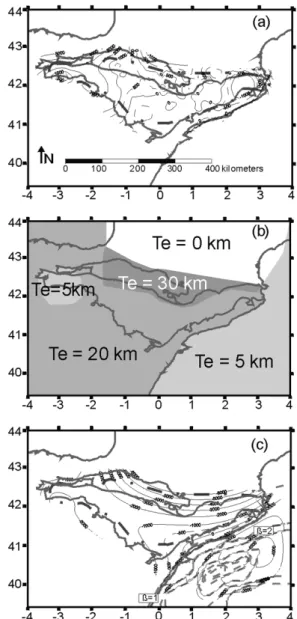
Figure 8. Modelling results for a broken plate with variable Te
values and a line load of x2r1012
N mx1 at the northern edge, including the effect of the Valencia Trough rifting (stretching factors modified from Collier et al. 1994; Roca 2000; and Ayala et al. 1996). (a) Deviation plot (see Fig. 7 for explanation). (b) Temap derived from
modelling predictions. (c) Contour lines of calculated deflection c [contour interval is 1000 m (solid line); 500 m contours lines are also depicted (thin-dashed line in the Ebro Basin)]. Contour lines of stretching factors b (=bm=bc) are plotted as well (dashed lines in
the Valencia Trough area; contour interval is 0.25). Other figure conventions as in Fig. 7.
Despite differences between the various models presented here and the limitations of our approach, this analysis enabled us to further constrain parameters that should be used in modelling the Valencia Trough.
(1) Necking depths shallower than 10 km lead to negligible uplift in the Iberian flank, and depths greater than 20 km result in exaggerated subsidence of the Valencia Trough. Intermediate necking depths are compatible with the observed uplift/ subsidence values. Previous models for the Valencia Trough that include the necking level concept (Janssen et al. 1993) indicate intermediate necking levels in the range of 17–33 km. Our modelling predictions reduce this interval to 10–15 km.
(2) Tevariations in the Valencia Trough are of second-order
importance when lithospheric stretching is incorporated into
the models. In general, low Tevalues (Te<15 km) imply greater
subsidence of the basin axis and greater flank uplift, affecting a narrow area beyond the hinge zone. The reciprocal situation applies to higher Tevalues (Te>25 km).
In the next paragraph we discuss the effects of extension in the Valencia Trough on the Ebro Basin.
5.5 Effects on the Ebro Basin of extensional tectonics in the Valencia Trough
Having constrained the rifting parameters for the Valencia Trough, we proceeded to assess the potential effects of this stretching event on the late evolution of the Ebro Basin.
In this respect, we compared the calculated top basement deflection for a case in which the stretching in the Valencia Trough is included and another in which it is neglected. The difference between the two calculated deflected top base-ment surfaces (Fig. 11), referred to as the differential basebase-ment deflection (calculated deflection excluding extension in the Valencia Trough minus calculated deflection including exten-sion in the Valencia Trough), shows that the incorporation of a stretching event in the model provides an extra basement uplift of the Catalan Coastal Ranges of up to 600 m which extends into the centre of the Ebro Basin and decreases towards the northwest.
This has the following important implications for the structure and evolution of the Ebro Basin.
(1) Superimposed on the regional Pyrenees-related SSW– NNE deflection trend (see Section 5.2), the rift-related base-ment deflection adds a SE–NW tilting component, as observed in the present-day basin configuration (Lewis et al. 2000).
(2) This rift-related uplift involved Ebro Basin sedimentary sequences accumulated prior to and during the opening of the Valencia Trough (Late Oligocene times). This new configuration has major repercussions on the erosional pattern of the Ebro Basin. The larger amount of erosion in the eastern Ebro Basin could be related to this uplifting, as well as to the evolution of the drainage network, which was strongly influenced by sea-level changes in the Mediterranean.
(3) Erosional unloading of the Catalan Coastal Ranges and the eastern part of the Ebro Basin caused unflexing of the lithosphere and uplift of these areas. In the Catalan Coastal Ranges, this second phase of uplift, which may still be going on, is superimposed on their earlier rift-related uplift (flank uplift). Moreover, this combination of upward-directed forces could explain the high elevations observed in the eastern part of the Ebro Basin. At the same time, sedimentary material transferred to the Valencia Trough exerts a downward load that contributes to the subsidence of that area. The large extent of the present Ebro Delta and prograding shelf-talud (Fig. 1) gives an idea of the huge amount of material transported.
Comparison of the differential basement deflection (Fig. 11) with the present-day distribution of outcropping Palaeocene– Late Eocene sequences (Fig. 3c) reveals a remarkable corre-spondence, and, together with points (2) and (3), suggests that there is an intimate link between surface and lithospheric-scale processes in this zone. Local deviations in erosional patterns might be explained as resulting from faulting in the Catalan Coastal Ranges and volcanic activity in their northeastern parts.
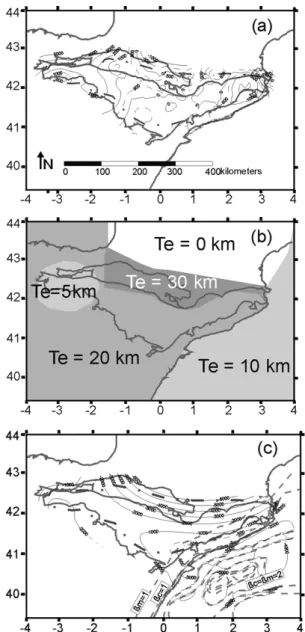
Figure 9. Modelling results for a broken plate with variable Teand a
line load ofx2r1012N mx1at the northern edge, including the effect
of the Valencia Trough rifting (stretching factors modified from Collier et al. 1994; Ayala et al. 1996 and Watts & Torne´ 1992). (a) Deviation plot (see Fig. 7 for explanation). (b) Temap derived from modelling
predictions. (c) Contour lines of calculated deflection. Notice that contours bm=1 and bc=1 do not coincide. Other figure conventions as
Despite the lack of constraints on some of the para-meters involved, we attempted to understand how this coupled mechanism works. Assuming that a model without stretching represents the pre-rift stage, and a model including
stretch-ing represents the post-rift stage, we obtain an estimate of the amount of material that has been eroded since the beginning of the rifting (Late Oligocene). In this respect, the main uncertainties arise from the lack of knowledge about palaeotopographic
Figure 10. Modelling results for a broken plate with variable Tevalues and a line load ofx2r1012N mx1at the northern edge, including the effect
of the Valencia Trough rifting (stretching factors modified from Collier et al. 1994; Ayala et al. 1996 and Watts & Torne´ 1992). (a) Deviation plot (see Fig. 7 for explanation). (b) Temap derived from the heat flow map of Ferna`ndez et al. (1998) by a simple linear inverse relation (Te3–heat flow).
(c) Contour lines of calculated deflection. In this case b=bm=bc.Other figure conventions as in Fig. 8.
Figure 11. Contour lines of the differential basement deflection; that is, the surface that results from the subtraction of the calculated deflection in the cases in which the stretching in the Valencia Trough is considered and not considered (calculated deflection excluding the stretching of the lithosphere in the Valencia Trough—calculated deflection including the stretching of the lithosphere in the Valencia Trough). The figure shows that (1) the stretching of the lithosphere in the Valencia Trough affects the eastern Ebro Basin, and (2) the differential uplift predicted as a result of the incorporation of the extensional event in the modelling results in the emplacement of a significant sediment package at elevations above 600 m in the eastern Ebro Basin. Stretching parameters as in Fig. 8. See text for further discussion.
variations during Mio-Pliocene times. If the topography is assumed not to have changed, the contours in Fig. 11 give a direct estimate of the thickness of eroded material. If the topo-graphy was higher during the Late Oligocene–Early Miocene, loading would have been greater, the basement would have been flexed down more, and thus more sediment accommodation space would have been created. Hence, the amount of material eroded during Late Oligocene to Present times, as well as the contemporaneous unflexing of the lithosphere, would have been greater. A similar reasoning could be applied to other situations where there is an important interference between tectonic and surface processes.
In summary, although the structure and development of the Ebro Basin were dominated by the emplacement and evolution of orogen-related topographic loads (within and outside the basin) and subcrustal loads, extension in the Valencia Trough had an important effect as well. This feature, which is particularly noticeable when the patterns of sedimentation and erosion are analysed, marks a major difference between the Ebro Basin and many other foreland basins.
6 C O N C L U D I N G R E M A R K S
Observations on the main morpho-tectonic features of NE Iberia and an analysis of key periods of its geological evolution demanded a 3-D model of this region, the results of which point towards large-scale phenomena that governed the Cenozoic evolution of the lithosphere.
On the basis of isostasy analyses, we showed that a flexural style of isostatic compensation is better able to explain lithospheric-scale phenomena as observed in the study region than local isostasy.
These considerations justified studying the Ebro Basin and surrounding areas in their large-scale tectonic setting. How-ever, it must be kept in mind that the results of such a study are biased by the nature of the method adopted. Thus, the effects of short-wavelength features, such as normal faulting in the Catalan Coastal Ranges associated with the extension in the Valencia Trough domain, thrusting along the boundaries of the Ebro Basin or stacking of Palaeozoic basement units in the Pyrenean axial zone, are difficult to recognize as they com-pete with other large-wavelength phenomena, such as flexure of the lithosphere due to tectonic loading (Fig. 4). This aspect is evident in the vicinity of the Pyrenean region. There, we are unable to achieve the degree of detail that other smaller-scale studies (i.e. those that focus on finer aspects over smaller areas) do (Beaumont et al. 2000; Waltham et al. 2000), and we obtain higher rigidity values. Even clearer examples of this are found at the limits of the basin, where local tectonics perturbs general trends (La Rioja and La Garrotxa regions; see Section 5.2.).
A particular effort was made to analyse the significance of short-wavelength features in northeastern Iberia by incor-porating lateral variations in effective elastic thickness, and therefore improving the accuracy of our predictions at smaller scales.
Our 3-D large-scale numerical modelling study of thin, elastic plate flexure allows us to draw the following conclusions.
(1) The topographic and tectonic loading effect (within both basins and mountain belts) cannot account for the whole of the observed basement deflections over the entire area addressed by this study, implying the requirement of a subsurface load
at the northern, broken boundary of the plate. The basement of the Ebro Basin is deflected in a SSW–NNE direction, with increasing dip towards the Pyrenees, probably partly in response to the load exerted on it by the subducted continental Iberian lithosphere.
(2) The lithosphere in the Ebro Basin is relatively strong, the flexural rigidity being about D# 5r 1022
N m. Values of the effective elastic thickness range around 20 km (generally increasing from south to north). Lower values found along the southwestern basin margin are probably related to weakness zones inherited from Mesozoic rifting and local anomalies produced by thrusting. In general there is a good (inverse) correlation between the heat flow and the effective elastic thickness of the lithosphere.
We have shown that the choice of a purely elastic rheology at this stage is a good first-order approximation, suitable for a large-scale study. To understand the discrepancies between the theoretical and predicted Te–curvature dependence, and show
whether the variations in rigidity can be attributed to flexural yielding, heat flow variations, or a combination of these mech-anisms, it will be necessary to incorporate a multilayered rheology using the concept of yield-strength envelopes (Burov & Diament 1995), and to integrate thermal field calculations, faulting and horizontal stresses (e.g. Van Balen et al. 1998; Cloetingh et al. 1999), which so far has not been implemented in three dimensions.
Our modelling study also includes the effects of the litho-spheric extension in the Valencia Trough. According to previous studies and our modelling inferences, we propose two scenarios to explain the observed uplift of the Catalan margin and the subsidence of the Valencia Trough. One possible scenario is that thinning of the lithosphere is restricted to areas seawards of the Catalan Coastal Ranges (Figs 8 and 10). The alternative scenario implies that thinning of the lithosphere extends westwards beneath the Ebro Basin (Fig. 9). Both hypotheses point to an intermediate or low necking level of 10–15 km.
We have shown that rifting of the Valencia Trough affected the Ebro Basin (Fig. 11), controlling both the extent and magnitude of uplift of its eastern parts, thus underlining the requirement to analyse its 3-D setting and conferring on this event a primary role in the late evolution of the Ebro Basin. Rift-related deflection of the lithosphere interferes in the eastern Ebro Basin with the typical flexural foreland basin configuration. Moreover, our results reveal a certain degree of coupling between surface processes (erosional patterns) and tectonic processes (differential uplift induced by the stretch-ing phase in the Valencia Trough). Again local deviations of the erosional pattern close to the Catalan Coastal Ranges can be attributed to low-wavelength upper crustal flexural effects (Zeyen & Ferna`ndez 1994; Waltham et al. 2000), such as normal faulting and Plio-Pleistocene volcanism.
The future development of more detailed 3-D models, including the full interplay between surface and tectonic pro-cesses (Burov & Cloetingh 1997), could contribute towards a better understanding of this subject.
A C K N O W L E D G M E N T S
This paper is contribution number 20000901 of the Netherlands Research School of Sedimentary Geology (NSG). This work has been partially financed by (1) the Earth and Life Sciences