Discrete cytosolic macromolecular BRAF complexes
exhibit distinct activities and composition
Britta Diedrich
1,2,‡, Kristoffer TG Rigbolt
1,2,†,‡, Michael Röring
3,‡, Ricarda Herr
3, Stephanie
Kaeser-Pebernard
4, Christine Gretzmeier
1,2,5, Robert F Murphy
5,6, Tilman Brummer
2,3,7,8,9,*,§&
Jörn Dengjel
1,2,4,5,7,§,**Abstract
As a central element within the RAS/ERK pathway, the serine/thre-onine kinase BRAF plays a key role in development and homeosta-sis and represents the most frequently mutated kinase in tumors. Consequently, it has emerged as an important therapeutic target in various malignancies. Nevertheless, the BRAF activation cycle still raises many mechanistic questions as illustrated by the para-doxical action and side effects of RAF inhibitors. By applying
SEC-PCP-SILAC, we analyzed protein–protein interactions of
hyper-active BRAFV600Eand wild-type BRAF (BRAFWT). We identified two
macromolecular, cytosolic BRAF complexes of distinct molecular
composition and phosphorylation status. Hyperactive BRAFV600E
resides in large complexes of higher molecular mass and activity,
while BRAFWTis confined to smaller, slightly less active complexes.
However, expression of oncogenic K-RasG12V, either by itself or in
combination with RAF dimer promoting inhibitors, induces the
incorporation of BRAFWT into large, active complexes, whereas
pharmacological inhibition of BRAFV600E has the opposite effect.
Thus, the quaternary structure of BRAF complexes is shaped by its activation status, the conformation of its kinase domain, and clinically relevant inhibitors.
Keywords 14-3-3 proteins; geldanamycin; HSP90 CDC37 complex; sorafenib; vemurafenib
Subject Categories Molecular Biology of Disease; Signal Transduction
Introduction
The ARAF, BRAF, and CRAF kinases play a central role in physio-logical and pathophysio-logical conditions by controlling cell fate decisions such as proliferation, differentiation, and survival. BRAF is the most frequently mutated kinase in tumors with particularly high frequen-cies in low-grade astrocytoma, melanoma, and hairy cell leukemia (Ro¨ring & Brummer, 2012; Samatar & Poulikakos, 2014). Further-more, BRAF mutant colorectal carcinoma (CRC) with microsatellite stability represents the most aggressive sub-entity (see Herr et al, 2015 and references therein).
Consequently, BRAF has become an important therapeutic target in cancer (Holderfield et al, 2014; Turski et al, 2016), with other proliferative diseases such as RASopathies and polycystic kidney disease potentially following suit, as it has been suggested by animal models (Inoue et al, 2014; Chang et al, 2015). The clinically most advanced compounds, vemurafenib or dabrafenib, as well as the first RAF inhibitor sorafenib are ATP competitive drugs. Indeed, vemurafenib and dabrafenib have significantly improved the
treat-ment options for metastatic melanoma harboring BRAFV600E/K
muta-tions (Chapman et al, 2011; Hauschild et al, 2012) and similar outcomes may be achieved in other malignancies driven by BRAFV600Esuch as hairy cell leukemia (Dietrich et al, 2016).
Never-theless, even initially responding BRAF mutant melanomas acquire drug resistance (Moriceau et al, 2015). Moreover, other tumor enti-ties such as CRC do not display such uniform responses due to primary resistance caused by rapid reactivation of the EGFR path-way (Corcoran et al, 2012; Prahallad et al, 2012). This insight led to the development of clinical trials combining multiple targeted therapy compounds.
1 Department of Dermatology, Medical Center - University of Freiburg, Freiburg, Germany 2 ZBSA Center for Biological Systems Analysis, University of Freiburg, Freiburg, Germany
3 Faculty of Medicine, Institute of Molecular Medicine and Cell Research (IMMZ), University of Freiburg, Freiburg, Germany 4 Department of Biology, University of Fribourg, Fribourg, Switzerland
5 Freiburg Institute for Advanced Studies (FRIAS), University of Freiburg, Freiburg, Germany
6 Computational Biology Department and Department of Biomedical Engineering, Carnegie Mellon University, Pittsburgh, PA, USA 7 Centre for Biological Signalling Studies BIOSS, University of Freiburg, Freiburg, Germany
8 Comprehensive Cancer Centre, Freiburg, Germany
9 German Cancer Consortium (DKTK), partner site Freiburg, and German Cancer Research Center (DKFZ), Heidelberg, Germany *Corresponding author. Tel: +49 761 2039610; E-mail: [email protected]
**Corresponding author. Tel: +41 26 300 8631; E-mail: [email protected]
‡These authors contributed equally to this work (first authorship) §These authors contributed equally to this work (senior authorship) †Present address: Gubra, Hørsholm, Denmark
http://doc.rero.ch
Published in "The EMBO Journal 36(5): 646–663, 2017"
which should be cited to refer to this work.
Indeed, many of the recently documented inhibitor resistance mechanisms can be linked to the intricate feedback regulation of the ERK pathway (Sturm et al, 2010; Fritsche-Guenther et al, 2011; Lito et al, 2012) and the paradoxical behavior of RAF inhibitors (Hatzivassiliou et al, 2010; Heidorn et al, 2010; Poulikakos et al, 2010). Although the precise mode of action is still under debate, the latter phenomenon relies on the presence of active GTP-loaded RAS and the formation of BRAF homo- or heterodimers (Ro¨ring & Brummer, 2012; Lavoie & Therrien, 2015). Based on the observation that an intact dimer interface (DIF) is required for the paradoxical action of kinase-inhibited BRAF molecules (Ro¨ring et al, 2012), it can be anticipated that binding of the inhibitor to one RAF molecule locks this protomer into a conformation in which it can transactivate the drug free protomer of the dimer by an allosteric mechanism.
The paradoxical action of RAF inhibitors is of high clinical relevance as it: (i) precludes the use of selective BRAF inhibitors in RAS mutant tumors highlighting the need to stratify cancer patients prior to drug administration (Holderfield et al, 2014; Samatar & Poulikakos, 2014), (ii) contributes to acquired drug resistance, for example, by positively selecting tumor cells with secondary muta-tions or amplificamuta-tions in RAS or receptor tyrosine kinase genes (Ro¨ring & Brummer, 2012; Straussman et al, 2012; Ahronian et al, 2015; Moriceau et al, 2015), and (iii) by promoting secondary neoplasms (Callahan et al, 2012; Su et al, 2012; Yaktapour et al, 2014; Carlino et al, 2015; Dietrich et al, 2016). These limitations of RAF inhibitors highlight the need for better understanding of normal and mutant BRAF signaling at the molecular level, in particular of the composition and regulation of BRAF signaling complexes during the activation cycle of the kinase.
Indeed, the BRAF activation cycle remains incompletely under-stood. So far, it has emerged that activation of BRAF is triggered by its interaction with GTP-loaded RAS proteins and is accompanied by changes in its phosphorylation status and protein interaction reper-toire, including the formation of homo- and/or heterodimers (Baljuls et al, 2013; Cseh et al, 2014) and the interaction with the HSP90/CDC37 complex (Jaiswal et al, 1996; Vaughan et al, 2006). The phospho-serine binding proteins of the 14-3-3 family regulate various steps of the activation cycle by either stabilizing the closed, inactive conformation of BRAF, or by promoting dimerization and downstream signaling. This dual role of 14-3-3 is reflected by the observations that alanine substitution of the C-terminal 14-3-3
bind-ing site S729 abolishes BRAF activity (except for BRAFV600E
), whereas that of the N-terminal motif around S365 increases kinase activity (MacNicol et al, 2000; Brummer et al, 2006; Rodriguez-Viciana et al, 2006; Hmitou et al, 2007; Fischer et al, 2009; Ritt
et al, 2010). Furthermore, mutations of the RDRSSS365
AP motif, likely interfering with S365 phosphorylation and/or 14-3-3 binding, have been found in tumors, further highlighting its relevance for negative regulation (Eisenhardt et al, 2016).
Numerous, mostly ill-defined kinases mediate feed-forward and -back phosphorylation of BRAF by upstream activators and down-stream effectors, respectively. For example, wild-type BRAF
(BRAFWT) is stringently controlled by RAS-dependent
phosphoryla-tion-induced conformational change of its activation loop (Zhang & Guan, 2000). This in turn restructures its catalytic center, leading to DIF exposure, allosteric transactivation and ultimately the genera-tion of a fully active BRAF signaling complex (Wan et al, 2004; Hu et al, 2013; Thevakumaran et al, 2015; Ko¨hler et al, 2016). The
most prevalent oncogenic BRAF mutation, V600E, mimics activation loop phosphorylation and locks the kinase in an active conforma-tion by forming a mutaconforma-tion-specific salt-bridge, thereby causing a short-circuit in the activation cycle and leading to chronic MEK/ERK signaling (Wan et al, 2004). Thus, V600E bypasses several steps
required for the activation of BRAFWTsuch as N-region
phosphory-lation, RAS, and 14-3-3 binding and dimerization, but also renders the oncoprotein resistant to negative regulation (Tsavachidou et al, 2004; Emuss et al, 2005; Brummer et al, 2006; Brady et al, 2009; Fischer et al, 2009; Poulikakos et al, 2011; Ro¨ring et al, 2012; Freeman et al, 2013).
The homo- and hetero-dimerization of BRAF is highly relevant for drug action: Firstly, tumor-associated N-terminally truncated BRAF proteins, which have lost large portions of the regulatory regions required for auto-inhibition and consist merely of the kinase domain, display increased activity and homo-dimerization potential. The latter also confers an intrinsic resistance toward vemurafenib and sorafenib. Importantly, these proteins can be re-sensitized to these drugs by a point mutation in the DIF, suggesting that rather the quaternary structure of the BRAF complex than the altered BRAF tertiary structure determines drug binding (Poulikakos et al, 2011; Sievert et al, 2013; Karajannis et al, 2014; Karoulia et al, 2016). To comprehensively study BRAF activation, the rewiring of
protein–protein interactions of BRAFWT and BRAFV600E and their
role in cell transformation and paradoxical ERK activation, we globally analyzed macromolecular, cytosolic protein complexes by a combination of size exclusion chromatography and mass spec-trometry (Kristensen et al, 2012). We characterized discrete macromolecular BRAF complexes of distinct composition. Their differences in activity and interaction partners were linked to altered phosphorylation patterns. Our data show that, in contrast to previous concepts, the interactions of wild-type and oncogenic BRAF with 14-3-3 proteins and the HSP90/CDC37 complex are dynamically regulated, explaining among others the observation that BRAF mutant tumors are sensitive to clinically relevant HSP90 inhibitors, and outlining strategies for combination therapies.
Results
BRAF expression levels do not influence overall protein abundances
To study the influence of BRAF variants on the composition of macromolecular cytosolic protein complexes, we used CaCo-2 subli-nes fitted with a doxycycline (Dox)-inducible expression system of
either hemagglutinin (HA)-tagged BRAFWTor BRAFV600E(Herr et al,
2011; Ro¨ring et al, 2012). These CaCo-2tet cells are derived from a colon adenocarcinoma and lack BRAF or KRAS mutations and thus represent an ideal model system to study CRC-associated oncogenes in the context of colonic epithelium (Herr et al, 2015). Cells were treated with Dox for up to 96 h, and protein abundances were analyzed by immunoblotting (Fig 1A). After 6–12 h, HA-BRAF could be detected and cells responded with an increase in
phospho-MEK and phospho-ERK levels (Fig 1B), with BRAFV600Einducing a
faster response and a differential of more than ninefold. Importantly, MEK levels stayed relatively constant over the timeframe of treat-ment. Interestingly, the differential in MEK/ERK phosphorylation
elicited by BRAFV600Ecompared to BRAFWTbecame less pronounced with increasing induction time. The exact reason for this phenom-enon is unknown, but could be potentially explained by the afore-mentioned feedback phenomena. The reduced Western blot signal of MEK compared to phospho-MEK is due to a phosphorylation-dependent decrease in antibody reactivity (Appendix Fig S1). After 48 h of Dox treatment, BRAF levels were stable, indicating a steady state. This also applied for downstream signaling pathways. There-fore, in all following experiments, oncogene expression was induced for 48 h. The advantage of the CaCo-2tet system is that experiments addressing the influence of potent oncogenes on protein homeostasis can be carried out in an isogenic background. However, overexpres-sion may also lead to artifacts. To exclude that BRAF expresoverexpres-sion globally alters protein abundances, we compared BRAF-expressing cells with vector control cells also being treated with Dox by SILAC-based proteomics (Fig 1C). In total, 1,945 proteins were quantified. BRAF itself was approximately ninefold enriched in the BRAF-expressing cell lines. All other proteins exhibited normal distribu-tions with 95% of proteins showing maximally a twofold difference in abundance. Importantly, abundances of known and novel BRAF interactors identified in this study, like the 14-3-3 and HSP90 proteins, NRAS, KRAS, and MEKs did not differ in cells ectopically expressing HA-BRAF variants (Fig 1D, Appendix Fig S1). Overex-pression of either wild-type or oncogenic BRAF does neither alter global protein abundances nor abundances of proximal up- and down-stream BRAF signaling partners. In that regard, it should be noted that even higher increases in BRAF protein expression occur in response to drug exposure in vitro and in patients, indicating that this degree of overexpression of BRAF in our Caco-2tet system is relevant (Little et al, 2011; Moriceau et al, 2015). Thus, the
influence of BRAFWT
and BRAFV600Eexpression on macromolecular
protein dynamics can be studied in an inducible, isogenic cell system with relevance to colon cancer.
Analysis of cytosolic macromolecular protein complexes by SEC-PCP-SILAC
To comprehensively characterize the global interactome in
HA-BRAFWT
and HA-BRAFV600E-expressing cells, we applied
SEC-PCP-SILAC, which combines native size exclusion chromatography with quantitative proteomics (Kristensen et al, 2012; Kirkwood et al, 2013). CaCo-2tet cells were SILAC labeled and HA-BRAF expression was induced for 48 h by Dox addition (Fig 2A). A mixture of
light-labeled cells expressing BRAFWTand BRAFV600Eserved as a control
to identify cytosolic complexes in heavy-labeled BRAFWT and
medium-heavy-labeled BRAFV600E-expressing cells, respectively.
From the acquired data, the identified proteins engaged in interac-tions are observed as strongly co-eluting (Fig 2B), and by hierarchi-cal clustering (Fig 2C), a landscape of protein interactions and complexes was obtained (Fig 2D; see Materials and Methods for details). We performed three biological replicates with swapped SILAC labels and found a good reproducibility of protein elution profiles between all replicates (Fig 2E; median correlation coeffi-cient of 0.65). Combining the data from all replicates, we extracted 3,739 binary interactions of 555 proteins after stringently filtering the data and requiring the interaction to be observed in at least two replicates (Appendix Fig S2, Dataset EV1; MS raw data can be found in PRIDE DB; Vizcaino et al, 2016, dataset identifier PXD004585).
The inferred interactions could be clustered into 77 clusters representing potential complexes (Dataset EV2; Nepusz et al, 2012).
A
B
C
D
Figure1. Isogenic cell system employed to study the effects of BRAFWT
and BRAFV600Eon the composition of cytosolic macromolecular protein complexes. A The time-dependent effect of HA-BRAFWT(WT) and HA-BRAFV600E(V600E) expression in CaCo-2 cells is monitored by Western blot. Expression of HA-tagged fusion
constructs is induced for the annotated timeframes by the addition of doxycycline (Dox). Effects of oncogene expression are monitored by the abundance of the downstream target sites pMEK and pERK. Vertical line indicates two separately blotted gels.
B Quantifications of blots shown in panel (A) normalized to the GAPDH signal.
C To analyze effects of oncogene overexpression on global protein abundance, SILAC-labeled cells overexpressing WT and V600E are compared to Dox-treated unlabeled vector control cells (ctrl). Histograms highlight detected protein numbers. BRAF is marked in red.
D Abundance differences of known and newly identified BRAF binding partners are shown comparing WT- and V600E-expressing cells with vector control cells. Red line indicates levels in vector control cells. Error bars indicate standard deviation.
Source data are available online for this figure.
Upon inspection, we could reconstitute many of the major cytosolic complexes from the list of observed complexes. This demonstrates that SEC-PCP-SILAC is suitable for obtaining an unbiased overview
of protein–protein interactions (Fig 2F).
BRAFWTand BRAFV600Elocalize to discrete protein complexes
To identify proteins that change their interactions in response
to oncoprotein induction, we compared HA-BRAFWT and
HA-BRAFV600E-expressing cells and plotted the sum of squared
dif-ferences of SEC-PCP-SILAC ratios of three biological replicates (Fig 3A). To our surprise, the protein exhibiting the most robust change across the fractions was BRAF itself. Indeed, SEC-PCP-SILAC
profiles of HA-BRAFWT and HA-BRAFV600E differed tremendously
(Fig 3B). Whereas a large proportion of BRAFV600Elocalized to SEC
fractions 22–26 corresponding to a molecular weight of ~600 kDa
(Appendix Fig S3), the majority of BRAFWTwas found in fractions
38–42, which harbored protein complexes of about 200 kDa. As the
A
D
F
B
E
C
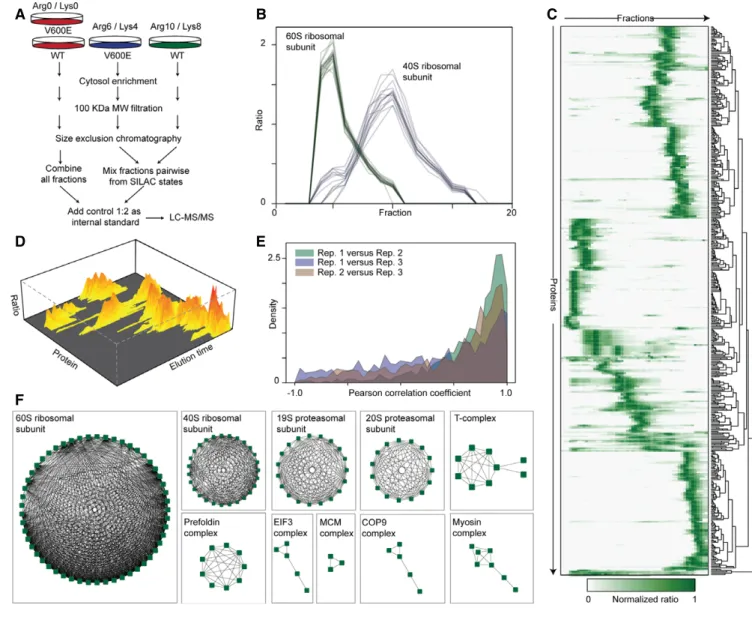
Figure2. SEC-PCP-SILAC workflow and data analysis.
A WT- and V600E-expressing cells are differentially SILAC labeled and lysed. Organelles and nuclei are removed by ultra-centrifugation and the cytosol is filtered. Protein complexes larger than100 kDa are separated by SEC. Fractions are mixed and combined with a light-labeled internal standard (Arg0/Lys0). Prior LC-MS/MS analysis proteins are digested with trypsin.
B SEC-PCP-SILAC elution profiles of60S (green, 26 proteins) and 40S (blue, 21 proteins) ribosomal subunits. Each line represents the elution profile of a specific protein (see Datasets EV1 and EV2 for complete lists).
C Heatmap of normalized SILAC ratios of proteins identified from SEC fractions with each row corresponding to one individual protein. As an example, WT elution data from replicate1 are shown. SILAC protein ratios of WT proteins versus the internal standard were normalized to one, highlighting the relative abundance of a specific protein in all SEC fractions. Rows are hierarchically clustered to show similar eluting protein groups.
D 3D visualization of filtered proteins showing the appearances of protein complexes as hills with proteins of similar intensity in the same fractions grouped together. E Distribution of the Pearson correlation coefficients between the elution profiles for each protein in three biological replicates.
F Network diagrams of selected protein complexes inferred from the data. Edges indicate interactions and nodes indicate single proteins.
elution profiles are stoichiometric, the area under the curve of the
two BRAFV600Ecomplexes indicates that the high molecular weight
(MW) complex contains roughly one-third of cytosolic BRAFV600E
(Appendix Fig S3). In contrast, BRAFWTis present at much lower
levels in the high MW complex (Fig 3B).
This segregation into two distinctly sized BRAF complexes, as defined by size exclusion chromatography, is reminiscent to our previous blue native PAGE (BN–PAGE) experiments showing that BRAFV600E is predominantly located in larger complexes (Ro¨ring et al, 2012). The BN–PAGE approach, however, is very limited when
A
F
K
L
M
G
H
I
J
B
C
D
E
Figure3. WT and V600E localize to discrete macromolecular protein complexes.
A To screen for proteins changing their interactions the differences in CaCo-2tet SEC-PCP-SILAC chromatograms are calculated. Only proteins with a value for the sum of squared difference in all three replicates are considered. BRAF is marked.
B Overlay of SEC elution profiles for V600E and WT in replicate 1 are shown. C–E Overlay of V600E and CDC37 (C), HSP90 (D), or 14-3-3 (E) elution profiles.
F Overlay of SEC elution profiles for BraffloxV600E; Rosa26::CreERT2 MEFs expressing either BRAFWT
(EtOH) or BRAFV600E(4-HT) are shown. G–I Overlay of V600E (4-HT) and CDC37 (G), HSP90 (H), or 14-3-3 (I) elution profiles.
J 14-3-3 proteins interact stronger with WT, CDC37 stronger with V600E as shown by anti-HA and anti-CDC37 IPs from CaCo-2 whole-cell lysate. CDC37 does not directly interact with14-3-3 proteins.
K, L (K) Western blot of CaCo-2 SEC fractions representing the high and low molecular weight complexes. 14-3-3 proteins are found predominantly in the low weight fractions and CDC37 in the high weight fractions. 14-3-3 binding sites of BRAF are phosphorylated in the low weight fractions promoting BRAF–14-3-3 interaction and less so in the high weight fractions as shown by phosphosite-specific Western blot and (L) mass spectrometry (n =2).
M Plat-E cells were transiently transfected with indicated BRAF variants and complex distributions were analyzed by blue native (BN) PAGE followed by Western blot. SDS–PAGE Western blots served as loading control.
Source data are available online for this figure.
it comes to the identification of complex composition as antibodies for potential candidates must be highly specific and able to recog-nize their epitope in the non-denatured protein (Swamy et al, 2006). In sharp contrast, SEC-PCP-SILAC enabled us now to analyze the compositions of the high and low MW complexes in an unbiased manner. Indeed, the analysis of known BRAF binding partners also showed a surprising differential distribution. The chaperone HSP90 and its cofactor CDC37 were found in the high MW complex (Fig 3C and D). On the contrary, 14-3-3 proteins (YWHAx) predominantly localized to the low MW complex (Fig 3E).
To analyze whether the differential distribution of BRAFWTand
BRAFV600E and its binding partners can also be observed under
endogenous BRAF expression levels, we established murine
embry-onic fibroblasts (MEFs) from homozygous BraffloxV600E knock-in
mice (Dankort et al, 2007) carrying a Rosa26::CreERT2 allele expressing a 4-hydroxytamoxifen (4-HT) inducible Cre recombinase
(Ventura et al, 2007). Prior to 4-HT exposure, these BraffloxV600E;
Rosa26::CreERT2 MEFs express BRAFWTfrom its own endogenous
promoter. Upon Cre activation, however, the mini-gene allowing the
expression of BRAFWTis excised from both alleles and the restored
reading frames encode BrafV600Einstead (Dankort et al, 2007). We
performed SEC-PCP-SILAC analyses as described and also identified high and low MW complexes depending on the expressed BRAF variant (Fig 3F). Although elution profiles did not overlap comple-tely as in the human CaCo-2 cells, BRAF binding partners showed a similar differential distribution, with the larger complex being char-acterized by CDC37 and HSP90 and the smaller by 14-3-3 proteins
(Fig 3G–I). Thus, the differential distribution of BRAFWT
and BRAFV600Ecomplexes and their distinct composition is not confined to ectopically expressed BRAF in human cells, but is also observed for endogenous BRAF in murine cells.
The differential distribution of the HSP90 complex and 14-3-3
proteins between complexes and thus between BRAFV600E and
BRAFWT could also been shown by classical affinity purifications
targeting BRAF itself, as well as by reverse immunoprecipitation
(IP) targeting CDC37 (Fig 3J). CDC37 bound stronger to BRAFV600E
and we were not able to co-purify 14-3-3 proteins with CDC37. Mini-mum binding of 14-3-3 proteins to BRAF is dependent on its phos-phorylation at either Ser365 or Ser729, with the latter representing the high affinity and major binding site (Brummer et al, 2006; Fischer et al, 2009). In agreement with the differential distribution of 14-3-3 proteins, we could show that both sites are highly phos-phorylated in the low MW complex and hardly phosphos-phorylated in the high MW complex (Fig 3K and L). Importantly, the activation status of BRAF appears critical for its allocation into either the small or large complex, as the activating S365A mutation shifted the
majority of BRAFS365Amolecules into the larger complex (Fig 3M).
Commensurate with earlier findings that the gain of function imposed by the S365A mutation is offset by the S729A substitution (Brummer et al, 2006; Fischer et al, 2009), a large proportion of BRAFS365A/S729A proteins is found in the smaller complex again. BRAFV600E/S729A, which has been previously shown to retain most of its signaling capacity reacts less pronounced and stays in the larger complex (Brummer et al, 2006; Fischer et al, 2009; Ritt et al, 2010).
To comprehensively study BRAF interactions and analyze the distribution of binding partners between the macromolecular
complexes, we also characterized the interactomes of BRAFV600E
and BRAFWT by conventional IPs from CaCo-2 whole-cell lysate
using SILAC-based quantitative MS (Appendix Fig S4, Dataset EV3). In two biological replicates, 32 significantly enriched binding
part-ners were identified (Fig 4A, P< 0.05, Benjamini–Hochberg (BH)
corrected). A network of 19 proteins could be constructed using STRING DB (Fig 4B; Szklarczyk et al, 2015). As observed before, HSP90 proteins and CDC37 were found at higher levels in BRAFV600E precipitates. Furthermore, two novel interaction
part-ners, the aromatic hydrocarbon (AH) receptor-interacting protein (AIP) and the peptidyl-prolyl cis-trans isomerase FKBP5 were also
found to interact more strongly with BRAFV600E. In contrast, 14-3-3
theta (YWHAQ) and epsilon (YWHAE) were found to associate
predominantly with BRAFWT. Of note, also the
serine/threonine-protein phosphatase 2A subunit B (PPP2R2A) and MEK (MAP2K1/2)
were more abundant in BRAFWTcomplexes. The latter finding is in
agreement with the fact that BRAFV600E leads to increased MEK
phosphorylation weakening the BRAFV600E–MEK interaction (Haling
et al, 2014). FKBP5 and PPP2R2A were also identified by SEC-PCP-SILAC, and in agreement to the co-IP data, the elution profile of FKBP5 indicates its interaction with the high MW complex, whereas the elution profile of PPP2R2A identifies the phosphatase subunit as a component of the low MW complex. This is true for CaCo-2 cells ectopically expressing BRAF variants (Fig 4C and D) and for MEFs endogenously expressing BRAF (Fig 4E and F). To further corrobo-rate the differential distribution of BRAF binding partners to the high and low MW complexes, we directly performed IPs out of SEC fractions and analyzed protein abundances by label-free MS. As expected, proteins found to associate more with one or the other isoform of BRAF in the previous experiments could be observed as enriched in the respective high and low MW complexes (Fig 4G and H). For example, FKBP5, HSP90, and CDC37 were enriched in the high MW complex, whereas PPP2RA, MEK, and all 14-3-3 proteins are more strongly associated with the low MW BRAF complex, with the differences being more pronounced in V600E cells than in WT-expressing cells. This differential distribution could also be shown by Western blot analyses of pooled high and low MW SEC fractions (Fig 4I).
Taken together, BRAF localizes to structurally discrete macro-molecular protein complexes. A considerable part of oncogenic BRAFV600Eresides in a complex of~600 kDa together with CDC37
and HSP90. In contrast, the majority of BRAFWT is found in a
complex of~200 kDa together with 14-3-3 proteins and MEK.
Pharmacological interference indicates differential regulation of BRAFV600E- and BRAFWT-containing complexes
Several kinase inhibitors targeting BRAF itself or members of the MAPK signaling cascade are currently in (pre-)clinical use. The
so-called paradoxical ERK activation observed in BRAFWTcells upon
treatment with BRAF inhibitors and in the context of excessive RAS-GTP levels has highlighted the fact that a better understanding of underlying protein dynamics is vital for the design of effective anti-cancer therapies (Hatzivassiliou et al, 2010; Heidorn et al, 2010; Poulikakos et al, 2010). Therefore, we tested the effects of the approved drugs 17-AAG, a derivative of the HSP90/CDC37 complex inhibitor geldanamycin, vemurafenib and trametinib, a MEK
inhi-bitor, on BRAFWT–protein and BRAFV600E–protein interactions.
Anti-HA affinity purifications from whole-cell lysate showed again the differential binding of 14-3-3 proteins and CDC37 to the two variants
A
C
G
I
H
D
E
F
B
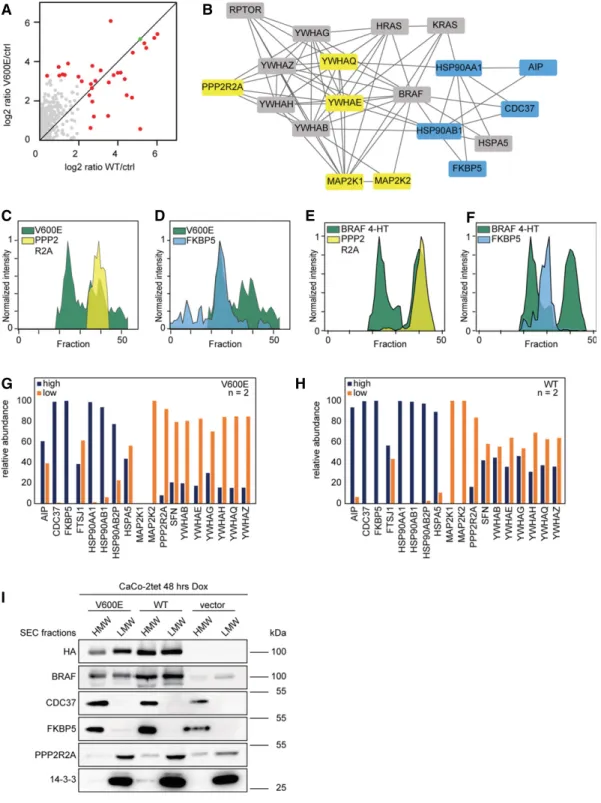
Figure4. Molecular composition of macromolecular BRAF complexes.
A Anti-HA affinity purification from whole-cell lysate of SILAC-labeled cells expressing WT and V600E is compared to unlabeled vector control cells (ctrl). BRAF is marked in green, significantly interacting proteins in red (P< 0.05, BH corrected).
B A protein interaction network of BRAF binding partners identified in (A) is shown. Proteins interacting stronger with V600E are colored blue, proteins interacting stronger with WT yellow. Proteins binding to both forms with similar strength are colored gray.
C, D CaCo-2tet SEC-PCP-SILAC profiles of differential BRAF binding partners are shown relative to the V600E profile. E, F MEF SEC-PCP-SILAC profiles of differential BRAF binding partners are shown relative to the V600E profile (4-HT). G, H (G) Anti-HA-BRAFV600Eand (H) anti-HA-BRAFWT
IPs from SEC fractions corresponding to high and low MW complexes indicate differential localizations of interaction partners shown in (B). Relative protein abundances are based on iBAQ values.
I High and low MW complexes are separated by SEC, several SEC fractions were combined, and bulk protein abundance was analyzed by Western blot. Source data are available online for this figure.
of BRAF (Fig 5A and B). Whereas 17-AAG reduced CDC37-binding to both BRAF forms, it did not influence BRAF/14-3-3 interactions. Interestingly, 17-AAG also led to a reduction of the high molecular
weight complex containing BRAFV600E (Fig 5C) and reduced
BRAFV600E activity as indicated by MEK phosphorylation (Fig 5D
and E). Thus, the CDC37–BRAF interaction appears to be vital for
the formation of the large complex and for BRAFV600E activity.
Importantly, timing and concentration of 17-AAG were chosen in such a way that BRAF levels were not yet affected by degradation (Appendix Fig S5; Grbovic et al, 2006).
Vemurafenib had no obvious influence on the BRAFWT–CDC37
interaction; however, it did significantly decrease the BRAFV600E–
CDC37 interaction, also indicating that BRAFV600E signaling relies
on CDC37 (Grbovic et al, 2006). Furthermore, vemurafenib affected the formation of the discrete large complex (Fig 5C) and decreased BRAFV600Eactivity (Fig 5D and E). MEK, total as well as
phosphory-lated, interacted more strongly with BRAFWT compared to
BRAFV600E. Interestingly, MEK inhibition by trametinib reduced the
interaction of inactive MEK with BRAFWTand led to an increased
interaction with CDC37 in the case of both BRAFV600Eand BRAFWT
(Fig 5A and B). As MEK inhibition abolishes the negative feedback from ERK to BRAF (Brummer et al, 2003; Rushworth et al, 2006; Pratilas et al, 2009; Ritt et al, 2010; Fritsche-Guenther et al, 2011), these data could reflect an accumulation of active BRAF that needs to be chaperoned by the HSP90/CDC37 complex.
BRAF high and low molecular weight complexes exhibit differential activities
As the binding of CDC37 has been linked to BRAF activity (da Rocha Dias et al, 2005; Grbovic et al, 2006) and as we could show that vemurafenib and 17-AAG reduce the abundance of the high MW complex, we analyzed BRAF kinase activities in SEC fractions of high
and low MW of BRAFV600Eand BRAFWTby in vitro kinase assays
(Fig 6A and B). BRAFV600Ein the high MW complex was 1.7 times
more active than BRAFV600E in the low MW complex. To further
prove that complex size was correlated with the active conformation
of BRAF, we purified endogenous BRAFWTfrom CaCo-2tet cells
engi-neered to express oncogenic KRASG12Vupon Dox treatment (Mo¨ller
et al, 2014). Indeed, KRASG12V induced a segregation of initially
homogenous BRAF low MW population into high and low MW
complexes in CaCo-2tet cells (Fig 6C). Again, BRAFWTin the high
molecular weight complex was twice more active than BRAFWTin
the low molecular weight complex and kinase activity could be blocked by the addition of vemurafenib (Fig 6B, Appendix Fig S6).
This reorganization of endogenous BRAFWTcomplexes and the
asso-ciated increase in activity was accompanied by the phosphorylation
of BRAFWT, as indicated by its electrophoretic mobility shift in SDS–
PAGE, and the phosphorylation levels of MEK and ERK (Fig 6D). As expected from its property as a pan-RAF inhibitor (Wilhelm et al, 2004), sorafenib drastically reduced MEK and ERK phosphorylation
A
B
C
D
E
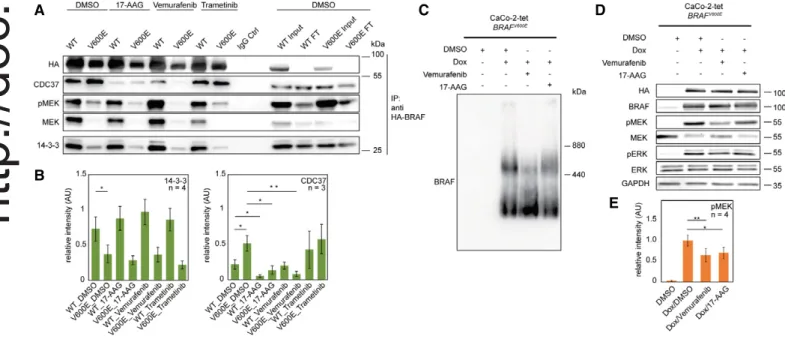
Figure5. Modulation of protein–protein interactions by pharmacological interference highlights differences between WT- and V600E-containing complexes. A BRAF-containing protein complexes were purified via anti-HA IPs of WT- and V600E-expressing CaCo-2 cells treated with the indicated inhibitors. DMSO treatment
served as control.
B Quantification of blots shown in (A). Error bars indicate SD; *P< 0.05, **P < 0.01, unpaired Student’s t-test.
C, D The influence of17-AAG and vemurafenib on (C) protein complexes of V600E-expressing CaCo-2 cells is analyzed by blue native PAGE and on (D) signal transduction is analyzed by SDS–PAGE. The expression of V600E leads to the formation of two macromolecular complexes. Addition of both drugs leads to a reduction in the larger protein complex and reduced BRAFV600Eactivity as indicated by the level of phospho-MEK (pMEK). Note: the antibodies used for detection of
MEK react less with phosphorylated MEK.
E Quantification of blots shown in (D). Error bars indicate SD; *P< 0.05, **P < 0.01, unpaired Student’s t-test. Source data are available online for this figure.
(Fig 6D). Interestingly and in stark contrast to BRAFV600E(Fig 5C),
abundance of the high MW complex of BRAFWT was further
increased by vemurafenib, while sorafenib shifted all detectable
BRAFWTmolecules into the high MW fraction (Fig 6C). These effects
might reflect the different abilities of vemurafenib (or its predecessor PLX4720) and sorafenib to induce weak and particularly stable BRAF dimers, respectively (Ro¨ring et al, 2012).
To further confirm that distinct BRAF complexes can also be observed endogenously and that these distinct complexes exhibit differential activities, we turned again to the aforementioned MEF BRAFfloxV600E/floxV600Esystem as well as to human melanoma cells.
Unlike to the situation of most human cancer cell lines, which
co-express BRAFWT and BRAFV600E and are likely to produce BRAF
complexes from three distinct homo-dimers consisting of either wild-type and/or mutant proteins, our MEF isogenic experimental setup produces only complexes made up by either wild-type or mutant BRAF and therefore might provide a better discrimination of the complexes in BN–PAGE. Indeed, 4-HT induces not only MEK phosphorylation but also a shift of BRAF from the low to the high MW fraction (Fig 6E and F), as it was already observed in CaCo-2tet
cells expressing HA-BRAFV600E (Fig 5C). Because both events are
vemurafenib sensitive, we conclude again that the high MW fraction
A
C
D
E
F
H
G
B
Figure6. BRAF complexes exhibit differential activities.
A The high and low molecular weight complexes of V600E are fractionated by SEC, and kinase activity is analyzed by in vitro kinase assays (IVKA). The phosphorylation of purified GST-MEK is detected by a phosphosite-specific antibody recognizing phospho-Ser217/221 (pMEK). The HA signal is used as loading control. Bar diagram shows quantification of blots normalized to HA-BRAF. AU: arbitrary unit. Error bars indicate SD; *P< 0.05, unpaired Student’s t-test. B IVKA of WT complexes. Error bars indicate SD; *P< 0.05, unpaired Student's t-test.
C, D WT complexes are analyzed by (C) BN–PAGE and (D) SDS–PAGE followed by Western blot using CaCo-2 cells inducibly expressing KRASG12V. E, F MEFs BRAFfloxV600E/floxV600Eexpressing WT or V600E upon 4-HT induction are analyzed as in (C and D). EtOH treatment served as vehicle control. G, H Human SBcl2 melanoma cells expressing endogenous NRASQ61Kare treated and analyzed as described in panels (C and D).
Source data are available online for this figure.
is dependent on either the activity or active conformation of BRAFV600E. Finally, we used human SBcl2 melanoma cells, which
lack a BRAF mutation, but carry an endogenous NRASQ61Koncogene
and in which paradoxical ERK activation can be rapidly provoked by BRAF selective inhibitors in a dimerization-dependent manner
(Fig 6G and H; Ro¨ring et al, 2012). Like in KRASG12V-expressing
CaCo-2tet cells, vemurafenib and sorafenib promoted or completely
induced the transfer of BRAFWTfrom the low into the high MW
complex, respectively (Fig 6G). In summary, our data indicate that BRAF activation leads to the assembly of distinct protein complexes that exhibit differential activities and may address specific roles within the cell.
Discussion
BRAF is a therapeutic target of growing relevance across various clinical disciplines (Turski et al, 2016). Despite all the impressive therapeutic responses elicited by BRAF inhibitors reported since 2010, these drugs often fail to provide sustainable treatment options due to the emergence of drug resistance and side effects associated with the aforementioned “paradoxical ERK activation” observed in cells with elevated RAS activity (Samatar & Poulikakos, 2014; Yaktapour et al, 2014; Lavoie & Therrien, 2015). Indeed, this phenomenon illustrates that the complexity of RAF signaling has been underestimated and highlights the need for a better under-standing how BRAF entertains protein–protein interactions, forms protein complexes, and how these events guide the kinase through its activation cycle.
With the current study, we aimed to decipher the complexities of signaling complexes organized by either wild-type or oncogenic BRAF by applying a recently developed proteomic approach to a panel of human and murine cell line models and primary cells. By
fitting CaCo-2tet cells with inducible BRAFWT, BRAFV600E, and
KRASG12Vexpression systems, we could study the molecular
func-tions of respective oncoproteins in an isogenic setting. Ectopic BRAF expression did not alter global protein abundances, and the observed ninefold increase in BRAF itself is still in the range of abundance levels observed in patients harboring acquired resistance
to BRAFV600Einhibition by gene ultra-amplification (Moriceau et al,
2015). Importantly, not only do we corroborate our previous finding
from BN–PAGE analyses that BRAFWTand BRAFV600Epredominantly
localize to protein complexes of distinct and discrete sizes (Ro¨ring et al, 2012), but we also demonstrate now that these complexes differ in their composition and activity. We show that the formation of the larger BRAF complexes represents a function of kinase activation as
BRAFWT is transferred into the larger complex upon inducible
expression of oncogenic KRAS (Fig 7). Importantly, our key findings were confirmed in the human melanoma cell line SBcl2 and an
isogenic MEF system expressing endogenous BRAFWTand BRAFV600E,
indicating that our results are neither cell line nor organism depen-dent nor influenced by BRAF expression levels. However, as we did not perform detailed interactome studies of the different complexes in
all tested cell lines–drugs combinations, we cannot rule out that the
similar sized complexes differ in single components. This has to be addressed by future studies.
It is well understood that BRAFWT and some of its
gain-of-function mutants need to form side-to-side homo- and heterodimers (Rajakulendran et al, 2009; Thevakumaran et al, 2015), while BRAFV600E can potentially signal as a monomer, for example, by introduction of mutations abolishing DIF function and/or 14-3-3 binding (Poulikakos et al, 2011; Ro¨ring et al, 2012; Freeman et al,
2013). However, this does not necessarily mean that BRAFV600E
always exists as a monomer in living cells. In fact, we and others
have shown that BRAFV600Eand other high activity oncoproteins are
more abundantly purified in their dimeric form than BRAFWT
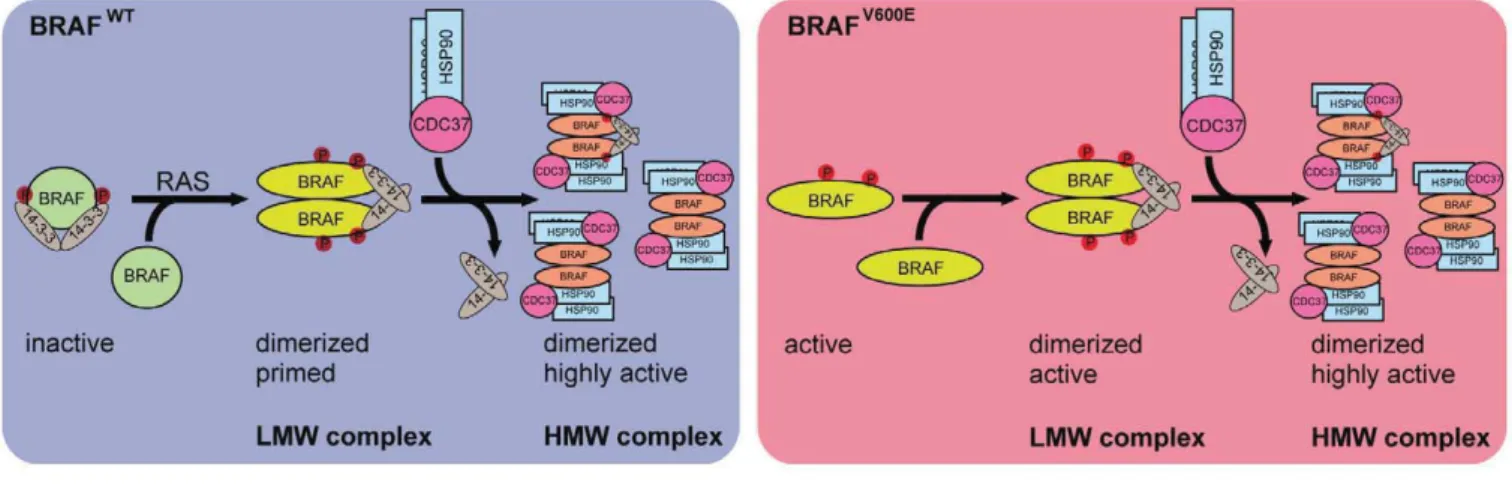
Figure7. Model of BRAF complex dynamics. Left cartoon: BRAFWT
is present in a monomeric form and depending on its phosphorylation status (S365, S729 marked in red) bound to 14-3-3. In the presence of active RAS, BRAF becomes phosphorylated and forms homo- or heterodimers by conformational changes in the kinase domain (Thevakumaran et al,2015) and the concerted action of14-3-3 proteins promoting dimerization at the RAF C-termini. Dimerization promotes allosteric activation and a fully active conformation of BRAF, leading to recruitment of one asymmetric HSP90/CDC37 dimer per RAF protomer. Right cartoon: In contrast to BRAFWT
, BRAFV600Eis locked in an active conformation (Wan et al, 2004; Thevakumaran et al, 2015) and thus can remain active upon mutation of dimerization devices such as the C-terminal 14-3-3 motif and the DIF (Röring et al, 2012). However, in cancer cells, BRAFV600Eis predominantly found in a dimeric state. Upon translocation to the high molecular weight complexes BRAF variants become dephosphorylated reducing the interaction with14-3-3 proteins and concurrently increasing the interaction with HSP90/CDC37. See Discussion for further details and additional references.
(Ro¨ring et al, 2012; Thevakumaran et al, 2015). Using BN–PAGE, we could show that both ectopically and endogenously expressed BRAFV600E appear more likely in larger protein complexes than
BRAFWTand that the HMW complex requires an intact DIF in BRAF,
suggesting that dimerization represents a key prerequisite for its formation (Ro¨ring et al, 2012). More importantly, we have identified now at least two distinct multimeric, macromolecular protein
complexes harboring BRAF. One complex of~600 kDa is
character-ized by BRAF, CDC37, HSP90, and FKBP5, and the other
predomi-nant complex of ~200 kDa contains BRAF, 14-3-3 proteins, MEK,
and PPP2R2A (Fig 7).
Although some of the complex components such as HSP90/ CDC37 and the 14-3-3s have been identified as BRAF interactors previously (Jaiswal et al, 1996; Papin et al, 1996; Eisenhardt et al, 2016), we report here for the first time their differential binding pattern. Binding of 14-3-3 proteins is critical for BRAF complex distribution as mutations of their recruitment sites altered the ratio between the large and small BRAF complexes. In addition to these well-established interaction partners, our SEC-PCP-SILAC approach also identified the discrete distribution of less known interaction partners, such as FKBP5 that we recently identified as BRAF interac-tion partner in chicken DT40 and human MCF-10A cells (Eisenhardt et al, 2016). Here, we show that this peptidyl-prolyl cis/trans isomerase represents a hallmark of the high molecular weight BRAF complex. FKBP5 plays a role in the regulation of multiple signaling pathways, in tumorigenesis and chemoresistance (Li et al, 2011), and has been identified to act as a negative regulator of AKT (Pei
et al, 2009). AKT3 lowers BRAFV600E
activity by phosphorylating BRAF within the 14-3-3 binding motif around Ser365 that is critical for BRAF inhibition, even within the highly active V600E context
(Cheung et al, 2008). As FKBP5 interacts with BRAFV600E in the
high MW complex in which phosphorylation of BRAF at Ser365 is almost absent, it is tempting to speculate that the FKBP5-mediated inactivation of AKT3 accounts for the loss of pS365 on BRAF and thereby the reduction of 14-3-3 in the high MW complex. FKBP5 was absent in the low MW complex in which Ser365 was
phospho-rylated. On the other hand, PPP2R2A interacts with BRAFV600E in
the low MW complex and has been suggested to dephosphorylate hyper-phosphorylated BRAF (Ritt et al, 2010), suggesting that BRAFV600E in this complex is less active or becomes inactivated. Alternatively but not necessarily excluding these possibilities, loss
of 14-3-3 in the high MW BRAFV600Ecomplexes could expose pS365
and pS729 to phosphatases, thereby preventing 14-3-3 re-binding by dephosphorylation.
The reciprocal distribution of the HSP90/CDC37 complex and the 14-3-3 isoforms is a surprising finding (Fig 7). In fact, one of the first studies reporting the BRAF/HSP90 interaction in unstimulated and NGF-treated PC12 cells suggested a more or less constitutive
interaction between BRAFWT and the chaperone complex (Jaiswal
et al, 1996). Likewise, despite the dynamic on/off recruitment of 14-3-3s to the N-terminal 14-3-3 binding site (S365 in BRAF) during the activation cycle of BRAF and CRAF (Dhillon et al, 2002; Rodriguez-Viciana et al, 2006), it was assumed that the 14-3-3 dimer remains more or less constitutively bound to the high affinity 14-3-3 binding motif at the C-terminus of RAF-kinases (Ser729 in BRAF),
including BRAFV600E. This assumption was based on
co-immunopre-cipitation studies and GST-14-3-3 pulldowns and by genetic data showing that this protein–protein interaction appears necessary for
auto-inhibition, dimerization, and MEK phosphorylation (MacNicol et al, 2000; Brummer et al, 2006; Fischer et al, 2009; Ritt et al, 2010). Nevertheless, it must be kept in mind that neither co-immunoprecipitation/pull-down studies nor genetic approaches can provide the spatial resolution delivered by SEC-PCP-SILAC. In
hind-sight, however, our discovery that BRAFV600Eoccurs in at least two
complexes, with the larger being more active and bound to HSP90/ CDC37 but basically lacking 14-3-3 proteins, provides now a mecha-nistic explanation for several phenomena published within the last decade. Firstly, we and others have shown that loss of 14-3-3
bind-ing to Ser729 abrogates the signalbind-ing potential of BRAFWT and
several gain-of-function mutants but not of BRAFV600E (Brummer
et al, 2006; Fischer et al, 2009; Ritt et al, 2010). Thus, BRAFV600E,
despite the fact that it can bind to 14-3-3s if it is present in the low MW complex, does not require these phospho-serine binding proteins for downstream signaling, hence there is no need to retain them in the large and more active complex. Secondly, while the interaction of 14-3-3 proteins with the C-terminus of BRAF is critical to initiate dimerization (Ritt et al, 2010), a considerable fraction of the low MW 14-3-3-containing complex could represent a popula-tion that has been inactivated recently. Indeed, AMPK-mediated phosphorylation of Ser729 has been suggested to disrupt the BRAF/ KSR1 complex and thereby to attenuate downstream signaling (Shen
et al, 2013). Thirdly, BRAFV600Eassociates more strongly with the
HSP90/CDC37 complex compared to BRAFWT(Grbovic et al, 2006).
Fourthly and most critically from a clinical perspective, our data explain as to why HSP90 inhibitors such as geldanamycin or ganete-spib show efficacy in BRAF mutant tumor cells, even in those with acquired vemurafenib resistance, while sparing cell lines lacking BRAFV600E
mutations (da Rocha Dias et al, 2005; Grbovic et al, 2006; Acquaviva et al, 2014). Thus, the more active high MW
complex of BRAFV600Emight represent the major oncogenic driver
and consequently its tight interaction with HSP90/CDC37 provides
an Achilles heel to BRAFV600E addiction of tumor cells by HSP90
inhibitors.
But what determines whether a BRAF molecule becomes incor-porated into the low or high MW complex? Based on our data and previous work, we posit that it is the combination of the active conformation of the kinase domain and the dimerization status of BRAF that determines the composition, order and quaternary struc-ture of these complexes. Indeed, DIF mutations impair not only the
homo-dimerization of BRAFV600E, but also its incorporation into the
high MW complex (Ro¨ring et al, 2012). Moreover, by assessing
endogenous BRAFWTin CaCo-2tet cells in the absence or presence
of KRASG12V, we now demonstrate that this oncogenic GTPase not
only activates BRAF/MEK/ERK signaling, as expected, but also shifts BRAF from the low into the high MW complex. As active RAS promotes dimerization of RAF, most likely by promoting the afore-mentioned conformational change within its kinase domain ulti-mately leading to DIF exposure (Heidorn et al, 2010; Thevakumaran et al, 2015; Ko¨hler et al, 2016), this observation implies again that BRAF has to acquire a fully active conformation to assemble the high MW complex (Fig 7). Our observation that vemurafenib disrupts the high MW complexes organized by HA-tagged or
endogenous BRAFV600E further supports this model. Moreover,
Thevakumaran et al (2015) demonstrated that this inhibitor induces an “off-state like” conformation and thereby acts as a homo-dimer breaker. Thus, based on these insights, it is not surprising that DIF
mutations or vemurafenib abolish the high MW complex. Likewise, vemurafenib, which has been shown to disrupt the interaction between CDC37 and the isolated kinase domain of BRAF (Polier et al, 2013), also reduced the abundance of complexes between
CDC37 and full-length BRAFV600Ein our experimental system. This
was associated with a reduction in kinase activity and the abun-dance of the high MW complex. In summary, our data suggest that
BRAFWT, once it has acquired its fully active conformation, or
BRAFV600E, which is stabilized in its active conformation due to a
mutation-specific salt-bridge (Wan et al, 2004; Hu et al, 2013; Thevakumaran et al, 2015), display a higher affinity to but also dependence for the HSP90/CDC37 complex (Fig 7). This concept is
further supported by the BRAFS365Amutant, which is predominantly
incorporated into the large BRAF complex. This mutant is primed for full activation by relief from 14-3-3-mediated auto-inhibition (MacNicol et al, 2000; Brummer et al, 2006; Fischer et al, 2009; Ritt et al, 2010), probably leading to a better exposure of the kinase domain and facilitating dimerization-driven transactivation (Ro¨ring
et al, 2012). Thus, this mutant imitates a state in which BRAFWT
only exists following its recruitment by RAS-GTP. This concept is supported by previous studies showing that RAS-GTP activates BRAF and CRAF by cooperating with a phosphatase complex that displaces 14-3-3 proteins and prevents their re-binding by de-phosphorylation of S365 (or S259 in CRAF) (Dhillon et al, 2002; Rodriguez-Viciana et al, 2006; Deswal et al, 2013).
We also investigated higher order complexes of BRAFWT
in the
setting of the paradoxical action of vemurafenib in NRASQ61K-driven
human melanoma cells and in the context of the pan-RAF inhibitor sorafenib. Interestingly, these experimental setups revealed the formation of larger complexes, although ERK phosphorylation was further reduced by sorafenib. At first glance, this finding appears to contradict our model, which is in part based on the
vemurafenib-sensitive high MW BRAFV600Ecomplexes. However, if we consider
that sorafenib and, albeit to a lesser extent, also vemurafenib do not abrogate, but rather promote BRAF hetero-dimerization (Heidorn et al, 2010; Ro¨ring et al, 2012), it is conceivable that these high MW complexes differ in their composition from those organized by BRAFV600E and might rather contain RAF heterodimers at their center. This represents an area for future studies.
Our data have several important translational implications. Firstly, it is critical to comprehensively study BRAF isoform-specific protein–protein interactions in an inhibitor-dependent fashion as
each drug might provoke distinct multi-protein complexes.
Secondly, the clinically relevant MEK inhibitor trametinib, which reduces the negative feedback from ERK to BRAF (Brummer et al, 2003; Rushworth et al, 2006), enforces CDC37 association and thereby probably sustains the longevity of the large and more active complexes. This might be relevant for our understanding of MEK inhibitors, for example, within a combination therapy setting. Thirdly, next to directly targeting BRAF activity by ATP competitors, compounds blocking the HSP90/CDC37 interaction could provide an additive value, in particular as HSP90 inhibitors are increasingly trialed and applied in a clinical setting (Neckers & Workman, 2012; Acquaviva et al, 2014). Indeed, a very recent report demonstrated that the HSP90 inhibitor XL888 suppressed vemurafenib induced paradoxical ERK activation in NRAS mutant melanoma cell lines and the incidence of secondary skin lesions in vemurafenib-treated patients (Phadke et al, 2015). Taken together, the presented work
sheds new light on the BRAF activation cycle and the quaternary structure of multimeric, cytosolic BRAF complexes. It underscores the importance of studying the spatial organization of multi-protein complexes and identifies important regulatory mechanisms, which can be employed in the design of new combination therapies addressing hyperactive BRAF in disease.
Materials and Methods
Cell lines
Plat-E, SBcl2, CaCo-2tet HA-BRAFWT, CaCo-2tet HA-BRAFV600E,
CaCo-2tet KRASG12V, and CaCo-2tet vector cells were cultivated as
previously described (Ro¨ring et al, 2012; Herr et al, 2015).
Expres-sion of HA-BRAFWT, HA-BRAFV600E, or KRASG12Vwas induced with
2lg/ml doxycycline (Sigma-Aldrich, Taufenkirchen, Germany) for
indicated time points or if not mentioned differently for 48 h. All cell lines were cultivated under water vapor-saturated conditions at
37°C and 5% CO2. Inhibitors were dissolved in DMSO and final
concentrations were: vemurafenib 1lM, 17-AAG 1 lM, trametinib
10 nM; maximum concentration of DMSO was 0.01%. Mouse embryonic fibroblasts
The generation of the MEF BraffloxV600E/floxV600E and MEF
BraffloxV600E/floxV600E/Rosa26::CreERT2 was performed as follows.
All procedures involving mice were carried out in accordance with the local animal ethics committee (X-14/47H). Conditional BraffloxV600E/knock-in mice were originally generated by the
McMahon laboratory and were described in detail previously (Dankort et al, 2007). Mice were purchased from The Jackson Labo-ratory in Bar Harbor (Maine, USA) and delivered on a pure C57BL/6 background. Genotyping was performed using the protocols published by Dankort et al (2007). After embryo transfer into our facility, mice were maintained on a C57BL/6 background and then mated with Rosa26::CreERT2 mice (Ventura et al, 2007), also backcrossed to a C57BL/6 background. Subsequently, the resulting BraffloxV600E/+/Rosa26::CreERT2F1 animals were bred to
homozy-gosity in respect to the BraffloxV600E allele. BraffloxV600E/floxV600E/
Rosa26::CreERT2 animals were then mated with BraffloxV600E/floxV600E
mice to generate embryos for MEF preparation as described previ-ously (Ro¨ring et al, 2012). Briefly, embryos were isolated at embry-onic day 12.5. The head and fetal liver were removed, and the torso was minced and digested in 0.25% trypsin/EDTA solution at 37°C for 30 min. Cells were spun down and then cultivated in Dulbecco’s modified Eagle’s medium supplemented with 20% fetal
calf serum, 2 mML-glutamine, 10 mM HEPES, 200 U/ml penicillin,
200lg/ml streptomycin; 2.5 lg/ml amphotericin B all from PAN,
Aidenbach, Germany) in a vapor-saturated atmosphere at 37°C and
5% CO2. MEF pools with the appropriate genotypes were expanded
for a few days and then immortalized by infection using the pQCXIH/Tag retroviral construct, which encodes the large T anti-gen (Tag) of simian virus 40. Infected cells were selected with
hygromycin B (200lg/ml). Immortalized MEFs, which retained
their normal morphology and displayed proper contact inhibition response upon confluency, were used for further studies.
Expres-sion of BrafV600Ewas induced with a 1 day 1lM 4-hydroxytamoxifen
(4-HT; Sigma-Aldrich, Taufenkirchen, Germany) pulse to allow for
CreERT2-mediated recombination of BraffloxV600Ealleles.
Stable isotope labeling by amino acids in cell culture (SILAC)
For SILAC labeling, CaCo-2tet HA-BRAFWT, CaCo-2tet
HA-BRAFV600E, and CaCo-2tet vector cells were grown in high glucose
(4.5 g/l) SILAC-DMEM (PAN, Aidenbach, Germany) with 1% gluta-mine, 1% penicillin/streptomycin, and 10% dialyzed fetal bovine serum (Invitrogen, Darmstadt, Germany) containing either 88.3 mg/ml
L-arginine HCl, 76.3 mg/mlL-lysine for light labeling (Arg0, Lys0)
(Sigma-Aldrich), or L-arginine-13C614N4 and L-lysine-2H4 (Arg6,
Lys4) for medium-heavy labeling, orL-arginine-13C615N4andL
-lysi-ne-13C
615N2 (Arg10, Lys8) for heavy labeling (Eurisotop,
Saarbru¨cken, Germany). The cells were grown for at least 2 weeks to ensure 100% incorporation of labeled amino acids.
Western blot
To gain whole-cell lysate (WCL) from cells, these were lysed in either normal lysis buffers (NLB: 50 mM Tris/HCl, pH 7.5; 1% Triton X-100; 137 mM sodium chloride; 1% glycerin; protease inhi-bitors and phosphatase inhiinhi-bitors) or 4% SDS in 100 mM Tris, pH 7.6 (for inhibitor titration Western blots). Protein concentration determination was performed via BCA assay (Thermo Fisher Scien-tific, Langenselbold, Germany). Equal protein amounts were loaded for PAGE. Blotted proteins were visualized with horseradish peroxi-dase-conjugated secondary antibodies (Roche Diagnostics GmbH, Mannheim, Germany) using the Blot Detection Kit Immobilon Western (Millipore, Schwalbach, Germany) and the LAS-4000 reader (Fujifilm Europe GmbH, Du¨sseldorf, Germany). Densitometry measurements were performed using ImageJ 1.49k (Wayne Rasband, National Institutes of Health, USA).
Immunoprecipitations
Cells were lysed in NLB as described for Western blot. Depending on the subsequent analysis strategy the volume of anti-HA (3F10) affinity matrix (Roche Diagnostics GmbH, Mannheim, Germany) to precipitate HA-BRAF was chosen to match 30–60 lg of anti-HA
antibody. For immunoprecipitation of CDC37, 15lg of anti
CDC37-antibody (Santa Cruz Biotechnology Inc., Heidelberg, Germany) was used. The same amount of normal mouse IgG (Santa Cruz Biotech-nology Inc., Heidelberg, Germany) served as control for potential unspecific protein binding. Protein G sepharose fast flow beads (Sigma-Aldrich, Taufenkirchen, Germany) were mixed thoroughly before the same volume as antibody solution was taken to a fresh reaction tube. The antibody solution was then added on top. Last, the sample lysate was added into the same reaction tube. An aliquot of each lysate was retained before IP serving as an input control for the presence of the protein being precipitated. IPs were incubated at 4°C on an overhead rotator overnight. The next day an aliquot of the supernatant was taken apart as flow through (FT) control. The pelleted beads were subsequently washed three
times with lysis buffer and resuspended in 2× SDS loading buffer
with 5 mM DTT. Precipitated proteins were eluted by boiling at
95°C. Equal volumes of eluates were loaded for analysis via
Western blot.
Antibodies
Antibodies used in this study are from Cell Signaling Technology, MA, USA: anti-phospho-MEK1/2 (pS217/221) (# 9121L), anti-MEK1/2 (# 9122L), anti-phospho-p44/42 MAPK (ERK1/2) (Thr202/Tyr204) (#9101), anti-p44/42 MAPK (ERK1/2) (#9102); from Santa Cruz Biotechnology Inc., Heidelberg, Germany: Ras (# 3965), anti-GAPDH (FL335) (# sc-25778), anti-BRAF (F7) (# sc-5284), anti-CDC37 (C-11) (# sc-13129), anti-pan-14-3-3 (H-8) (# sc-1657), normal mouse IgG (sc-2025); anti-HA (3F10) (# 11867423001, Roche Diagnostics GmbH, Mannheim, Germany), anti-HA (3F10) Affinity Matrix (# 11815016001, Roche); donkey anti-rabbit HRP (# NA9344V, GE Healthcare, Munich, Germany), sheep anti-mouse HRP (# NA931V, GE Healthcare); goat anti-rat HRP (# 112-035-003, Dianova GmbH, Hamburg, Germany); mouse IgG VeriBlot for IP secondary anti-body (HRP) (# ab131368, Abcam, Cambridge, United Kingdom). The
anti-BRAFV600E(VE1) was kindly provided by Prof. A. v. Deimling and
has been described previously (Capper et al, 2011; Ro¨ring et al, 2012).
BN–PAGE analysis
CaCo-2 cells were plated 24 h before doxycycline-induced
expres-sion of HA-BRAFV600E or KRASG12V. Subsequent cells were either
treated for 1 h with 1lM PLX4032 (vemurafenib; Selleck
Chemi-cals, Munich, Germany) or with 10lM sorafenib (Santa Cruz
Biotechnologies, USA) or for 4 h with 1lM 17-AAG (Tanespimycin;
Selleck Chemicals, Munich, Germany). DMSO (Sigma-Aldrich, Taufenkirchen, Germany) served as negative control.
Alternatively, SBcl2 melanoma cells were plated 24 h prior to treatment with PLX4032, sorafenib, or DMSO in the same manner as described for CaCo-2 cells. Cells were lysed by adding 1 ml of cold BN-lysis buffer (20 mM Bis-Tris, pH 7.0, 20 mM NaCl, 2 mM EDTA, pH 8.0, 10% glycerol) supplemented with 1% Triton X-100, protease, and phosphatase inhibitors (Complete protease inhibitor cocktail, PhosSTOP EasyPack; Roche Diagnostics GmbH, Mannheim, Germany) to the cell culture dish. After incubation on a rocking
plat-form for 30 min at 4°C, the lysate was centrifuged at 13,000 g at 4°C
for 10 min. The supernatant was removed and stored on ice for the following steps. A 1:20 dilution of a ferritin mark (440 and 880 kDa;
Sigma-Aldrich, Taufenkirchen, Germany) was used as marker. 2ll
of sample was loaded on a precast BN gel (NativePAGETM
Novex
4–16% Bis-Tris Protein Gels; Invitrogen, Darmstadt, Germany)
and overlaid with dark blue cathode buffer (NativePAGE Running buffer kit; Invitrogen, Darmstadt, Germany). 1% glycerol was added to the samples before loading. The BN gel electrophoresis
was performed at 4°C for 1 h using dark blue cathode buffer
and anode buffer (NativePAGETM
Running buffer kit; Invitrogen, Darmstadt, Germany), followed by two more hours with light
blue cathode buffer and anode buffer (NativePAGETM
Running buffer kit; Invitrogen Darmstadt, Germany).
Subsequently, BN–PAGE separated proteins were blotted onto PVDF membranes (Immobilon-PSQ; Merck Millipore, Merck KGaA, Darmstadt, Germany) by wet protein transfer using 1× TGS contain-ing 0.02% SDS (Bio-Rad, Munich, Germany) and 20% methanol (VWR, International GmbH, Bruchsal, Germany). Loading controls of BN–PAGE experiments were made from cell lysates gained from BN–PAGE cell lysis as described above. Equal volumes of each sample were loaded for analysis via Western blot.
In vitro kinase assay (IVKA)
Expression of HA-BRAFV600E or KRASG12V in CaCo-2tet cells was
induced, and size exclusion chromatography (SEC) was performed. SEC fractions corresponding to the high molecular weight complex (fractions 23–29) and fractions corresponding to the low molecular weight complex (fractions 38–46) were combined after
chromato-graphic separation. From BRAFV600E samples, 1, 3, 5, and 10ll
were supplemented with kinase assay buffer (KAB; 20 mM 4-morpholinepropanesulfonic acid (MOPS), pH 7.2; 5 mM EGTA, 1× phosphatase inhibitors, 1 mM dithiothreitol) to 20 ll total
volume. Then, these suspensions were mixed with 2lg recombinant
GST-MEK1 and 5 mM ATP in 20ll KAB. The IVK reaction was
incu-bated at 30°C for 30 min at 700 rpm in a thermomixer. For the IVKA
performed with BRAFWTfrom CaCo-2tet KRASG12V
cells, the volume of the combined fractions was decreased to half by using a 10 kDa
cutoff filter (Sartorius AG, Go¨ttingen, Germany). Then, 10 and 20ll
were supplemented with SEC lysis buffer to 40ll total volume.
Additionally, 40ll of the concentrated, combined SEC fractions were
left unsupplemented. Next, these suspensions were mixed with 40ll
of KAB. Finally, 80ll of the GST-ATP-MEK-Mix was added. IVK
reaction was incubated at 30°C as well but for 60 min. Kinase
reactions were immediately stopped by addition of 2× SDS sample
buffer containing 1 mM DTT and boiling for 10 min at 95°C.
Subse-quently, the reactions were analyzed by Western blot. Here, the degree of phosphorylated GST-MEK served as read out for the kinase activity. Detection against BRAF or HA served as loading control. SEC-PCP-SILAC
After doxycycline treatment, cells were washed once with ice-cold DPBS (PAN, Aidenbach, Germany) and subsequently lysed in a Dounce homogenizer (Wheaton, Millville, NJ USA) in size exclusion
chromatography (SEC) mobile phase (50 mM KCl, 50 mM
NaCH3COO, pH 7.2) including protease inhibitors and phosphatase
inhibitors (Roche Diagnostics GmbH, Mannheim, Germany) (SEC lysis buffer). 1.5 ml of each lysate was clarified of debris by a 10-min centrifugation (3,220 g). Soluble, cytosolic complexes were enriched by a 20-min ultracentrifugation (100,000 g) using a iodixanol (Sigma-Aldrich, Taufenkirchen, Germany) gradient before
being concentrated to 100ll using ultrafiltration (100,000 MWCO;
Sartorius AG, Go¨ttingen, Germany). Cytosolic complexes were
loaded onto an A¨ KTA Purifier 10 semi-preparative HPLC (GE
Healthcare, Munich, Germany) equipped with a 600× 7.8 mm
BioSep4000 Column (Phenomenex, Aschaffenburg, Germany)
(resolving power 25,000 plates) controlled at 15°C and a flow rate of
0.5 ml/min. 20 fractions were collected from 20 to 30 min, and 34 fractions were collected from 30 to 41.5 min. The corresponding medium and heavy fractions were recombined just after size exclusion chromatographic separation. The light SILAC popula-tions were similarly separated by SEC, after which all fracpopula-tions were recombined and mixed thoroughly before being spiked equally into each of the medium/heavy fractions.
MS sample preparation
Fractions from SEC-PCP-SILAC were conducted to an in-solution digest. For protein denaturation and reduction, 1% sodium
deoxycholate and 10 mM DTT were added to each fraction prior to boiling at 95°C for 5 min followed by 56°C for 20 min. To alkylate proteins, addition of 4.5 mM iodoacetamide and incubation at room temperature for 25 min in the dark followed. A tryptic digest was performed overnight at 37°C. The next day, the peptides were puri-fied via STAGE tip (Rappsilber et al, 2007).
For in-gel digestion, protein mixtures were separated by SDS– PAGE using 4–12% Bis–Tris mini gradient gels (NuPAGE, Invitro-gen, Darmstadt, Germany). The gel lanes were cut into 10 equal
slices, which were in-gel digested with trypsin (Promega,
Mannheim, Germany) (Shevchenko et al, 2006), and the resulting peptide mixtures were processed on STAGE tips. The effect of
oncogene overexpression on global protein abundance was
measured from WCL of SILAC-labeled CaCo-2tet cells that were lysed in 4% SDS in 100 mM Tris pH 7.6. Lysates were denatured and reduced at 95°C with 1 mM DTT followed by alkylation with 5.5 mM iodoacetamide at room temperature in the dark. Samples were conducted to an in-gel digest as described above. For MS analysis of BRAF interaction partners, an anti-HA IP was performed as described above with WCL of SILAC-labeled CaCo-2tet cells. Eluted proteins were alkylated and processed as described above to in-gel digest.
MS analysis
Mass spectrometric measurements were performed on LTQ Orbi-trap XL mass spectrometer (Thermo Fisher Scientific, Langensel-bold, Germany) coupled to an Agilent 1200 nanoflow–HPLC (Agilent Technologies GmbH, Waldbronn, Germany) or a NanoLC Ultra (Eksigent, AB Sciex, Radio Rd Redwood City, CA, USA).
HPLC-column tips (fused silica) with 75lm inner diameter (New
Objective, Woburn, MA, USA) were self-packed (Ishihama et al, 2002) with Reprosil–Pur 120 ODS–3 (Dr. Maisch, Ammerbuch, Germany) to a length of 20 cm. Samples were applied directly onto the column without pre-column. A gradient of A (0.5% acetic acid (high purity, LGC Promochem, Wesel, Germany) in water and B (0.5% acetic acid in 80% ACN (LC–MS grade, Wako Chemicals GmbH, Neuss, Germany) in water) with increasing organic proportion was used for peptide separation (loading of sample with 2% B; separation ramp: from 10 to 30% B within 80 min). The flow rate was 250 nl/min and for sample applica-tion 500 nl/min. The mass spectrometer was operated in the data-dependent mode and switched automatically between MS
(max. of 1× 10⁶
ions) and MS/MS. Each MS scan was followed by a maximum of five MS/MS scans in the linear ion trap using normalized collision energy of 35% and a target value of 5,000.
Parent ions with a charge state from z= 1 and unassigned charge
states were excluded for fragmentation. The mass range for MS was 370–2,000 m/z. The resolution was set to 60,000. MS param-eters were as follows: spray voltage 2.3 kV; no sheath and auxil-iary gas flow; ion transfer tube temperature 125°C.
Identification of proteins and protein ratio assignment using MaxQuant
The MS raw data files were uploaded into the MaxQuant software (Cox & Mann, 2008) version 1.3.0.5., which performs peak detection, label-free quantification, and generates peak lists of mass error