Farming plant cooperation in crops
Germain Montazeaud
a,b,†, François Rousset
c, Florian Fort
b, Cyrille Violle
d, Hélène Fréville
a,*and Sylvain Gandon
d,*aAGAP, Université de Montpellier, CIRAD, INRAE, Montpellier SupAgro, Montpellier, France b CEFE, Université de Montpellier, Montpellier SupAgro, CNRS, EPHE, IRD, Université Paul Valéry,
Montpellier, France
c ISEM, Université de Montpellier, CNRS, EPHE, IRD, Montpellier, France
d CEFE, Université de Montpellier, CNRS, EPHE, IRD, Université Paul Valéry, Montpellier, France * These authors contributed equally to this work
†
Corresponding author:
[email protected]
Authorship statement: SG, GM, FR and HF conceptualized the model, with inputs from FF
and CV. GM ran the simulations. GM wrote the first draft of the manuscript, and all authors
contributed substantially to revisions.
Data statement: No datasets were used during the current study. Scripts used for the analysis
and simulations are available at https://github.com/germmtz/farming-plant-cooperation
Keywords: Crops – cooperation – kin selection – domestication – plant breeding
Article type: Research article
Number of words: 3592 words in the main text, 147 words in the abstract, 1468 words in the
references
Number of references: 60
Number of figures: 4
1 2 3 4 6 7 8 9 10 11 12 13 14 15 16 17 18 19 20 21 22 23 24Number of tables: 0
25Abstract
Selection of the fittest can promote individual competitiveness but often results in the erosion of group performance. Recently, several authors revisited this idea in crop production and proposed new practices based on selection for cooperative phenotypes, i.e. phenotypes that increase crop yield through decreased competitiveness. These recommendations, however, remain difficult to evaluate without a formal description of crop evolutionary dynamics under different selection strategies. Here, we develop a theoretical framework to investigate the evolution of cooperation-related traits in crops, using plant height as a case study. Our model is tailored to realistic agricultural practices and shows that combining high plant density, high relatedness and selection among groups favours the evolution of shorter plants that maximize grain yield. Our model allows us to revisit past and current breeding practices in light of kin selection theory, and yields practical recommendations to increase cooperation among crops and promote sustainable agriculture.
26 27 28 29 30 31 32 33 34 35 36 37
Introduction
Ever since the dawn of Agriculture, humans have imposed artificial selection on plants to increase the quality and the quantity of crop production [1,2]. The domestication of wild species led to the selection of phenotypes that would never have been favoured by natural selection under
unmanaged conditions, such as the loss of seed dispersal or the decrease in defence compounds production [3,4]. This was further amplified in the 20th century with the progressive mechanization of field work and the increasing use of herbicides and fertilizers. Agronomists indeed observed that varieties with weak competitive abilities performed better than competitive ones under such conditions [5–7]. This led Donald to define a cereal ideotype designed to perform “as a community” by having a set of phenotypic characteristics such as a short stem, few tillers and few erected leaves [5]. As such, Donald disseminated the idea that phenotypes which maximize group productivity, or crop yield, also decrease individual competitiveness.
This idea was further generalized as the “Tragedy of the commons” (TOC): phenotypes that maximize group performance are necessarily sub-optimal for individual performance, making them susceptible to invasion by selfish phenotypes [8]. TOCs were widely investigated in crops using Evolutionary Game Theory (EGT) approaches (reviewed in [9]), most studies concluding that humans have to work against natural selection to prevent invasions of the best performing groups by
competitive phenotypes. This was early observed by plant breeders in bulk breeding programs, where the most favourable phenotypes for yield, such as short plants, were lost over few generations due to intraspecific competition [6,7,10].
At the same time, the evolutionary biologist William Hamilton formalized the kin selection theory which aimed at understanding the evolution of social interactions, notably altruism where individuals act to increase the fitness of their social partners at the expense of their own reproduction [11,12]. Hamilton proposed a very simple rule which states that altruistic phenotypes can be selected if the fitness cost for the actor, c, is outweighed by the benefit received by the partners, b, weighted by the relatedness between the actor and the partners, R, i.e. when c < Rb. With this rule, Hamilton 38 39 40 41 42 43 44 45 46 47 48 49 50 51 52 53 54 55 56 57 58 59 60 61 62 63
explicitly incorporated the contribution of relatives in transmitting genes that are shared with the actor to the next generations. Later works have emphasized that –c+Rb provides a representation of the average effect of an allelic substitution on individual fitness (e.g. [13]) rather than an alternative to individual fitness: -c+Rb gives the expected effects of copies of an allele in different individuals on the expected fitness of individuals who bear the allele. Kin selection has been extremely successful in explaining a wide range of altruistic phenotypes such as sterility in eusocial insects [12] or helping behaviours in birds [14], and it has received increasing attention in plants in recent decades (reviewed in [15]).
Since farmers are more interested in productivity per unit area than in individual plant productivity, it was early advanced that plant breeding should take advantage of the mechanisms that maximize group productivity to increase crop yield [16]. More recently, several authors argued that plant breeding had not fully explored the trade-off between group productivity and individual performance and that significant yield gain could be achieved by reversing past natural selection for competitiveness [17–20]. To do so, recommendations drawn from the general principles of kin selection or group selection have been proposed [17,18,20–22]. Yet, it remains difficult to assess the extent to which plant breeding could benefit from these principles as long as they are not formally applied to crops.
Current crop improvement programs do not explicitly take into account social interactions among plants [18,21]. Conversely, significant work has been achieved to integrate the effects of social interactions into farm animals breeding programs [23]. Indeed, reducing competitiveness among group-housed animals is critical for both productivity and animal welfare [24]. Based on the early work of Griffing [25], quantitative genetic models have been developed to account for the effect of the genes of the focal individual on its own phenotypic traits, known as the direct genetic effect (DGE), and the effects of the genes of individuals interacting with the focal individual, known as the indirect genetic effect (IGE) [26–28]. Experiments have shown that IGEs can represent a significant proportion of the heritable variation on traits such as growth rate in pigs [29] or survival rate in laying hens [30]. Therefore, the genetic response to selection can significantly be improved by accounting for IGEs 64 65 66 67 68 69 70 71 72 73 74 75 76 77 78 79 80 81 82 83 84 85 86 87 88 89 90
[26]. Theoretical studies have shown how the IGEs frameworks connects with kin selection theory and how relatedness affects the genetic response to selection in presence of IGEs [31,32]. To a lesser extent, this framework has also been applied in tree breeding [33,34]. Yet we still poorly understand how social interactions affect the evolution of plant phenotypes, and the extent to which crop breeding schemes can improve yield depending on the intensity of social interactions.
To fill these gaps, we develop a kin selection model to investigate the evolution of cooperation in crops. The model allows us to identify the most important parameters that promote cooperation and increase crop yield, and to revisit crop evolutionary history in light of the kin selection theory.
Methods
We define cooperation as the evolution of a phenotype that decreases the intensity of
intraspecific competition. We focus on competition for light, using plant height as the competitive trait for three main reasons. Over the different axes of phenotypic variation in plants, height is classically reported as the main driver of competitive ability [35,36]. Second, the impact of competition for light on plant fitness has been widely documented [35,37,38] including in crops [39,40], enabling us to have a reasonably realistic mathematical formalism. Finally, plant height is one of the traits for which we have important historical data in crops [41–44], making it possible to interpret our results in light of human selection practices. It must be stressed that we deliberately kept the mechanistic and genetic aspects of the model simple to focus on processes of interest in this study, which are evolutionary dynamics and their interaction with human practices.
Crop populations are spatially structured, either in fields when grown by a farmer, or in experimental plots when evaluated by a plant breeder. In our model we assume that the crop
population is made of nF fields, with nP plants per field. In agreement with experimental evidence on
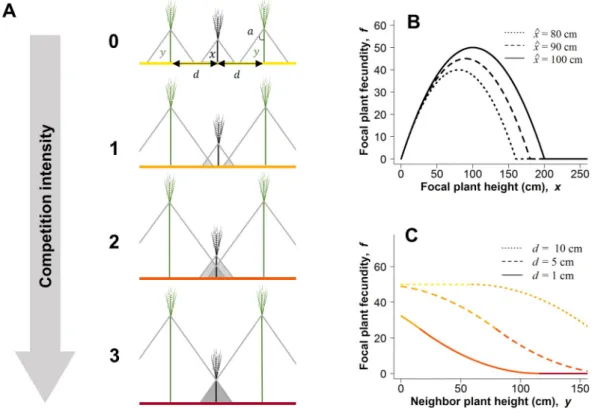
several crop species [39,41], we assume that there is an optimal height ^x that maximizes plant
fecundity, i.e. individual seed production, in the absence of competition for light (Fig. 1B). We model competition for light with the drop shadows of neighbouring plants (Fig. 1A). Plant fecundity is assumed to decrease proportionally to the size of the overlapping area between drop shadows and thus 91 92 93 94 95 96 97 98 99 100 101 102 103 104 105 106 107 108 109 110 111 112 113 114 115 116
with the height of the neighbours, as observed in experimental studies [35,38,40](Fig. 1C). One of the main parameters that drives intraspecific competition in crops is plant density [5,40]. In the model, plant density is governed by the parameter d, the distance between plants. The intensity of competition for light also depends on the angle a at the apex of the triangle used to represent drop shadows (Fig. 1A). We computed crop yield as the total number of seeds produced in a field divided by the field area (see Supplementary Information section 1.1). As expected, the plant height that maximises crop yield decreases with the distance between plants (Fig. 3 and Fig. S2), and crop yield is maximized by growing short plants at high density [5,40]. To fit as closely as possible to the specifics of real crops such as wheat, we set the optimal plant height^xto 100 cm and the angle a to π/50 rad. Such a small angle allowed us to generate a moderate and realistic intensity of competition at low plant-plant distances such as those classically encountered in cereals. Note that the choice of parameter values did not affect our results qualitatively.
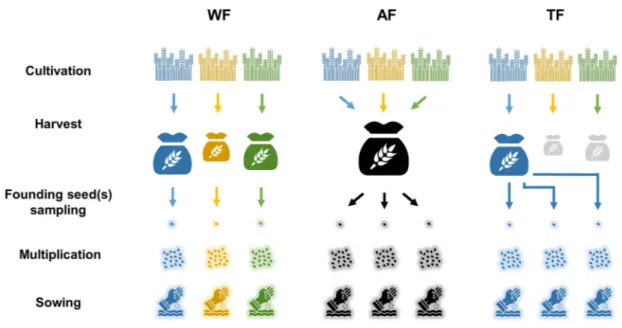
We compared the efficiency of three selection strategies. In the Within-Field (WF) strategy, seeds sown in a given field are exclusively sampled in the harvest of this same field; in the Among-Field (AF) strategy, fields are sown with seeds sampled after pooling the harvest of all fields; in the Top-Field (TF) strategy, fields are sown with seeds exclusively sampled in the harvest of the most productive field. In the WF strategy, the best performing plants within their fields contribute more to the next generation, whereas in the AF strategy, the best performing fields within the crop population contribute more to the next generation, this phenomenon being magnified in the TF strategy.
Relatedness, a key parameter of kin selection theory, is modulated by the parameter nS, the number of
founding seeds (Supplementary Information section 1.3 and Fig. S3). For cases where nS<nP, we multiply each founding seed in equal proportion, i.e. no selection during this step, until we obtain enough seeds to have nP plants in each field.
We developed an analytical model from which we derived approximations for the
Evolutionary Stable Strategy (ESS) for plant height, that is the strategy that cannot be invaded by any alternative strategy [45] (Supplementary Information section 1.2). The ESS approach is widely used in 117 118 119 120 121 122 123 124 125 126 127 128 129 130 131 132 133 134 135 136 137 138 139 140 141 142
evolutionary biology to predict the outcome of long-term evolutionary processes where fitness depends on the frequencies of the different phenotypes present in the population. In our study, we adopt the kin selection approach to account for the spatial structure of crops [46]: as mentioned above, the crop population is distributed into different fields, or different groups, that can be connected by migration. These groups delineate social interactions: individuals only interact within groups. The evolution of social traits is driven by the genetic similarity between actors and recipients and thus by genetic similarity between group members at the loci involved in social traits [12]. Relatedness (R) quantifies this similarity and measures the extent to which an actor is more likely to share an allele (and thus share a common phenotype) with an individual sampled in its own group than with an individual sampled in another group [47,48] (Supplementary Information section 1.3). Compared to traditional definitions of relatedness from pedigrees, the definition of relatedness used here averages pedigree relatedness over the distribution of pedigrees of gene copies within groups [49]. As this distribution depends on other features of the life cycle such as migration rates, relatedness depends on the life cycle (Fig. S3).
In addition to the ESS approach, we ran individual-based simulations to track the evolution of plant height across generations (Supplementary Information section 1.4): we simulated the life cycle of all plants from sowing to harvest over thousands of generations until the selection-drift-mutation equilibrium was reached. Finally, we compared the mean plant height at equilibrium with ESS approximations. We hereafter present ESS and simulation results for the three selection strategies (WF, AF, and TF) with varying planting density and relatedness.
Results
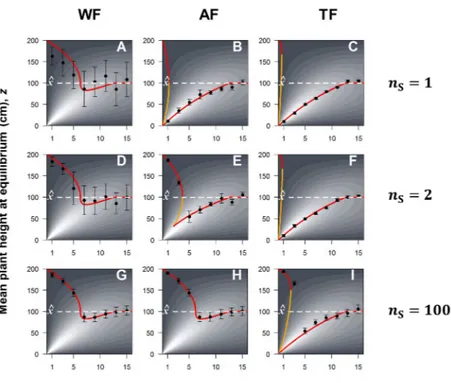
Overall, ESS predictions agreed very well with simulation results and equilibriums were always monomorphic, meaning that a single phenotype was present in the population at the end of the simulations (Fig. 3, black dots). When plants were grown at low densities (d > 12), they did not compete for light and thus the mean phenotype at equilibrium was the optimal phenotype for
individual fecundity, i.e. ^x (competition intensity 0 in Fig. 1A). At intermediate densities (7 < d < 12), 143 144 145 146 147 148 149 150 151 152 153 154 155 156 157 158 159 160 161 162 163 164 165 166 167 168
plants evolved smaller than their optimal phenotype in all scenarios. Indeed, when competition is low (competition intensity 1 in Fig. 1A), shorter phenotypes result in greater plant fecundity because the fecundity loss incurred by moving away from the optimum is overcompensated by the fecundity gain obtained by avoiding the shadow of the neighbours. At high densities (d < 7), where competition is more intense (competition intensity 2 in Fig. 1A), evolutionary outcomes differed greatly among scenarios. With the WF strategy, the higher the density (the lower d), the taller the plant evolved. At equilibrium, plant were well above the optimal height ^x, leading to very low yields whatever the number of founding seeds (Fig. 3A, D, and G). In contrast, both AF and TF strategies resulted in the evolution of short high-yielding phenotypes when the number of founding seeds was low (Fig. 3B, C, and F). Increasing the number of founding seeds reduced relatedness (Fig. S3), drove the evolution of taller plants, and lowered crop yield (Fig. 3E, H, and I). Shorter phenotypes evolved under the TF strategy compared to the AF strategy, as a result of stronger selection among fields in the TF strategy (Fig. 3E and F). Interestingly, with both AF and TF strategies, two alternative evolutionary outcomes were possible for certain ranges of d (e.g. Fig. 3E when 2 < d < 3.5 cm). When such evolutionary bistability occurred, which evolutionary outcome was reached depended on the initial phenotypic value of the population (Fig. S4).
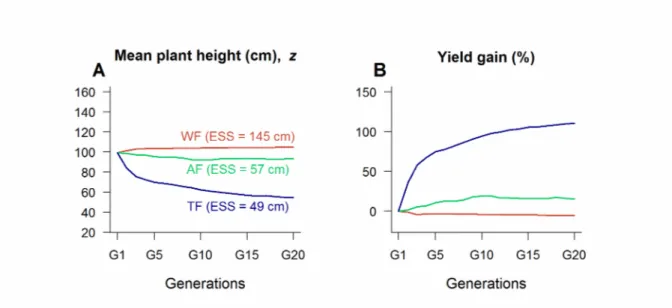
The ESS analysis captures the long-term evolutionary outcome of the model but does not predict the speed of phenotypic evolution towards the ESS. To explore the short-term evolutionary dynamics of plant height under realistic agricultural practices, we carried out individual-based simulations under the three selection strategies for 20 generations with a small number of fields ( nF=5 , Fig. 4). The WF strategy and the AF strategy generated slow evolution compared to the TF strategy (Fig. 4A). Consequently, the relative efficiency in increasing yield differed markedly among selection strategies: after 20 generations, yield had decreased by 5% with the WF strategy whereas it has increased by 15% with the AF strategy and by 110 % with the TF strategy (Fig. 4B).
169 170 171 172 173 174 175 176 177 178 179 180 181 182 183 184 185 186 187 188 189 190 191 192
Discussion
While most studies concluded that phenotypes which maximize group productivity are not evolutionary stable [9,50], our model demonstrates that evolutionary principles can be used to select for cooperation and increase crop yield. Our results thus provide new insights into the relative importance of parameters that could be used to select for cooperation in breeding programs. First, as widely acknowledged in agronomy, plant density has a critical role in controlling the balance between individual competitiveness and group performance [17]. The closer the plants, the stronger the direct and indirect fitness effects, resulting in stronger selection for either selfish tall phenotype or altruistic short phenotype depending on relatedness. Yet, the effect of density is not monotonic. Therefore, the phenotypic value of the crop population at the beginning of the breeding program can constrain selection even if all conditions are met for cooperation to evolve. For example, starting with tall plants might hamper the evolution of short phenotypes. Second, although selection at the group level is indeed mandatory to select altruistic phenotypes [17,18,21], our results demonstrate that group-level selection is not sufficient: when relatedness becomes too low, the AF and TF strategies fail to select for short phenotypes. More precisely, as the number of founding seeds increases, the within-field variability increases and the between-field variability decreases. This reduces relatedness and limits the ability to discriminate the different fields based on their productivity, thus reducing the strength of among-field selection. Such an important role of relatedness in interaction with group level selection has been missed in the literature on cultivated plants.
The potential of group selection in agriculture was early demonstrated in poultry. In a seminal experiment, Muir demonstrated that selection at the family level (half sib families) was very efficient to increase egg production and to reduce mortality in laying hens [51]. Moreover, such practices have been shown experimentally to be more efficient when groups are composed of relatives [26]. These results are in line with our study and previous theoretical works in quantitative genetics showing that relatedness and the degree of group selection jointly affect genetic response to selection [31,32]. More generally, the convergence between our results and the findings obtained in quantitative genetics and animal breeding literature suggest that the principles and the tools (e.g. mixed model [26,34]) 193 194 195 196 197 198 199 200 201 202 203 204 205 206 207 208 209 210 211 212 213 214 215 216 217 218 219
developed in these areas could be applied in crops whenever breeding programs can rely on strong phenotyping efforts.
In crops, the very common pedigree selection is quite similar to the TF strategy, at least in the last generations of selection where plots are planted with single genotypes, and only the most
productive plots are retained from one generation to another, which generates both among-field selection and high relatedness. Yet, as mentioned in previous studies, such programs could be even more efficient in improving yield by increasing plant density [17] and by selecting at the group level from the very beginning [21]. In practice, the TF strategy could be implemented with a number of experimental plots as limited as 5, with 200 or 300 plants per plot (Figure 4). Increasing the number of plots would increase the effective population size and thus increase the evolutionary speed. To take into account the effect of environmental variability on the evaluation of crop yield and on the selection procedure, it could be useful to replicate the plots or to sample founding seeds in a handful of the most productive fields (Figure S5). Then, founding seeds could be multiplied in a greenhouse between two growing seasons by growing plants at low densities to maximize the seed multiplication rate.
Controlled or uncontrolled crosses could be used to generate new allelic combinations and new phenotypes over generations.
Our results shed new light on the evolution of plant height during the evolutionary history of crops. For most cereals, plant height has increased between their wild ancestor and their earliest domesticated form [42,43]. Moreover, most of these primitive domesticated forms remained tall, or even evolved taller until the end of the 19th century [4]. The practices associated with the transition from gathering to cultivation [1], as well as the most common selection method over this period, namely mass selection, could be regarded in light of the kin selection: grains were collected from isolated plants (or low-density grown plants), these plants being selected for their individual features, and grains (or spikes) from different plants being mixed before sowing [52]. Such practices leading to low among-field selection and low relatedness inevitably select for selfish phenotypes. Even if tallness might have deliberately been selected for other needs such as chaff production or weed control [4], our model suggests that mass selection might have reinforced selection for increased plant height.
220 221 222 223 224 225 226 227 228 229 230 231 232 233 234 235 236 237 238 239 240 241 242 243 244 245 246
Initiating breeding programs with plants that are too tall can hamper the evolution of short high-yielding phenotypes. This might have happened at least twice in the evolutionary history of crops. First, there is evidence that farmers chose relatively tall plants in the wild to start cultivation [53]. Second, for most cereals the main reduction in plant height was achieved in the 1960’s by introgressing dwarf genes from Asian varieties [54]. At that time, most wheat varieties were very tall in U.S.A [55] and Europe [41], and we could wonder whether plant breeding would have achieved such shortening by crossing and selecting among the local pool varieties.
Reducing plant height in crops was motivated by the need for varieties that better respond to intensive cultivation practices, notably through increased allocation to grains and decreased sensitivity to lodging [56]. Although such varieties achieved significant yield gain, yield improvement was perceived more as an improvement in individual plant properties, i.e. grain allocation and lodging resistance, than as an improvement in community properties, i.e. lower intraspecific competition [41]. As a consequence, plant height is still mainly selected at the single-plant level by eliminating tall plants in the early steps of breeding programs than through indirect selection for group performance, as described in this study. Such direct selection on a plant trait can indeed prove very efficient when the trait measurement is cheap and heritable, which might not be the case of all traits involved in plant-plant interactions.
We explored particular combinations of parameters that we thought relevant for a typical cereal crop. Yet, additional selection scenarios could be evaluated for applications in a broader set of crops including non-grain crops. Moreover, traits other than plant height can be important in driving competitive interactions. For example, root morphological traits can play a key role in the competition for soil resources in perennial species [57]. Flower size might also be important for cross-pollinated species [58]. More generally, many traits have been reported to be involved in plant-plant interactions, which offer as many opportunities to increase cooperation in crops [9]. Because of recurrent
bottlenecks during the evolutionary history of crops [59] and historical practices of cultivation and breeding (see above for an illustration for plant height), altruistic phenotypes might have been lost in the pool of modern varieties. As illustrated with dwarf genes introduced from Japan, it might thus be 247 248 249 250 251 252 253 254 255 256 257 258 259 260 261 262 263 264 265 266 267 268 269 270 271 272 273
useful to further enlarge phenotypic variation available at the start of breeding programs by exploring gene pools such as landraces or wild relatives. Moreover, studying the genetic determinism of these traits could help to select for optimized mixtures of genotypes instead of mono-genotypic varieties. Indeed, not all genes need to be shared in the population for cooperation to evolve, only those involved in competitive interactions. In practice, the identification of specific genes (or linked molecular markers) encoding for competitive traits would allow to sample individuals which are highly related only at these specific loci instead of sampling individuals which are highly related on the whole genome, as illustrated in this study. These practices could select for mixtures of varieties that combine low variability on traits related to competitive ability and high variability on traits linked to other functions such as pathogen resistance, resource-use or stress tolerance. Such mixtures of varieties combining the positive effects of cooperation and biodiversity could help farmers facing the need for more sustainable agriculture [60].
274 275 276 277 278 279 280 281 282 283 284 285
Acknowledgments
We thank R. F. Denison, S. A. West, J. Biernaskie, J. David and A. Rodrigues for helpful comments on earlier versions. We thank V. Ranwez for his assistance in the development of the simulation algorithm. This work was supported by a PhD grant from the Ministère de l’Enseignement Supérieur, de la Recherche et de l'Innovation to GM, the CIRAD - UMR AGAP HPC Data Center of the South Green Bioinformatics platform (htttp://www.southgreeen.fr/), and the European Research Council (ERC) Starting Grant Project “Ecophysiological and biophysical constraints on domestication in crop plants” (Grant ERC-StG-2014-639706-CONSTRAINTS).
286 287 288 289 290 291 292 293
REFERENCES
1. Harlan JR, Wet JMJ de, Price EG. 1973 Comparative evolution of cereals. Evolution 27, 311–325. (doi:10.1111/j.1558-5646.1973.tb00676.x)
2. Meyer RS, DuVal AE, Jensen HR. 2012 Patterns and processes in crop domestication: an
historical review and quantitative analysis of 203 global food crops. New Phytologist 196, 29–48. (doi:10.1111/j.1469-8137.2012.04253.x)
3. Darwin C. 1859 On the origin of species by means of natural selection. London: John Murray. 4. Donald CM, Hamblin J. 1983 The convergent evolution of annual seed crops in agriculture. In
Advances in Agronomy (ed NC Brady), pp. 97–143. Academic Press. (doi:10.1016/S0065-2113(08)60353-3)
5. Donald CM. 1968 The breeding of crop ideotypes. Euphytica 17, 385–403. (doi:10.1007/BF00056241)
6. Jennings PR, Jesus J de. 1968 Studies on competition in rice I. Competition in mixtures of varieties. Evolution 22, 119–124. (doi:10.1111/j.1558-5646.1968.tb03455.x)
7. Jennings PR, Herrera RM. 1968 Studies on competition in rice II. Competition in segregating populations. Evolution 22, 332–336. (doi:10.1111/j.1558-5646.1968.tb05901.x)
8. Hardin G. 1968 The tragedy of the commons. Science 162, 1243–1248. (doi:10.1126/science.162.3859.1243)
9. Anten NPR, Vermeulen PJ. 2016 Tragedies and crops: understanding natural selection to improve cropping systems. Trends in Ecology & Evolution 31, 429–439. (doi:10.1016/j.tree.2016.02.010) 10. Suneson CA, Wiebe GA. 1942 Survival of barley and wheat varities in mixtures. Journal of the
American Society of Agronomy 34, 1052–1056.
11. Hamilton WD. 1964 The genetical evolution of social behaviour. I. Journal of Theoretical Biology 7, 1–16. (doi:10.1016/0022-5193(64)90038-4)
12. Hamilton WD. 1964 The genetical evolution of social behaviour. II. Journal of Theoretical Biology 7, 17–52.
13. Dawkins R. 1982 The extended phenotype. Oxford University Press Oxford.
14. Emlen ST, Wrege PH. 1988 The role of kinship in helping decisions among white-fronted bee-eaters. Behavioral Ecology and Sociobiology 23, 305–315. (doi:10.1007/BF00300577)
15. File AL, Murphy GP, Dudley SA. 2012 Fitness consequences of plants growing with siblings: reconciling kin selection, niche partitioning and competitive ability. Proceedings of the Royal Society B-Biological Sciences 279, 209–218. (doi:10.1098/rspb.2011.1995)
16. Harper JL. 1977 Population biology of plants. London: Academic Press.
17. Weiner J, Andersen SB, Wille WK-M, Griepentrog HW, Olsen JM. 2010 Evolutionary
Agroecology: the potential for cooperative, high density, weed-suppressing cereals. Evolutionary Applications 3, 473–479. (doi:10.1111/j.1752-4571.2010.00144.x) 294 295 296 297 298 299 300 301 302 303 304 305 306 307 308 309 310 311 312 313 314 315 316 317 318 319 320 321 322 323 324 325 326 327 328 329
18. Denison RF, Kiers ET, West SA. 2003 Darwinian Agriculture: when can humans find solutions beyond the reach of natural selection? The Quarterly Review of Biology 78, 145–168.
(doi:10.1086/374951)
19. Denison RF. 2012 Darwinian Agriculture: how understanding evolution can improve agriculture. Princeton; Oxford: Princeton University Press.
20. Weiner J, Du Y-L, Zhang C, Qin X-L, Li F-M. 2017 Evolutionary agroecology: individual fitness and population yield in wheat (Triticum aestivum). Ecology 98, 2261–2266.
(doi:10.1002/ecy.1934)
21. Murphy GP, Swanton CJ, Acker RCV, Dudley SA. 2017 Kin recognition, multilevel selection and altruism in crop sustainability. Journal of Ecology 105, 930–934. (doi:10.1111/1365-2745.12787) 22. Kiers ET, Denison RF. 2014 Inclusive fitness in agriculture. Philosophical Transactions of the
Royal Society B-Biological Sciences 369, 20130367. (doi:10.1098/rstb.2013.0367)
23. Wade MJ, Bijma P, Ellen ED, Muir W. 2010 Group selection and social evolution in domesticated animals. Evolutionary Applications 3, 453–465. (doi:10.1111/j.1752-4571.2010.00147.x)
24. Rodenburg T, Bijma P, Ellen E, Bergsma R, De Vries S, Bolhuis J, Kemp B, Van Arendonk J. 2010 Breeding amiable animals? Improving farm animal welfare by including social effects in breeding programmes. Animal Welfare 19, 77–82.
25. Griffing B. 1967 Selection in reference to biological groups. I. Individual and group selection applied to populations of unordered groups. Australian Journal of Biological Sciences 20, 127– 139.
26. Muir WM. 2005 Incorporation of competitive effects in forest tree or animal breeding programs. Genetics 170, 1247–1259. (doi:10.1534/genetics.104.035956)
27. Bijma P, Muir WM, Van Arendonk JAM. 2007 Multilevel selection 1: Quantitative genetics of inheritance and response to selection. Genetics 175, 277–288. (doi:10.1534/genetics.106.062711) 28. Bijma P, Muir WM, Ellen ED, Wolf JB, Van Arendonk JAM. 2007 Multilevel selection 2:
Estimating the genetic parameters determining inheritance and response to selection. Genetics
175, 289–299. (doi:10.1534/genetics.106.062729)
29. Bergsma R, Kanis E, Knol EF, Bijma P. 2008 The contribution of social effects to heritable variation in finishing traits of domestic pigs (Sus scrofa). Genetics 178, 1559–1570. (doi:10.1534/ genetics.107.084236)
30. Ellen ED, Visscher J, van Arendonk J a. M, Bijma P. 2008 Survival of laying hens: Genetic parameters for direct and associative effects in three purebred layer lines. Poultry Science 87, 233–239. (doi:10.3382/ps.2007-00374)
31. Bijma P, Wade MJ. 2008 The joint effects of kin, multilevel selection and indirect genetic effects on response to genetic selection. Journal of Evolutionary Biology 21, 1175–1188.
(doi:10.1111/j.1420-9101.2008.01550.x)
32. McGlothlin JW, Wolf JB, Brodie ED, Moore AJ. 2014 Quantitative genetic versions of
Hamilton’s rule with empirical applications. Philosophical Transactions of the Royal Society B: Biological Sciences 369. (doi:10.1098/rstb.2013.0358)
330 331 332 333 334 335 336 337 338 339 340 341 342 343 344 345 346 347 348 349 350 351 352 353 354 355 356 357 358 359 360 361 362 363 364 365 366 367 368
33. Cappa EP, Cantet RJC. 2008 Direct and competition additive effects in tree breeding: Bayesian estimation from an individual tree mixed model. Silvae Genetica 57, 45–56. (doi:10.1515/sg-2008-0008)
34. Costa e Silva J, Kerr RJ. 2013 Accounting for competition in genetic analysis, with particular emphasis on forest genetic trials. Tree Genetics & Genomes 9, 1–17. (doi:10.1007/s11295-012-0521-8)
35. Gaudet CL, Keddy PA. 1988 A comparative approach to predicting competitive ability from plant traits. Nature 334, 242–243. (doi:10.1038/334242a0)
36. Westoby M, Falster DS, Moles AT, Vesk PA, Wright IJ. 2002 Plant ecological strategies: some leading dimensions of variation between species. Annual Review of Ecology and Systematics 33, 125–159.
37. Weiner J. 1990 Asymmetric competition in plant populations. Trends in Ecology & Evolution 5, 360–364. (doi:10.1016/0169-5347(90)90095-U)
38. Violle C, Garnier E, Lecoeur J, Roumet C, Podeur C, Blanchard A, Navas M-L. 2009 Competition, traits and resource depletion in plant communities. Oecologia 160, 747–755. (doi:10.1007/s00442-009-1333-x)
39. Flintham JE, Börner A, Worland AJ, Gale MD. 1997 Optimizing wheat grain yield: effects of Rht (gibberellin-insensitive) dwarfing genes. The Journal of Agricultural Science 128, 11–25.
40. Donald CM. 1963 Competition among crop and pasture plants. In Advances in Agronomy (ed AG Norman), pp. 1–118. Academic Press. (doi:10.1016/S0065-2113(08)60397-1)
41. Austin RB, Bingham J, Blackwell RD, Evans LT, Ford MA, Morgan CL, Taylor M. 1980 Genetic improvements in winter wheat yields since 1900 and associated physiological changes. The Journal of Agricultural Science 94, 675–689. (doi:10.1017/S0021859600028665)
42. Roucou A, Violle C, Fort F, Roumet P, Ecarnot M, Vile D. 2018 Shifts in plant functional strategies over the course of wheat domestication. Journal of Applied Ecology 55, 25–37. (doi:10.1111/1365-2664.13029)
43. Milla R, Morente-López J, Alonso-Rodrigo JM, Martín-Robles N, Chapin FS. 2014 Shifts and disruptions in resource-use trait syndromes during the evolution of herbaceous crops. Proceedings of the Royal Society B-Biological Sciences 281, 20141429. (doi:10.1098/rspb.2014.1429)
44. Milla R et al. 2018 Phylogenetic patterns and phenotypic profiles of the species of plants and mammals farmed for food. Nature Ecology & Evolution 2, 1808. (doi:10.1038/s41559-018-0690-4)
45. Geritz SAH, Kisdi E, Mesze´NA G, Metz JAJ. 1998 Evolutionarily singular strategies and the adaptive growth and branching of the evolutionary tree. Evolutionary Ecology 12, 35–57. (doi:10.1023/A:1006554906681)
46. Taylor PD, Frank SA. 1996 How to make a kin selection model. Journal of Theoretical Biology
180, 27–37. (doi:10.1006/jtbi.1996.0075)
47. Frank SA. 1998 Foundations of Social Evolution. Princeton University Press.
48. Rousset F, Billiard S. 2000 A theoretical basis for measures of kin selection in subdivided populations: finite populations and localized dispersal. Journal of Evolutionary Biology 13, 814– 825. (doi:10.1046/j.1420-9101.2000.00219.x) 369 370 371 372 373 374 375 376 377 378 379 380 381 382 383 384 385 386 387 388 389 390 391 392 393 394 395 396 397 398 399 400 401 402 403 404 405 406 407 408 409
49. Rousset F. 2002 Inbreeding and relatedness coefficients: what do they measure? Heredity (Edinb)
88, 371–380. (doi:10.1038/sj.hdy.6800065)
50. Falster DS, Westoby M. 2003 Plant height and evolutionary games. Trends in Ecology & Evolution 18, 337–343. (doi:10.1016/S0169-5347(03)00061-2)
51. Muir WM. 1996 Group selection for adaptation to multiple-hen cages: selection program and direct responses. Poultry Science 75, 447–458. (doi:10.3382/ps.0750447)
52. Allard RW. 1960 Principles of plant breeding. John Wiley & Sons.
53. Cunniff J, Wilkinson S, Charles M, Jones G, Rees M, Osborne CP. 2014 Functional traits differ between cereal crop progenitors and other wild grasses gathered in the Neolithic Fertile Crescent. PLOS ONE 9, e87586. (doi:10.1371/journal.pone.0087586)
54. Peng J et al. 1999 ‘Green revolution’ genes encode mutant gibberellin response modulators. Nature 400, 256–261. (doi:10.1038/22307)
55. Cox TS, Shroyer JP, Ben-Hui L, Sears RG, Martin TJ. 1988 Genetic improvement in agronomic traits of hard red winter wheat cultivars 1919 to 1987. Crop Science 28, 756–760.
(doi:10.2135/cropsci1988.0011183X002800050006x)
56. Hedden P. 2003 The genes of the Green Revolution. Trends in Genetics 19, 5–9. (doi:10.1016/S0168-9525(02)00009-4)
57. Casper BB, Jackson RB. 1997 Plant competition underground. Annual review of ecology and systematics 28, 545–570.
58. Parachnowitsch AL, Kessler A. 2010 Pollinators exert natural selection on flower size and floral display in Penstemon digitalis. New Phytologist 188, 393–402.
59. Glémin S, Bataillon T. 2009 A comparative view of the evolution of grasses under domestication. New Phytologist 183, 273–290. (doi:10.1111/j.1469-8137.2009.02884.x)
60. Litrico I, Violle C. 2015 Diversity in plant breeding: a new conceptual framework. Trends in Plant Science 20, 604–613. (doi:10.1016/j.tplants.2015.07.007)
410 411 412 413 414 415 416 417 418 419 420 421 422 423 424 425 426 427 428 429 430 431 432 433 434
Figure 1 | Geometrical representation of plant competition for light. (A) We used triangles to
represent drop shadows around the plants (grey triangles). The focal individual is represented in black, neighbours are represented in green. Neighbours are positioned at equal distance, d, from the focal individual. For simplicity, we here represented the left and right neighbours with the same plant height, y. Competition for light happens when triangles overlap. Competition intensity increases with increasing overlap (from yellow to red), with no competition (competition intensity 0), low
competition (competition intensity 1), intermediate competition (competition intensity 2) and intense competition (competition intensity 3). (B) Relationship between focal plant fecundity, f, and focal plant height, x. We assumed that, for an isolated plant, there is an optimal plant height ^x which maximizes individual fecundity. The relationship is shown for three optimal plant height values ^x = 80 cm (dotted line), ^x = 90 cm (dashed line), and ^x = 100 cm (solid line). (C) Relationship between focal plant fecundity and neighbours’ plant height. We computed the cost of competition as the proportion of shaded area of the focal triangle. The relationship is shown for a focal plant height equal to the optimal plant height so that x = ^x = 100 cm, an angle a = π/50, and three plant-plant distances d = 10 cm (dotted line), d = 5 cm (dashed line), and d = 1 cm (solid line). Competition intensity increases from yellow to red. Symbol: “Wheat” by efi kaperoni from the Noun Project.
435 436 437 438 439 440 441 442 443 444 445 446 447 448 449 450
Figure 2 | Strategies of selection. The crop is grown in a farm composed of nF fields. Here, nF=3,
with fields respectively coloured in blue, yellow and green. In the Within-Fields (WF) selection strategy, fields are sown with seeds exclusively sampled in their own harvest. Consequently, the crop evolves separately in the different fields. In the Among-field (AF) selection strategy, seeds from the different fields are pooled together at harvest. Then, each field is sown with seeds sampled in that pool. In the Top-Field (TF) selection strategy, only the most productive field is retained for the next generation. Then, each field is sown with seeds exclusively sampled in the harvest of that top field. For all strategies, a multiplication stage precedes sowing when there are not enough founding seeds to re-populate the nFfields. Symbols: “Wheat” by lastspark from the Noun Project, “seed” by corpus
delicti from the Noun Project, and “sow” by Symbolon from the Noun Project. 451 452 453 454 455 456 457 458 459 460 461
Figure 3 | Relationship between the mean plant height in the meta-population at equilibrium, z, and the physical distance between plants, d. Evolutionary Stable Strategies (ESS) predicted from
the analytical model are reported as a red solid line. Results from individual based simulation are reported in black, with dots (error bars) representing the mean (standard deviation) plant height in the meta-population after 5000 generations. Grain yield is represented in the background of the graphs and increases with lighter grey shade (see Fig. S2). We tested the three seed selection strategies (WF, AF and TF) with three numbers of founding seeds nS = 1 (A, B, C), nS = 2 (D, E, F), and nS = 100 (G, H,
I). Simulations were performed with nF = 20 fields and nP = 200 plants per field. In the first
generation, the population was monomorphic, i.e. all plants had the same height z, with z = ^x = 100 cm. Phenotypic variability was then generated by mutations. Mutation rate equalled 10% meaning that on average 1 individual out of 10 differed in height from its parent. Mutation effect was set to ± 5 cm. We varied the plant-plant physical distance from 1 cm to 15 cm with steps of 2 cm. After 5000 generations, the selection-mutation-drift equilibrium was reached in all simulations. Orange solid lines represent unstable equilibriums, i.e. equilibriums at which any mutation makes the mean phenotype deviate further from its original value, either in the upward or in the downward direction.
462 463 464 465 466 467 468 469 470 471 472 473 474 475 476 477
Figure 4 | Selection efficiency. We modeled the evolution of plant height (A) and we measured the
yield gains (B) realized after 20 generations with the three selection strategies (WF in red, AF in green and TF in blue). We performed simulations with nF = 5 fields, nP = 200 plants per field, and a 5 cm
plant-plant distance. At generation 1 (G1), each field was initiated by sampling two founding seeds in a normally distributed plant population with mean and standard deviation on plant height respectively equal to 100 cm and 20 cm. For all subsequent generations, we draw two founding seeds in the harvest to repopulate each field. Funding seeds were multiplied in equal proportion (x 100 each) to obtain 200 seeds per field. Mutation rate was equal to 10% with a ± 5 cm mutation effect. Reported values are averaged over 20 simulation runs.
478 479 480 481 482 483 484 485 486