S1
Growth and Aggregation Regulate Clusters Structural Properties and Gel Time
Electronic Supplementary Information
Stefano Lazzari1*, Marco Lattuada2*
1Department of Chemical Engineering, Massachusetts Institute of Technology, 77, Massachusetts Avenue, Cambridge, Massachusetts 02139, USA
2Université de Fribourg, Adolphe Merkle Institute, Chemin des Verdiers 4, CH-1700 Fribourg, Switzerland
Corresponding authors
S2
Calculation of the hydrodynamic radius of a cluster made of interpenetrating particles having different sizes
In the following, we will use Kirkwood-Riseman (KR) theory extended to the case of clusters with partially-overlapping primary particles having different size.
We will begin by considering the general formalism of KR theory. For colloidal particles, the interactions with the surrounding fluid can be described in the framework of Stokes equations, according to which is the linear relationship between the hydrodynamic force experience by a particle and its relative velocity. The KR approach consists in writing that for each particle in a cluster the hydrodynamic force equals:
Fi= 6πηRP,i
(
ui− vi)
(1)where Fi is the force acting on the ith particle, ui is the ith particle velocity and vi is the fluid velocity at the center of the ith particle. The fluid velocity is written as a combination of the unperturbed fluid velocity and of the perturbations due to all other particles in the cluster. Assuming that there the unperturbed velocity of the fluid is zero, one can write:
vi= vi'= Tij⋅Fj
j=1≠ì N
∑
(2)In Equation(2), the tensor Tij provides the relationship between the force acting on particle j and the corresponding velocity perturbation caused by it at the center of particle i 1. By combining the two previous equations, we obtain the following result:
Fi = 6πηRP,i ui− Tij⋅Fj j=1≠ì N
∑
⎛ ⎝⎜ ⎞ ⎠⎟ (3)S3
By taking the angular average of Equation (3) (which amounts to considering the cluster as an isotropic object), and by summing over the total number of particles N in a cluster, we can obtain the following expression for the total hydrodynamic force acting on it:
FT = Fi i=1 N
∑
= 6πηRP,i ui− Tij ⋅Fj j=1≠ì N∑
⎛ ⎝⎜ ⎞ ⎠⎟ ⎡ ⎣ ⎢ ⎢ ⎤ ⎦ ⎥ ⎥ i=1 N∑
= 6πηRP,iu− 1 N 6πηRP,i Tij j=1≠ì N∑
i=1 N∑
FT i=1 N∑
(4)The latter equation can be rearranged as follows:
FT = 6πη RP,i i=1 N
∑
1+ 1 N 6πηRP,i Tij j=1≠ì N∑
i=1 N∑
u (5)This leads to the following expression for the hydrodynamic radius of a cluster:
RH = RP,i i=1 N
∑
1+ 1 N 6πηRP,i Tij j=1≠ì N∑
i=1 N∑
(6)The only open question about the above equation, is the necessity to use a suitable expression for the tensor Tij, valid for partially overlapping spheres with different sizes. This requires an extension of
Rotne-Prager-Yamakawa tensor, valid for equal size particles 2. Such an expression has been developed by Zuk et al.3:
S4 Tij= 1 8πηRij 1+ Rp,i2+ R p, j 2 3Rij2 ⎛ ⎝ ⎜ ⎞ ⎠ ⎟ I + 1− Rp,i 2+ R p, j 2 Rij2 ⎛ ⎝ ⎜ ⎞ ⎠ ⎟RRiRj ij 2 ⎛ ⎝ ⎜ ⎞ ⎠ ⎟ for Rij ≥ Rp.i+ Rp, j 1 6πηRp,iRp, j 16Rij3 R p,i+ Rp, j
(
)
− R⎛(
p,i− Rp, j)
2+ 3Rij2 ⎝ ⎞⎠ 2 32Rij3 ⎛ ⎝ ⎜ ⎜ ⎜⎜ ⎞ ⎠ ⎟ ⎟ ⎟⎟I + 3 R(
p,i− Rp, j)
2 − Rij2 ⎛ ⎝ ⎞⎠ 2 32Rij3 ⎛ ⎝ ⎜ ⎜ ⎜⎜ ⎞ ⎠ ⎟ ⎟ ⎟⎟ RiRj Rij2 ⎛ ⎝ ⎜ ⎜ ⎜ ⎜ ⎜ ⎜ ⎜ ⎜ ⎜⎜ ⎞ ⎠ ⎟ ⎟ ⎟ ⎟ ⎟ ⎟ ⎟ ⎟ ⎟⎟ for Rp,>− Rp,<≤ Rij≤ Rp,i+ Rp, j 1 6πηRp,> I for Rij≤ Rp,>− Rp,< ⎧ ⎨ ⎪ ⎪ ⎪ ⎪ ⎪ ⎪ ⎪ ⎪⎪ ⎩ ⎪ ⎪ ⎪ ⎪ ⎪ ⎪ ⎪ ⎪ ⎪ (7)By performing the orientation average, we obtain the following final result:
Tij = 1 6πηRij I for Rij ≥ Rp.i+ Rp, j 1 6πηRp,iRp, j Rp,i+ Rp, j
(
)
2 − Rij 4 − Rp,i− Rp, j(
)
2 4Rij ⎛ ⎝ ⎜ ⎜ ⎞ ⎠ ⎟ ⎟I for Rp,>− Rp,<≤ Rij ≤ Rp,i+ Rp, j 1 6πηRp,> I for Rij≤ Rp,>− Rp,< ⎧ ⎨ ⎪ ⎪ ⎪ ⎪ ⎩ ⎪ ⎪ ⎪ ⎪ (8)When Equation (8) is substituted in Equation (6), we obtain the general expression used for the calculation of the hydrodynamic radius of the clusters generated by the Monte Carlo code developed in this work.
S5 Convergence on NMAX
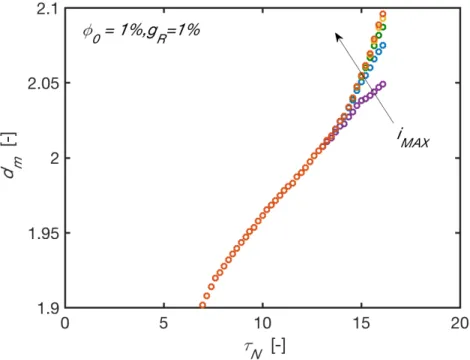
Figure S1 dm vs
τ
N in DLCA at φ0= 1% and gR=1.00% for different values of iMAX. Color code: violet iMAX =1000; blue iMAX =2000; green iMAX =3000; yellow iMAX =4000; red iMAX =5000.As iMAX =4000 and iMAX =5000 are superimposed, iMAX =5000 has been selected as the upper boundary of cluster mass to be considered for the calculation of dm
S6 DLCA case – kinetic information
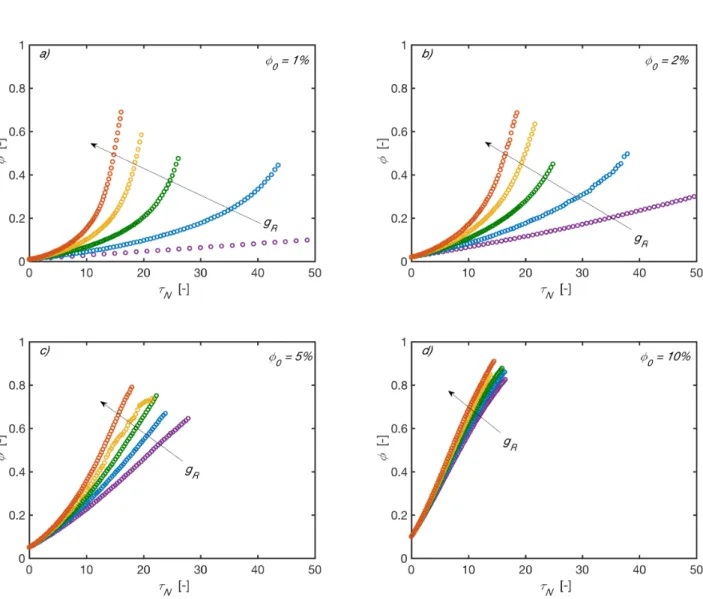
i) φ against
τ
NFigure S2 φ vs
τ
N in DLCA at different φ0 and gR. Color code: violet gR =0.00%; blue gR =0.25% ; green gR=0.50%; yellow gR=0.75%; red gR=1.00%S7 ii) NAVE against
τ
NFigure S3 NAVE vs
τ
N in DLCA at different φ0 and gR. Color code: violet gR =0.00%; blue0.25%
R
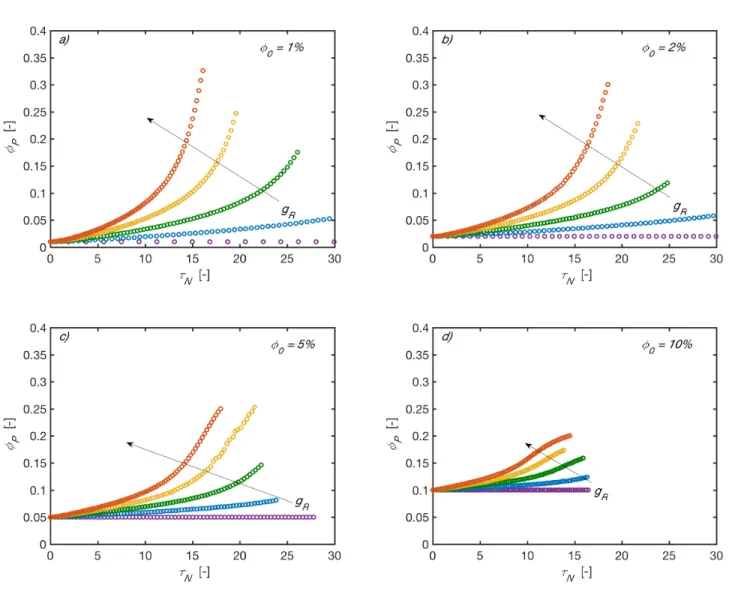
S8 iii) φP against
τ
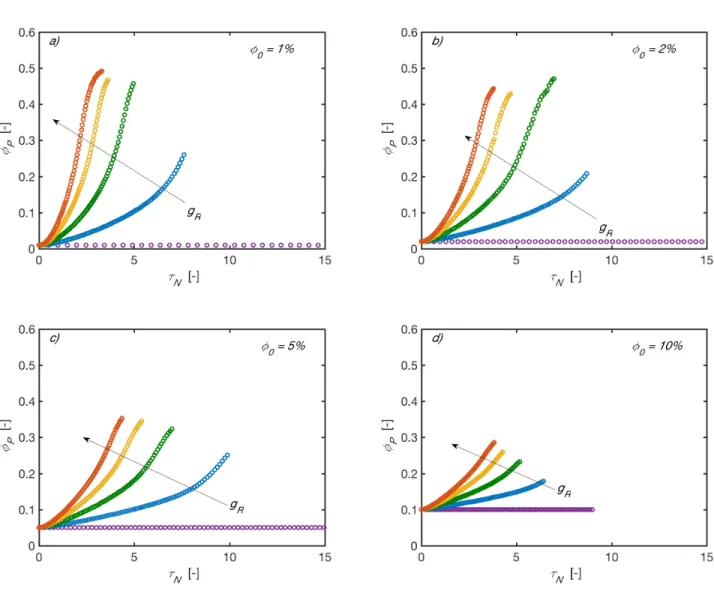
NFigure S4
φ
P vsτ
N in DLCA at different φ0 and gR. Color code: violet gR =0.00%; blue0.25%
R
S9 RLCA case – kinetic information
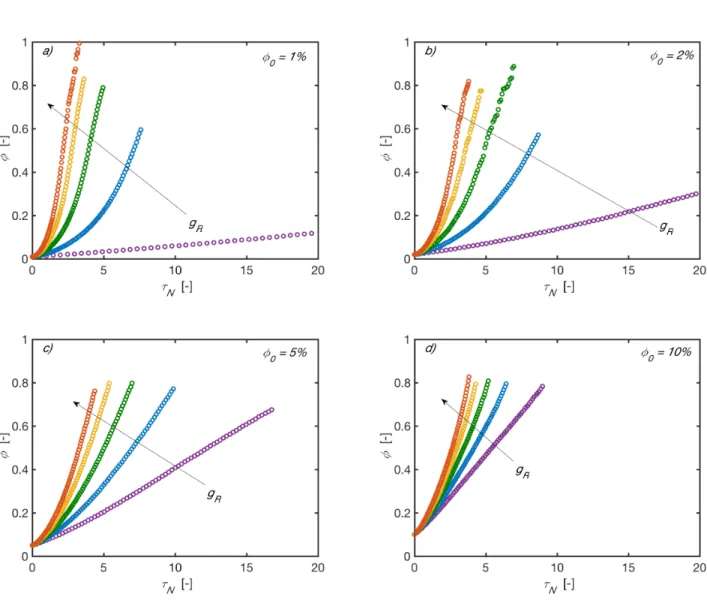
i) φ against
τ
NFigure S5 φ vs
τ
N in RLCA with pS =0.1 at different φ0 and gR. Color code: violet gR=0.00%; blue gR =0.25%; green gR =0.50%; yellow gR =0.75%; red gR =1.00%S10 ii) NAVE against
τ
NFigure S6 NAVE vs
τ
N in RLCA with pS =0.1 at different φ0 and gR. Color code: violet gR=0.00%; blue gR =0.25%; green gR =0.50%; yellow gR =0.75%; red gR =1.00%S11 iii) φP against
τ
NFigure S7
φ
P vsτ
N in RLCA at different φ0 and gR. Color code: violet gR =0.00%; blue0.25%
R
S12 References
1. Lattuada, M.; Wu, H.; Morbidelli, M. Hydrodynamic radius of fractal clusters. Journal of Colloid and Interface Science 2003, 268 (1), 96-105.
2. Lazzari, S.; Jaquet, B.; Colonna, L.; Storti, G.; Lattuada, M.; Morbidelli, M. Interplay between Aggregation and Coalescence of Polymeric Particles: Experimental and Modeling Insights. Langmuir 2015, 31 (34), 9296-9305.
3. Zuk, P. J.; Wajnryb, E.; Mizerski, K. A.; Szymczak, P. Rotne-Prager-Yamakawa approximation for different-sized particles in application to macromolecular bead models. Journal of Fluid Mechanics 2014, 741.