[12:49 12/11/2011 Bioinformatics-btr569.tex] Page: 3425 3425–3426
BIOINFORMATICS
APPLICATIONS NOTE
Vol. 27 no. 24 2011, pages 3425–3426doi:10.1093/bioinformatics/btr569Genome analysis
Advance Access publication October 12, 2011Visualization and quality assessment of de novo genome
assemblies
Oksana Riba-Grognuz
1,2,∗, Laurent Keller
1, Laurent Falquet
2, Ioannis Xenarios
2,3and
Yannick Wurm
1,2,∗,†1Department of Ecology and Evolution, University of Lausanne, 1015 Lausanne, Switzerland,2Vital-IT Group, Swiss
Institute for Bioinformatics, 1015 Lausanne and3Swiss-Prot Group, Swiss Institute of Bioinformatics, Centre Médical Universitaire, 1211 Geneva 4, Switzerland
Associate Editor: Alfonso Valencia
ABSTRACT
Summary: Recent technological progress has greatly facilitated de
novo genome sequencing. However, de novo assemblies consist in many pieces of contiguous sequence (contigs) arranged in thousands of scaffolds instead of small numbers of chromosomes. Confirming and improving the quality of such assemblies is critical for subsequent analysis. We present a method to evaluate genome scaffolding by aligning independently obtained transcriptome sequences to the genome and visually summarizing the alignments using the Cytoscape software. Applying this method to the genome of the red fire ant Solenopsis invicta allowed us to identify inconsistencies in 7%, confirm contig order in 20% and extend 16% of scaffolds.
Contact: [email protected]; [email protected] Availability: Scripts that generate tables for visualization in Cytoscape from FASTA sequence and scaffolding information files are publicly available at https://github.com/ksanao/TGNet.
Supplementary Information: Supplementary data are available at
Bioinformatics online.
Received on July 8, 2011; revised on September 6, 2011; accepted on October 6, 2011
1 INTRODUCTION
De novo assemblies of eukaryotic genomes consist in many pieces
of contiguous sequence (contigs) arranged in thousands of scaffolds instead of a few scaffolds corresponding to the chromosomes (Jackman and Birol, 2010). Evaluating the qualities of such assemblies is a major challenge, especially in emerging model organisms that lack reference genomes. Independently obtained mRNA or protein sequences, or pairs of sequences separated by known genomic distances can be aligned to a genome assembly to help assess its quality (Paszkiewicz and Studholme, 2010; Parra
et al., 2008). However, it is difficult to systematically evaluate the
thousands or millions of resulting alignments.
ABySS-Explorer (Nielsen et al., 2009) provides a global view of a genome assembly, but it displays only the information used to create that assembly. Other visualization tools often display alignments of
∗To whom correspondence should be addressed.
†Present address: School of Biological and Chemical Sciences, Queen Mary, University of London, London E1 4NS, UK.
individual sequences, but fail to provide genome-level overviews (Nielsen et al., 2010; Supplementary Table S1).
We present an approach for genome quality assessment based on a general visualization tool, Cytoscape (Shannon et al., 2003), which is a popular platform to visualize and analyze molecular interaction networks (Suderman and Hallett, 2007). Comeau et al. (2010) examined synteny between metagenomic scaffolds using Cytoscape, thus demonstrating its potential for visualizing genomic alignments. Here, we show that Cytoscape can be used for visually representing alignments between independently obtained mRNA sequences, genome contigs and scaffolds. It allows rapid confirmation of intrascaffold connections between contigs and detection of possible scaffold extensions and inconsistencies.
2 VISUALIZING TRANSCRIPT TO GENOME
CONSISTENCY
The exons of a transcript should align sequentially to a single chromosomal region. However, in a fragmented assembly, different parts of a transcript may align to multiple contigs or scaffolds. We provide scripts that summarize such cases into overview files for visualization with Cytoscape (Section S1 in Supplementary Material provides details on how Cytoscape network files are generated from genomic FASTA-format sequence and AGP-format scaffolding information files). Visual inspection of these overviews can help to confirm contig order within scaffolds, extend scaffolds and identify inconsistencies.
2.1 Confirmation of contig connections
During genome assembly, contigs are ordered into scaffolds based on pairs of sequences separated by known distances. Similarly, transcripts that align to multiple contigs indicate which contigs are adjacent. We simultaneously visualize information from both sources; consistency confirms when scaffolding is likely correct.
We applied this method to 22 685 contigs in 1978 scaffolds of the recently assembled genome of the red fire ant Solenopsis invicta (Wurm et al., 2011; Section S2.A in Supplementary Material). We identified 966 transcripts (87.7% of transcripts in the network) that confirmed the adjacencies of 1918 contigs within 399 scaffolds (Section S2.C in Supplementary Material). Figure 1A illustrates that the coordinates of alignments between transcripts (prefix e_) and pairs of contigs (prefix g_c) are consistent with the adjacency and orientation of these contigs within the corresponding three genomic scaffolds (prefix g_s).
[12:49 12/11/2011 Bioinformatics-btr569.tex] Page: 3426 3425–3426
O.Riba-Grognuz et al.
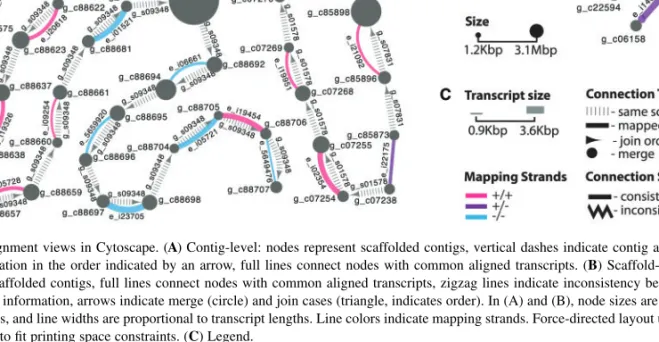
Fig. 1. Global alignment views in Cytoscape. (A) Contig-level: nodes represent scaffolded contigs, vertical dashes indicate contig adjacency according to
scaffolding information in the order indicated by an arrow, full lines connect nodes with common aligned transcripts. (B) Scaffold-level: nodes represent scaffolds and unscaffolded contigs, full lines connect nodes with common aligned transcripts, zigzag lines indicate inconsistency between scaffolding and transcript mapping information, arrows indicate merge (circle) and join cases (triangle, indicates order). In (A) and (B), node sizes are proportional to contig and scaffold lengths, and line widths are proportional to transcript lengths. Line colors indicate mapping strands. Force-directed layout used in Cytoscape was manually adjusted to fit printing space constraints. (C) Legend.
2.2 Scaffold extension
Transcripts that align to different genomic scaffolds and/or unscaffolded contigs suggest that these genomic sequences are adjacent or that they should be merged because one fills one or more gaps in the other. Our scripts determine the most likely solutions and their feasibility based on sequence and gap lengths and alignment coordinates. Relationships are then visually inspected.
We processed 1978 scaffolds and 67 533 unscaffolded contigs of the red fire ant genome. We found 572 consistent transcript alignments (87.6% of transcripts in the network) that connected 374 scaffolds and 577 unscaffolded contigs into 309 super-scaffolds (Section S2.D in Supplementary Material). Figure 1B shows two such super-scaffolds: two of the three scaffolds are likely adjacent (triangle arrowheads) and 10 unscaffolded contigs likely fill gaps (circle arrowheads) within scaffolds.
2.3 Highlighting inconsistencies
Network topology allows identifying inconsistencies in both contig-and scaffold-level networks. For example, contig g_c88686 in Figure 1A is connected to three other contigs. The connections to two of these contigs were inferred from paired reads during scaffolding, and an additional link is deduced from transcript e_i01474 alignment. The latter connection would lead to an impossible overlap between the two scaffolds. This problem is highlighted by a zigzag line with triangular arrows in Figure 1B (more details in Section S2 in Supplementary Material).
3 CONCLUSIONS
This approach allows systematic evaluation of genome assemblies’ quality, and thus could be useful for large-scale sequencing projects such as the i5K initiative (Robinson et al., 2011).
ACKNOWLEDGEMENT
We thank Vital-IT for advice and computing infrastructure.
Funding: Swiss National Science Foundation and European
Research Council advanced grant (to L.K.).
Conflict of Interest: none declared.
REFERENCES
Comeau,A.M. et al. (2010) Gene network visualization and quantitative synteny analysis of more than 300 marine T4-like phage scaffolds from the GOS metagenome. Mol. Biol. Evol., 27, 1935–1944.
Genome 10K Community of Scientists. (2009) A proposal to obtain whole-genome sequence for 10 000 vertebrate species. J. Hered. 100, 659–674.
Jackman,S.D. and Birol,I. (2010) Assembling genomes using short-read sequencing technology. Genome Biol., 11, 202.
Nielsen,C.B. et al. (2009) ABySS-Explorer: visualizing genome sequence assemblies.
IEEE Trans. Vis. Comput. Graph., 15, 881–888.
Nielsen,C.B. et al. (2010) Visualizing genomes: techniques and challenges. Nat.
Methods, 7 (Suppl. 3), S5–S15.
Paszkiewicz,K. and Studholme,DJ. (2010) De novo assembly of short sequence reads.
Brief. Bioinform., 11, 457–472.
Parra,G. et al. (2009) Assessing the gene space in draft genomes. Nucleic Acids Res.,
37, 289–297.
Robinson,G.E. et al. (2011) Creating a buzz about insect genomes. Science, 331, 1386. Shannon,P. et al. (2003) Cytoscape: a software environment for integrated models of
biomolecular interaction networks. Genome Res., 13, 2498–2504.
Suderman,M. and Hallett,M. (2007) Tools for visually exploring biological networks.
Bioinformatics, 23, 2651–2659.
Wurm,Y. et al. (2011) The genome of the fire ant Solenopsis invicta. Proc. Natl Acad.
Sci. USA, 108, 5679–5684.