HAL Id: hal-01793564
https://hal.archives-ouvertes.fr/hal-01793564
Submitted on 16 May 2018
HAL is a multi-disciplinary open access
archive for the deposit and dissemination of sci-entific research documents, whether they are pub-lished or not. The documents may come from teaching and research institutions in France or
L’archive ouverte pluridisciplinaire HAL, est destinée au dépôt et à la diffusion de documents scientifiques de niveau recherche, publiés ou non, émanant des établissements d’enseignement et de recherche français ou étrangers, des laboratoires
Spectroscopic and hydrodynamic characterisation of
DNA-Linked gold nanoparticle dimers in solution using
two-photon photoluminescence
Johanna Midelet, Afaf El-Sagheer, Tom Brown, Antonios Kanaras, Anne
Débarre, Martinus H. V. Werts
To cite this version:
Johanna Midelet, Afaf El-Sagheer, Tom Brown, Antonios Kanaras, Anne Débarre, et al.. Spectro-scopic and hydrodynamic characterisation of DNA-Linked gold nanoparticle dimers in solution us-ing two-photon photoluminescence. ChemPhysChem, Wiley-VCH Verlag, 2018, 19 (7), pp.827-836. �10.1002/cphc.201701228�. �hal-01793564�
Spectroscopic and hydrodynamic
characterization of DNA-linked gold
nanoparticle dimers in solution using
two-photon photoluminescence
Johanna Midelet,1 Afaf H. El-Sagheer,2 Tom Brown,2Antonios G. Kanaras,1,* Anne Débarre,3,* Martinus H.V. Werts4,5,*
1 University of Southampton, Physics and Astronomy, Faculty of Physical Sciences and
Engineering, Southampton SO171BJ, United Kingdom
2 University of Oxford, Department of Chemistry, 12 Mansfield Road, Oxford, OX1 3TA,
United Kingdom
3 École normale supérieure de Cachan, CNRS, lab. Aimé-Cotton and PPSM, 61 Av. du
Président Wilson, F-94235 Cachan, France
4 Univ Rennes, CNRS, SATIE - UMR 8029, F-35000 Rennes, France
5 École normale supérieure de Rennes, Av. R. Schuman, Campus de Ker Lann, F-35170
Bruz, France
* correspondence to:
a.kanaras@soton.ac.uk, anne.debarre@lac.u-psud.fr, martinus.werts@ens-rennes.fr
ACCEPTED MANUSCRIPT - AUTHOR'S VERSION
Final published version and supporting information can be found at http://dx.doi.org/10.1002/cphc.201701228
J. Midelet, A. H. El-Sagheer, T. Brown, A. G. Kanaras, A. Débarre and M. H. V. Werts, ChemPhysChem 2018, 19, 827-836
Abstract
Two-photon photoluminescence (TPPL) emission spectra of DNA-gold nanoparticle (AuNP) monoconjugates and corresponding DNA-linked AuNP dimers were obtained via photon time-of-flight spectroscopy (PTOFS). This technique is combined with two-photon photoluminescence fluctuation correlation spectroscopy (TPPL-FCS) to simultaneously monitor the optical and hydrodynamic behavior of these nano-assemblies in solution, with single particle sensitivity and microsecond temporal resolution. In this study, the AuNPs have an average core diameter of 12 nm which renders their dark-field plasmonic light scattering too weak for single-particle imaging. Moreover, as a result of lack of plasmonic coupling in the dimers, the optical extinction, scattering and photoluminescence spectra of the DNA-gold nanoparticles do not show sufficient difference to distinguish between monomers and dimers. TPPL-FCS successfully addresses these bottlenecks and enables the distinction between AuNP monomers and AuNP dimers in solution by measurement of their hydrodynamic rotational and translational diffusion.
Introduction
Deoxyribonucleic acid (DNA) is a versatile building block for the nanoscale engineering of nanoparticle-based materials.[1] Since the introduction of thiolated oligonucleotides as linkers for gold nanoparticle assembly,[2,3] various potential applications of oligonucleotide-functionalized nanoparticles in nanomedicine,[4] metamaterials[5] and nanoelectronics[6] have been investigated. Plasmonic gold nanoparticles exhibit specific optical and electronic properties depending on their size, shape and arrangement.[7] Thus, their assemblies could be described as 'plasmonic molecules'[8,9] with adjustable response correlated to their unique structures.
Conceptually, nanoparticle dimers are the simplest example of assembled structures of nanoparticles. They have been extensively studied as sensors or plasmonic rulers using absorbance or scattering spectroscopy.[10–12] However, a key disadvantage of these spectroscopic methods is that they cannot effectively detect the interactions between the nanoparticles when the interparticle distance is too large or when the particles are too small in size. The localised surface plasmon resonance is progressively damped out for small particles (<30 nm) which drastically decreases their light scattering response; such particles may be considered 'weakly plasmonic'. For instance, at the plasmon resonance peak maximum, 20 nm gold nanospheres (AuNP) scatter less than 1% of the incident photons.[13]
For biomedical applications of gold nanoparticles, it is particularly important to get a better understanding of their interactions with cells and complex biological structures. This requires the ability to track their location and distribution in these systems.[14] Often, the method used to image and track gold nanoparticles in cells is dark field microscopy, which has recently been extended to hyperspectral[15] and SERS[16] imaging. These imaging methods, which rely on plasmon-assisted light scattering, are hampered by the lower limit on the size of metal nanoparticles they can detect.
Here we demonstrate an alternative method for tracking DNA oligonucleotide-coated nanoparticles in liquid media by combining multiphoton-excited emission spectroscopy and fluctuation correlation spectroscopy (FCS). Whereas multiphoton-excited photoluminescence fluctuation correlation spectroscopy of individual luminescent silicon nanoparticles[17] and
individual gold nanoparticles[18] have been reported, the applicability of FCS to analyze multiparticle assemblies has not yet been explored.
In the present work, two-photon photoluminescence (TPPL) emission spectra of DNA-gold nanosphere assemblies are obtained via photon time-of-flight spectroscopy[19,20] (PTOFS). We show that two-photon-excited emission spectroscopy detects plasmonically small (12 nm average diameter) gold nanospheres with single-particle sensitivity, since it probes their localized surface plasmon resonance spectrum. We also extend the TPPL spectroscopy to two-photon photoluminescence fluctuation correlation spectroscopy (TPPL-FCS), yielding a sensitive measurement that simultaneously probes the plasmonic spectroscopy and the hydrodynamics of nano-assemblies. Our work opens interesting opportunities for detection, imaging and in situ characterization of molecularly linked nanoparticle assemblies. This may offer a new optical read-out mode for nanoparticle-based nucleic acid detection.
Results and discussion
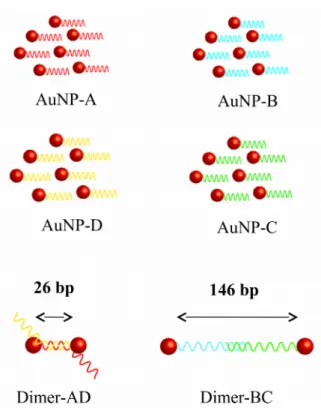
The experiments were carried out on various well-defined 12 nm AuNP-DNA monoconjugates and corresponding linked AuNP dimers. Through monofunctionalization of gold nanospheres with four different single-stranded DNA (ssDNA) strands we generated four "monomers": AuNP-A, AuNP-B, AuNP-C and AuNP-D. Two DNA-linked dimers were then obtained by hybridisation of the complementary DNA sequences,: the 'short-link' dimer AD (26 base-pair (bp) interparticle distance) and the 'long-link' dimer BC (146 bp). The collection of 4 AuNP-monoconjugates and 2 dimers is schematized in Figure 1.
Figure 1. Single-stranded DNA-gold nanosphere monoconjugates (A, B, AuNP-C, AuNP-D), and the corresponding DNA-linked dimers with interparticle links of 26 ('short link' AD) resp. 146 bp ('long link' BC). DNA base sequences can be found in the Supporting Info.
Optical extinction and scattering spectra
The linear optical extinction spectra of all ssAuNP monoconjugates and the DNA-linked AuNP dimers were very similar in shape, displaying the well-known plasmonic resonance near 520 nm for 12 nm AuNP (Figure 2). The short-link dimer AD and long-link dimer BC did not show any significant alteration of the plasmon resonance band compared to the monomers. This is illustrated by the position of the extinction maximum, which was consistently found to be at 521 nm (Table 1).
Figure 2. Normalized extinction spectra of ssDNA-gold nanoparticle monoconjugates
and their resulting DNA-linked dimers in aqueous solution, average gold core diameter 12 nm. Top: short-link dimer AD; Bottom: long-link dimer BC. There is virtually no difference in the extinction spectra of the monomer AuNP and the dimers.
From the similarity of the extinction spectra between monomers and dimers, we infer that there are no significant plasmonic interactions between the constituent gold nanospheres in the dimer. The absence of significant plasmonic interaction indicates that the interparticle distance in both types of dimers (AD and BC) is too large for such interaction to occur. It has been demonstrated that such plasmonic interaction critically depends on the interparticle gap and also on the nanoparticle diameters.[21–24] Jain et al.[21] found that the fractional wavelength shift of the plasmon band in homodimers depends on the particle diameter and the surface-to-surface gap
(1)
In the present study we used 12 nm gold nanospheres. Using the above formula, we estimate that interparticle gaps beyond half that distance (6 nm) lead to undetectable plasmonic interactions.
Table 1. Spectroscopic data. Linear optical extinction and scattering maxima (λmaxext
resp. λmaxsca ), and scattering yield at the wavelength of maximum scattering cross
section (φscamax). Wavelength of maximum two-photon photoluminescence (TPPL)
emission ( ) extinction scattering TPPL (λexc 800 nm) λmaxext [nm] λmaxsca [nm] φscamax [nm] AuNP-A 521 542 3 x 10⁻³ 538 AuNP-D 521 542 3 x 10⁻³ 539 'short-link' dimer AD 521 546 4 x 10⁻³ 547 AuNP-B 521 546 4 x 10⁻³ 539 AuNP-C 521 541 3 x 10⁻³ 533 'long-link' dimer BC 521 545 5 x 10⁻³ 550
In addition to light extinction, nanoparticles (NP) and NP assemblies display light scattering properties depending on their shape, size, and core material. Light scattering provides further information on the plasmonic properties of the objects. As described previously,[13,23] a corrected light scattering spectrum of a nanoparticle solution can be obtained in a conventional right-angle fluorimeter configuration using white light as the illumination source, and correcting the raw sample light scattering spectrum using the spectrum of a Ludox reference sample according to Equation (2),
(2)
Sufficiently diluted Ludox is a good light scattering reference since it is a perfect Rayleigh scatterer.[25] In order to account for batch-to-batch variations in the Ludox concentration, the Ludox reference sample is characterised by an optical density parameter such that each of their extinction spectra is described by Equation (3).
(3)
While the corrected light scattering spectrum has the spectral shape of the scattering cross section spectrum and does not depend on any instrumental parameters, its intensity still
depends on the nanoparticle concentration, which is usually not precisely known for purified nanoparticle solutions. Here, we propose to normalize the corrected light scattering spectrum using the Ludox density parameter and the optical density OD of the nanoparticle sample at the wavelength where its scattering is maximal (Equation 4).
(4)
It can be readily shown that reproduces the shape of the light scattering cross section spectrum , and that its maximum gives the scattering (quantum) efficiency
at that wavelength.
(5)
We call this the quantum-efficiency normalized light scattering (QENLS) spectrum. It describes the intrinsic light scattering behavior of the nanoparticle in solution, independent of concentration, specific illumination or spectrometer properties. It allows light scattering of different nanoparticles to be compared directly, both in terms of the spectral shape and the scattering efficiency.
As stated above, the concentration independence is interesting for nanoparticle characterization, since it is often difficult to precisely know the concentration of nanoparticle sample preparations. Moreover, QENLS spectra may be obtained theoretically from the scattering and extinction cross section spectra, calculated using analytic[26] or numerical[27–32] electromagnetic models. This allows for a direct comparison between experiment and theoretical models and helps to establish structure-property relationships for these plasmonic assemblies.
Figure 3 shows the QENLS spectra of the purified ssAuNP monoconjugates and DNA-linked dimers in pure water. The scattering efficiency is low, below 1%, as expected for 'plasmonically small' gold nanoparticles. While the scattering by the nanoparticles is weak, it can still be discerned in the light scattering spectrum by the plasmon-resonant band near 540 nm. We emphasize that these spectra are obtained from diluted bulk solutions in cuvettes using a bright white light source and are not single-particle spectra. The measurement of this weak scattering is relatively sensitive to even minor quantities of scattering impurities and
tiny air bubbles. Care was taken to avoid these, by careful filtration and also by letting the samples rest and equilibrate before measurement.
Figure 3. Quantum-efficiency normalized light scattering (QENLS) spectra of
ssDNA-AuNP monoconjugates and their corresponding DNA-linked dimers in aqueous solution. Top: AD dimer; Bottom: BC dimer.
The experimental scattering efficiencies at the scattering maximum are included in Table 1, and are between 3 x 10⁻³ and 5 x 10⁻³. A simple, idealized-model calculation on isolated 12 nm diameter perfect gold nanospheres in a medium of refractive index 1.33 (water) using Mie theory (see Supporting Information) yields 2 x 10⁻³, which is close to the experimental values. The experimental values are marginally higher than the theoretical values, due to the particle size distribution, deviations from spherical shape, and the local refractive index of the ligand shell. These are not taken into account by the simple theoretical model. The Mie calculation further confirms the spectral shape of the QENLS spectrum (Supporting Information, Figure S5). This demonstrates the relevance of the QENLS spectrum for the characterization of plasmonic nanostructures in solution.
There is very little difference in the light scattering by the DNA-linked AuNP dimers compared with the 'monomer' ssDNA-AuNPs monoconjugates. Similarly to the extinction
spectra, the scattering spectra do not show any distinct features that would indicate strong plasmonic interaction between the nanoparticles in these dimer structures. The DNA linkers create interparticle distances which are too large for such plasmonic interactions to occur. As discussed above, plasmonic interactions critically depend on the interparticle distance and the plasmonic properties of the particles.
Microfluidic measurement of diffusion coefficients
In order to ensure that the absence of changes in the extinction and scattering spectra was not due to unexpected dissociation of the dimers, we studied the diffusion behavior of the nanoparticle dimers in solution. We modified our previously described[33] microfluidic method for measuring diffusion coefficients to include a spectroscopic flow cell. The method is based on measuring the (lateral) diffusive mass transfer of analyte from the analyte solution to the pure solvent while both liquids are flowing side-by-side in parallel laminar flow inside a (rectangular) microfluidic channel. Both liquids are injected continuously, at equal volumetric flow rates, and the measurement is done at steady-state.
This method is different from the more well-known Taylor Dispersion Analysis (TDA), which is also based on microfluidic laminar flow. TDA has been used for instance to measure diffusion coefficients of small molecules,[34] polymer particles,[35] and inorganic nanoparticles. [36] In TDA, a short plug of analyte solution (ideally, a 'delta' pulse) is injected into solvent flow pumped through a long capillary tube (0.5 ... 5 m, typically). The injected analyte pulse broadens as a result of the combination of Fickian diffusion and the Poiseuille flow velocity profile in the (cylindrical) tube.[37] The effective diffusion of the analyte is longitudinal, along the axis of liquid flow. The broadening analyte peak (which approaches a Gaussian shape for long enough tube lengths) is measured using typical chromatographic detectors (UV absorbance flow cell, fluorescence, refractive index, conductivity), and analysis of its shape gives the diffusion coefficient. Measurement times are several tens of minutes.
In contrast to TDA, the diffusion of the analyte in the present microfluidic measurement takes place perpendicularly to the axis of liquid flow. It is a steady-state technique with continuous injection of both the analyte solution and the pure solvent. The length of the microfluidic co-flow channel is 5 cm, which is short compared to the length of the capillary in TDA. The typical measurement times are of the order of a minute, altough the present set-up requires
additional time to reach a stable steady-state before measurement due to dead volume and pump instabilites. The NP solution and the solvent are in contact and in parallel laminar flow at a specified flow rate in the central channel of microfluidic 'H'-circuitry (see Supporting Info), allowing NPs to diffuse laterally from the NP solution flow to the solvent flow. Extending the original work,[33] we developed an improved analysis protocol in which diffusion coefficients are directly determined from individual optical extinction measurements at selected flow rates using the spectrometric flow cell. This new protocol is described in the experimental section.
The diffusion coefficients obtained through microfluidic measurement are listed in the first column of Table 2. Compared to small molecules, the diffusion of the gold nanoparticles is at least one order of magnitude slower; this requires very low flow rates in our set-up. We found that these were difficult to stabilize and prolonged times were necessary to reach a stationary state after changing the flow rate. This explains the large error bars, which particularly handicaps the determination for dimer-BC. The stability of the microfluidic measurement can be improved by further temperature stabilization, use of pressure-driven flow instead of syringe pumps and reduction of dead volume by integrating the observation flow cell in the microfluidic structure.
In spite of this experimental difficulty, we observe that the diffusion coefficient of bis-sulfonato(phenyl)-phenylphosphine (BSPP)-coated AuNPs was in line with the value expected for a 13 nm diameter sphere (12 nm core + 0.5 nm ligand shell), using the Stokes-Einstein-Sutherland relation, i.e. 3.8 x 10⁻¹¹ m2 s-1. Moreover, we observed that ssDNA-AuNP monoconjugates have a significantly lower diffusion coefficient than BSPP-AuNP. The diffusion coefficient is further reduced in the case of a dimer.
Table 2. Translational diffusion coefficients from microfluidics and from TPPL-FCS. Temperature was 298 K. microfluidics TPPL-FCS D (m2 s-1) D (m2 s-1) AuNP-BSPP 4.1 (±1.3) x 10-11 n.m. AuNP-A 2.0 (±0.8) x 10-11 2.3 (±0.2) x 10-11 AuNP-B n.m. 2.0 (±0.1) x 10-11 AuNP-C n.m. 2.3 (±0.2) x 10-11 AuNP-D n.m. 2.2 (±0.2) x 10-11 short-link dimer AD n.m. 1.6 (±0.1) x 10-11 long-link dimer BC 0.6 (±0.5) x 10-11 1.1 (±0.3) x 10-11 n.m. = not measured
Two-photon photoluminescence
The DNA-linked AuNP dimers cannot readily be distinguished from the ssDNA-AuNP monoconjugates when steady-state light extinction and scattering spectroscopies are used. Straightforward detection of the dimers is further complicated by their weak light scattering. Microfluidic measurement of diffusion coefficients does indeed distinguish (hydrodynamically) between monomer and dimer, but this requires a separate experiment. Below, we will show that the intrinsic multiphoton-excited luminescence from the AuNP monomers and dimers in solution provides a more sensitive and rapid "one pot" method for detecting and characterizing such samples.
Upon excitation of the nanoparticle solutions with 100 fs pulses of 800 nm light from a Ti-saphhire laser (80 MHz repetition rate, 4.5 mW average power on the sample, 60x NA 1.2 water immersion objective), an upconverted emission band is observed in the 450-700 nm range. This emission is attributed to two-photon excited photoluminescence (TPPL).[18,38,39] The TPPL of all monomers and dimers studied was similar, in terms of spectral shape and in terms of intensity. This was always in the same order of magnitude, varying by less than a factor of 2. Small differences in TPPL emission intensity between samples were observed, but these were not characterized and studied in detail.
In Figure 4 we show the TPPL spectra for the DNA-linked AuNP dimers, obtained using photon time-of-flight spectroscopy[18,20] (PTOFS). The TPPL emission was a broad band peaking near 540 nm, and reproduced the spectral shape of the linear light scattering
spectrum. Such spectral similarity between photoemission and resonant light scattering is a general observation with plasmonic nanostructures.[20,40,41]
Figure 4. Two-pĥoton photoluminescence spectra from DNA-linked dimers
(concentration 3.5 nM in water, excitation: 800 nm, 80 MHz, 100 fs pulses). The dotted lines are the corresponding linear light scattering spectra, scaled for comparison.
The mechanisms underlying light emission by plasmonic nanostructures are still under debate, both for Stokes ('one-photon excitation')[20,40,42,43] and anti-Stokes upconversion ('multi-photon excitation')[14,18,44] emission which have been observed for plasmonic nanostructures. The TPPL mechanism has been far less studied in comparison to one-photon excited photoluminescence (OPPL). Similarly to OPPL, the resemblance of the luminescence spectra with the corresponding scattering spectra suggests that the mechanism is plasmon-mediated. In a first step, a two-photon absorption process excites an electron from the d-band to the sp-band. Two models have been suggested for the mechanism of photon emission. In the first model, the emission results from the interband electron-hole recombination, which is amplified at the frequencies of the surface plasmon.[45,46] In the second one, luminescence originates from the radiative intraband deexcitation of the surface plasmons.[47,48]
However, recent work[49] suggested that the term 'photoluminescence' should not apply, as in the case of plasmonic structure displaying very small interparticle gaps, the light emission might originate from an inelastic scattering process. Such a process would be similar to Raman scattering, with the difference that hot electrons in the gradient plasmon field mediate the energy exchange, instead of the vibrations that fulfill this role in 'standard' Raman
scattering. The theoretical model from that work predicts a 100-fold increase in (one-photon excited) light emission going from monomer to dimer, which is not in agreement with experimental observations where monomers and dimers display similar light emission intensities.[42,43] Interestingly, the authors do suggest interband-mediated photoluminescence (PL) to be operative in monomeric plasmonic particles.
Agnostic about the exact photophysical mechanism, we choose to refer to the upconverted light emission observed under multi-photon excitation conditions as "two-photon excited photoluminescence" (TPPL). This is also the term most regularly used in recent literature to refer to this phenomenon. However, we do acknowledge that "upconverted light emission" may be a more fitting and general term.
A particularly attractive feature of the confocal measurement of TPPL in our set-up is the possibility to simultaneously obtain information on the hydrodynamics of the particles by analyzing the TPPL intensity fluctuations in the confocal volume due to Brownian motion,
i.e. performing TPPL fluctuation correlation spectroscopy (TPPL-FCS). TPPL-FCS is similar
fluorescence correlation spectroscopy,[50–53] but instead of (monophotonic) fluorescence it uses the multi-photon excited light emission from the plasmonic structures for probing the dynamics of the confocal volume. Excitation of the intrinsic luminescence of the plasmonic structure is a useful alternative to the introduction of molecular fluorescent tags[54–56] in the structures. One-photon excited photoluminescence FCS has recently been applied to study the hydrodynamics of gold nanorods via their instrinsic photoexcited light emission.[41]
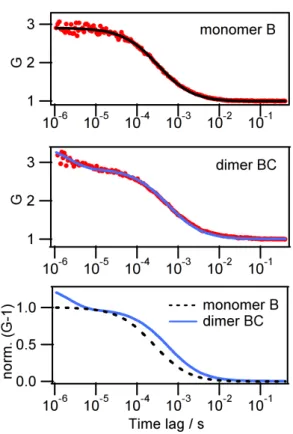
Typical TPPL-FCS results for a ssAuNP monoconjugate and the corresponding DNA-linked AuNP dimer are shown in Figure 5. The autocorrelation curves of the TPPL intensity in the confocal observation volume clearly display different shapes between the AuNP-B monoconjugate and the AuNP dimer.
Figure 5. TPPL-FCS (excitation 800 nm, 4.5 mW). Top and middle: TPPL intensity
autocorrelation curves for ssDNA(B)-AuNP monoconjugate and long-link dimers BC, and fit using translational and rotation-translational diffusion, respectively. Bottom: best fits for monomer and dimer TPPL autocorrelation, rescaled to enable direct comparison, demonstration the longer translational time of the dimers and the presence of a rotational component at short time lag.
The autocorrelation data for ssDNA-AuNP monoconjugates can be described using a model involving only translational diffusion (Eqn. 6), assuming a 3D Gaussian beam.
(6)
The translational diffusion time constant is directly related to the diffusion coefficient and the lateral waist of the observation volume , i.e. in the case of two-photon excitation. Furthermore, with being the longitudinal waist of the observation volume. N is the mean number of particles diffusing simultaneously inside the excitation volume. Calibration of the focal volume using Rhodamine 6G in water gives =
225 nm and q = 0.075. The diffusion coefficients obtained from TPPL-FCS are listed in Table 2.
We found that the autocorrelation data for both dimers AD and BC requires a model including a rotational term, described by rotational time constant (Eqn. 7), which can also be expressed by the rotational diffusion coefficient .[57]
(7)
The rotational diffusion coefficients were found to be = 7 (±0.8) x 104 s-1 for dimer-AD, and = 5.5 (±0.8) x 104 s-1 for dimer-BC. There is much noise on the autocorrelation at very short time lags. This results in a sizeable uncertainty on the time constant for rotational diffusion. However, in combination with the observation of a longer diffusion time, the appearance of this rapid rotational contribution demonstrates the hydrodynamic difference between ssDNA-AuNP monoconjugates and DNA-linked dimers, due to their different sizes. The values for the rotational diffusion coefficients and the translational diffusion coefficients obtained from TPPL-FCS may be compared to theoretical model values calculated for nanorods with diameter d = 12 nm and length L = 33 nm (AD) or L = 74 nm (BC), respectively. Following the hydrodynamic model by Tirado et al.[58] the expressions of the translation diffusion coefficient and of the rotation constant are:
(8)
(9)
The calculation yields = 2 x 10-11 m2 s-1 and = 7 x 10⁴ s-1 for "AD-like" nanorods, and = 1.3 x 10⁻¹¹ m2 s-1 and = 1.4 x 10⁴ s-1 for "BC-like" nanorods. These values are in the same order of magnitude and display the same trends as those experimentally obtained for the dimers (Table 2), despite the rough approximation related to the shape of the object. The agreement with the simple model is better for AD dimer than for BC dimer. The former has the shortest linker between the two nanospheres, which may explain the better agreement. This result indicates that the hybridised DNA linker is indeed rigidly extended between the components of the structure.
The combined theoretical and experimental results on the translational diffusion coefficient of ssDNA-AuNP monoconjugates and DNA-linked AuNP dimers illustrate that the diffusion coefficient of elongated objects (L = 33 nm and L = 74 nm for a width of 12 nm) cannot be estimated simply from the Stokes-Einstein equation using the long axis as the hydrodynamic radius, but requires more elaborate hydrodynamic models. In the same vein, it has recently been shown that attaching a single long rigid rod-shaped DNA molecule (68 bp, 23 nm) to a 6 nm diameter nanosphere leads to only a small increase in effective hydrodynamic Stokes radius (3.2 nm to 5.8 nm), well below the additional length provided by the rod-like molecule.[59]
It is interesting to compare the translation diffusion coefficients obtained through TPPL-FCS and microfluidics (Table 2). The two methods agree. The trend in diffusion coefficient between ssDNA-AuNP monogconjugates and DNA-linked AuNP dimers, and the order of magnitude of the coefficient, are reproduced by the microfluidic measurement. It should be noted that there is a large uncertainty on the microfluidic data, in particular for dimer-BC, which was measured at very low flow rates.
Beyond this direct comparison of the determination of hydrodynamic radii by the three different measurements described here, we can also look at studies of gravitational sedimentation[60–62] and analytical centrifigation[59,63–65] of nanoparticle solutions. These also yield insight in the hydrodynamic behaviour of nanoparticles. Recently we studied the gravitational sedimentation of a DNA-linked dimer of 13 nm AuNPs.[62] This dimer has a structure similar to dimer BC, but a slightly different DNA linkage was used. At 277 K, we obtained D = 0.58 x 10⁻¹¹ m2 s-1 , which, taking into account the change in viscosity of the water, would correspond to D = 1.1 x 10⁻¹¹ m2 s-1 at 298K; this is in agreement with the values obtained by TPPL-FCS and microfluidics. In addition to the diffusion coefficient, such measurements yield the sedimentation coefficient, which also critically depends on particle shape.[59]
Conclusion
TPPL combined with PTOFS and FCS provides a sensitive method to detect and characterize even the 'weakly plasmonic' assemblies studied here which do not efficiently scatter light and whose plasmonic spectra do not show a clear difference between monomeric species and
dimeric assemblies. In contrast to linear optical spectroscopy, which is carried out in typical spectroscopic cell volumes (3 mL), TPPL is measured in a small confocal volume, typically in the sub-picolitre range, the entire sample being a droplet (~ 50 µl). Such a confocal configuration is compatible with detection in capillaries, such as those found in microfluidics or analytical chromatography.
For the type of DNA-linked gold nanosphere dimers studied in this work, it is the hydrodynamic behavior measured using TPPL-FCS which carries the relevant information that allows monomeric and dimeric objects to be distinguished. The monomers and dimers were measured separately, after gel electrophoresis. It should be noted that it may be difficult to detect the simultaneous presence of monomers and dimers in a sample of unknown composition using either the microfluidic method or TPPL-FCS. Without prior knowledge on the diffusivity of either the pure monomer or the pure dimer, noise on the measurements will often lead to satisfactory fits to the data with single-component models and a single average diffusion coefficient. However, when prior knowledge about the behaviour of one component is available, changes in the measurements relative to the measurement of the pure component can then be interpreted in terms of a multi-component model indicating the presence of an additional species. Also, for series of samples of different monomer-to-dimer ratios one may be able to build global models, where all data are analyzed using the same set of diffusion coefficients for the different species.
In this context, it is of interest to envisage extension to even more complex samples consisting of several populations of NP assemblies. Whereas microfluidic diffusion experiments have as yet only addressed analysis of solutions containing mixtures of molecules and nanoparticles with large differences in diffusion coefficients,[66–68] work in FCS has explored the analysis of samples containing several sizes of nanoparticles,[69–71] and demonstrated the possibility of distinguishing different populations of objects within a single sample. The success of such analyses is affected by experimental noise, and depends on the availability of a priori knowledge on the sample composition that can be included in the model for fitting the data. Identification of different populations in FCS and microfluidic experiments may be greatly facilitated if differences in optical spectra exist between these popuations, such as demonstrated earlier[23] for mixtures of monomers and dimers with
different spectral response. For the present set of samples, however, such spectral distinction is not possible.
Our study shows that TPPL of small AuNPs is bright enough not only to detect and image AuNPs but also to study their spectral and hydrodynamic properties. We anticipate that this may find application in NP-based nucleic acid detection.
Experimental details
Synthesis and purification of ssAuNP monoconjugates and
DNA-linked dimers
A schematic illustration of the route to make DNA-gold nanoparticle monomers and dimers is shown in Figure S1 (Supporting Information). In summary, four solutions of DNA-gold nanoparticle monoconjugates were prepared by mixing bis-sulfonato(phenyl)-phenylphosphine (BSPP)-coated AuNPs with one of the four thiolated ssDNA in a 1:1 ratio. These were subsequently purified by gel electrophoresis. The different ssDNA oligonucleotides are labeled A, B, C, D. The DNA sequences are shown in Supporting Information, Table S1. The DNA-gold nanoparticle monoconjugates were then mixed to create nanoparticle dimers through DNA hybridisation of the complementary oligonucleotide strands (A + D resp. B + C).[72] Agarose gel electrophoresis was used to purify the samples. This resulted in solutions of AuNP-dimer with a short (26 bp) DNA link (dimer-AD) and AuNP-dimer with a long (146 bp) DNA link (dimer-BC). The synthetic details and characterization of the purified nanoparticles are given in the Supporting Information.
Optical spectroscopy
Optical spectroscopy was carried out at ambient temperature (298 K) on air-equilibrated samples contained in standard 1 cm quartz or plastic fluorescence cuvettes. UV-visible extinction spectra were measured using an optical fiber-based system (Ocean Optics) incorporating a CCD spectrometer (USB4000-VIS-NIR) and a tungsten-halogen light source (LS1, 6.5 W, 3100 K) equipped with a BG34 colour correction filter.
Light scattering measurements were performed according to the methodology that we described previously.[13,20,23] The method uses a right-angle configuration, measuring only
light scattered around 90°, assuming that the angular distribution of light scattering by the samples and the reference is identical. This is valid for gold particles smaller than about 100 nm.[73] The sample solutions were illuminated with white light (LS-1 tungsten-halogen light source). The scattered light was collected at a fixed angle of 90°, and analysed using a back-thinned CCD spectrograph (Ocean Optics QE65000). All samples were diluted such that the optical density remains well below 0.05. A solvent background was subtracted from all recorded spectra, and the background-subtracted raw spectra were corrected using Ludox as the perfect Rayleigh scatterer.[25] In the present work, the light scattering spectra were normalized such that the maximum has the value of the scattering quantum yield at that wavelength, as explained above.
The Ludox reference sample consisted of the supernatant of a Ludox SM30 (Aldrich) suspension centrifuged for 1 h at 9700 x g, which was diluted 200 times in 0.05 M NaCl. For each measurement series, three Ludox reference samples were prepared, and each reference sample was characterised using its value, by fitting the function to the experimental Ludox extinction spectrum. The baseline value enables for correction for very small differences in baseline, but should be very close to zero. If this is not the case, a new reference sample is prepared. Finally, it was verified that all three Ludox samples gave identical scattering spectra, in both shape and intensity. The average value of the three Ludox samples was used.
Where appropriate, the extinction and scattering spectra were smoothed using the Whittaker-Eilers (WE) algorithm[74] to reduce noise and bring out the spectral shape more clearly. The WE smoother, which conserves both spectral shape and peak intensity and is simpler and more efficient than the Savitsky-Golay[75] filter, was programmed in Python using the scientific 'numpy' and 'scipy' libraries[76] (see Supporting Information).
Microfluidic measurement of diffusion coefficients
The microfluidic measurement of diffusion coefficient is based on the microfluidic 'H-filter'. [77] We adapted our previously described microfluidic method for measuring diffusion coefficients[33] to include a spectroscopic flow cell (SMA-Z-10 Ultem, FIAlab Instruments, Seattle WA, USA) which was used to measure the optical extinction spectrum using the
fiber-coupled spectrometer cited above. The long (1 cm) path length of the flow cells enables precise measurement of optical density (OD), even at low concentrations.
The measurement is based on determining the extent of the diffusive mass transfer from the flow of nanoparticle solution to the flow of pure solvent, which are continuously injected at separate inputs of the microfluidic circuit (Supporting Information, Figure S6) and flow parallel after meeting at a 'T'-junction, enabling diffusive mass transfer to occur. At the end of the interaction zone, the flow is split in two by another 'T'-junction (thus constituing an 'H'-filter circuit). The extent of diffusive transfer between the two flows can be determined from the gain in OD of the exiting solvent flow (which will carry the subscript "B"), and/or from the loss in OD from the exiting nanoparticle solution flow (subscript "A"). We measured the OD of the solvent flow, . The extent of diffusion is defined here in terms of the concentrations of nanoparticles in the flows exiting the H-filter, and (their sum is equal to the injected nanoparticle concentration). For a measurement of the concentration at exit "B", we have Equation 10.
(10)
Note that this definition is (slightly) different from the definition in our initial work;[33] the present definition leads to in case of no diffusive transfer occurring, and to for diffusive transfer being complete. The overall concentration of the injected nanoparticle solution ( ) was measured by stopping the injection of the pure solvent, causing only the pure nanoparticle solution to exit at both exits and traverse the flow cell. On the other hand, when injecting only pure solvent, the baseline for the extinction measurement was recorded. At a given volumetric flow rate (m3 s-1; this is the sum of the two entering flow rates), we can theoretically calculate the extent of diffusion for a given diffusion coefficient . For this, it is convenient to convert the flow rate into a (device-independent) measure of the interaction time, (Equation 11), using channel length , channel width , and channel height .
Using the analytic solution of the diffusion equation,[33] we obtain Equation 12 for the presently defined . This sum has to be evaluated numerically. For sufficiently large values of the series converges rapidly, in which case only a few terms are needed for a reliable result (sometimes even only the first term).[33]
(12)
When has experimentally been measured at a certain specified flow rate , can be found by solving for D. This needs to be done numerically, for example using the secant method, since there is no direct inverse expression for Equation 12. (When only the first term of the series in Equation 12 is significant, there is a direct analytic inverse expression, but this feature is not used here.)
The experimental flow rates were chosen such that the measured was in the range 0.1 ... 0.7. For each sample, several determinations of were carried out, at various flow rates over several days, giving access to the statistical uncertainty on the diffusion coefficient. The connection of the flow cell to the microfluidic system introduced a sizeable dead volume, which resulted in long times for the reading of the OD to stabilize, in particular at low flow rates. Drift and fluctuations during this time contribute to the relatively large confidence interval. The temperature was close to 298K, but fluctuated somewhat (±2 K) during measurement.
The microsystem used had an interaction channel of height 140 µm, width 200 µm and length 50 mm. The precise microfluidic circuit is shown in the Supporting Info. Prior to each experiment the system was washed with Milli-Q water (200 µL) at a flow rate of 4 µL/min. Milli-Q water (Entry B) and the sample studied (Entry A) were introduced in the microsystem using two syringes (d= 2.5 mm) mounted on individual syringe pumps. The system was left to stabilize for one hour at the flow rate selected for each experiment (typically between 1 x 2 µl/min and 10 x 2 µl/min).
Two-photon excited photoluminescence (TPPL)
The set-up for TPPL has been described previously.[20] Briefly, the experiments use a scanning stage confocal microscope. They are performed in air and at ambient temperature in a droplet
of sample deposited on a clean coverslip. The sample is illuminated by a a titanium-sapphire femtosecond laser (wavelength 800 nm, 80 MHz repetition rate, 100fs pulse duration) through a high numerical aperture water-immersion objective (N.A.=1.2, 60x Nikon). The luminescence of the particles diffusing inside the excitation volume is collected by the same objective and is directed to a 50% fiber coupler after passing through a dichroic mirror (Semrock FF720SDiO1). Matching between the collected beam profile and the fiber core is ensured by a telescope. The collected light is filtered by a short pass filter (Semrock FF016-680/SP) to remove the residual laser light.
One fiber of the coupler is directly connected to an avalanche photodiode. This path allows detecting the bursts of luminescence of the freely diffusing particles. A long additional fiber (length 100 m) is inserted in the path of the second fiber before the signal is detected by a second avalanche photodiode. This path is devoted to the spectral analysis of the bursts of luminescence by the photo time-of-flight method as already described previously.[19,20] In PTOFS, the photons that travel into the long fiber have a transit time that depends on their wavelength according to the chromatic dispersion in the long fiber. As a result, the light flash that is detected by the APD connected to this path is stretched and the profile of the output signal is directly related to the spectrum of the incoming flash. The recording of the temporal traces of the emitted photons uses a time-correlated single photon counting. The correlation function used for FCS and the spectra of the data are derived by post processing with home-made software.
Acknowledgments
This work was supported by Dstl (UK) in the framework of the France-UK Ph.D. programme. AD and MW acknowledge funding by the Agence Nationale de la Recherche (France), grant ANR-2010-JCJC-1005-1 (COMONSENS).
References
[1] L. Di Michele, E. Eiser, Phys. Chem. Chem. Phys. 2013, 15, 3115.
[2] C. A. Mirkin, R. L. Letsinger, R. C. Mucic, J. J. Storhoff, Nature 1996, 382, 607–609. [3] A. P. Alivisatos, K. P. Johnsson, X. Peng, T. E. Wilson, C. J. Loweth, M. P. Bruchez, P.
G. Schultz, Nature 1996, 382, 609–611.
[4] A. Heuer-Jungemann, A. H. El-Sagheer, P. M. Lackie, T. Brown, A. G. Kanaras,
Nanoscale 2016, 8, 16857–16861.
[5] W. Yan, L. Xu, C. Xu, W. Ma, H. Kuang, L. Wang, N. A. Kotov, J. Am. Chem. Soc. 2012, 134, 15114–15121.
[6] J. Liu, Y. Geng, E. Pound, S. Gyawali, J. R. Ashton, J. Hickey, A. T. Woolley, J. N. Harb, ACS Nano 2011, 5, 2240–2247.
[7] Z. Qian, D. S. Ginger, J. Am. Chem. Soc. 2017, 139, 5266–5276.
[8] C. Zhang, R. J. Macfarlane, K. L. Young, C. H. J. Choi, L. Hao, E. Auyeung, G. Liu, X. Zhou, C. A. Mirkin, Nat. Mater. 2013, 12, 741–746.
[9] R. J. Macfarlane, M. N. O’Brien, S. H. Petrosko, C. A. Mirkin, Angew. Chem. Int. Ed.
Engl. 2013, 52, 5688–5698.
[10] J. I. L. Chen, Y. Chen, D. S. Ginger, J. Am. Chem. Soc. 2010, 132, 9600–9601.
[11] S. E. Lee, Q. Chen, R. Bhat, S. Petkiewicz, J. M. Smith, V. E. Ferry, A. L. Correia, A. P. Alivisatos, M. J. Bissell, Nano Lett. 2015, 15, 4564–4570.
[12] N. Seow, Y. N. Tan, L.-Y. L. Yung, X. Su, Sci. Rep. 2016, 5, 18293. [13] J. R. G. Navarro, M. H. V Werts, Analyst 2013, 138, 583–592.
[14] R. Fernandes, N. R. Smyth, O. L. Muskens, S. Nitti, A. Heuer-Jungemann, M. R. Ardern-Jones, A. G. Kanaras, Small 2015, 11, 713–721.
[15] N. Fairbairn, A. Christofidou, A. G. Kanaras, T. A. Newman, O. L. Muskens, Phys.
Chem. Chem. Phys. 2013, 15, 4163–4168.
[16] C. Andreou, V. Neuschmelting, D.-F. Tschaharganeh, C.-H. Huang, A. Oseledchyk, P. Iacono, H. Karabeber, R. R. Colen, L. Mannelli, S. W. Lowe, et al., ACS Nano 2016,
10, 5015–5026.
[17] O. Akcakir, J. Therrien, G. Belomoin, N. Barry, J. D. Muller, E. Gratton, M. Nayfeh,
Appl. Phys. Lett. 2000, 76, 1857–1859.
[18] M. Loumaigne, A. Richard, J. Laverdant, D. Nutarelli, A. Débarre, Nano Lett. 2010,
[19] M. Loumaigne, P. Vasanthakumar, A. Richard, A. Débarre, ACS Nano 2012, 121129122749006.
[20] M. Loumaigne, J. R. G. Navarro, S. Parola, M. H. V. Werts, A. Débarre, Nanoscale 2015, 7, 9013–9024.
[21] P. K. Jain, W. Huang, M. A. El-Sayed, Nano Lett. 2007, 7, 2080–2088.
[22] B. M. Reinhard, M. Siu, H. Agarwal, A. P. Alivisatos, J. Liphardt, Nano Lett. 2005, 5, 2246–2252.
[23] M. Loumaigne, C. Midelet, T. Doussineau, P. Dugourd, R. Antoine, M. Stamboul, A. Débarre, M. H. V. Werts, Nanoscale 2016, 8, 6555–6570.
[24] X. Lan, Z. Chen, B.-J. Liu, B. Ren, J. Henzie, Q. Wang, Small 2013, 9, 2308–2315. [25] G. Deželić, J. P. Kratohvil, Kolloid-Zeitschrift 1960, 173, 38–48.
[26] C. F. Bohren, D. R. Huffman, Absorption and Scattering of Light by Small Particles, Wiley Interscience, New York, 1983.
[27] M. A. Yurkin, A. G. Hoekstra, J. Quant. Spectrosc. Radiat. Transf. 2011, 112, 2234– 2247.
[28] B. T. Draine, P. J. Flatau, J. Opt. Soc. Am. A 1994, 11, 1491–1499.
[29] B. Khlebtsov, A. Melnikov, V. Zharov, N. Khlebtsov, Nanotechnology 2006, 17, 1437– 1445.
[30] A. Dhawan, S. J. Norton, M. D. Gerhold, T. Vo-Dinh, Opt. Express 2009, 17, 9688– 9703.
[31] V. Myroshnychenko, J. Rodríguez-Fernández, I. Pastoriza-Santos, A. M. Funston, C. Novo, P. Mulvaney, L. M. Liz-Marzán, F. J. García de Abajo, Chem. Soc. Rev. 2008,
37, 1792–805.
[32] R. Esteban, A. G. Borisov, P. Nordlander, J. Aizpurua, Nat. Commun. 2012, 3, 825. [33] M. H. V. Werts, V. Raimbault, R. Texier-Picard, R. Poizat, O. Français, L. Griscom, J.
R. G. Navarro, Lab Chip 2012, 12, 808–820.
[34] E. Grushka, E. J. Kikta, J. Phys. Chem. 1974, 78, 2297–2301.
[35] H. Cottet, M. Martin, A. Papillaud, E. Souaïd, H. Collet, A. Commeyras,
Biomacromolecules 2007, 8, 3235–3243.
[36] S. Balog, D. A. Urban, A. M. Milosevic, F. Crippa, B. Rothen-Rutishauser, A. Petri-Fink, J. Nanoparticle Res. 2017, 19, 287.
[38] Z. Guan, L. Polavarapu, Q. H. Xu, Langmuir 2010, 26, 18020–18023.
[39] H. Wang, T. B. Huff, D. A. Zweifel, W. He, P. S. Low, A. Wei, J.-X. Cheng, Proc. Natl.
Acad. Sci. 2005, 102, 15752–15756.
[40] M. Yorulmaz, S. Khatua, P. Zijlstra, A. Gaiduk, M. Orrit, Nano Lett. 2012, 12, 4385– 4391.
[41] A. Tcherniak, S. Dominguez-Medina, W. S. Chang, P. Swanglap, L. S. Slaughter, C. F. Landes, S. Link, J. Phys. Chem. C 2011, 115, 15938–15949.
[42] D. Huang, C. P. Byers, L. Y. Wang, A. Hoggard, B. Hoener, S. Dominguez-Medina, S. Chen, W. S. Chang, C. F. Landes, S. Link, ACS Nano 2015, 9, 7072–7079.
[43] M. Loumaigne, G. Laurent, M. H. V. Werts, A. Débarre, Phys. Chem. Chem. Phys. 2016, 18, 33264–33273.
[44] Z. Guan, N. Gao, X.-F. Jiang, P. Yuan, F. Han, Q.-H. Xu, J. Am. Chem. Soc. 2013, 135, 7272–7277.
[45] M. B. Mohamed, V. Volkov, S. Link, M. A. El-Sayed, Chem. Phys. Lett. 2000, 317, 517–523.
[46] K. Imura, T. Nagahara, H. Okamoto, J. Am. Chem. Soc. 2004, 126, 12730–12731. [47] H. Hu, H. Duan, J. K. W. Yang, Z. X. Shen, ACS Nano 2012, 6, 10147–10155. [48] E. Dulkeith, T. Niedereichholz, T. Klar, J. Feldmann, G. von Plessen, D. Gittins, K.
Mayya, F. Caruso, Phys. Rev. B 2004, 70, 205424.
[49] J. Mertens, M.-E. Kleemann, R. Chikkaraddy, P. Narang, J. J. Baumberg, Nano Lett. 2017, 17, 2568–2574.
[50] E. L. Elson, D. Magde, Biopolymers 1974, 13, 1–27.
[51] D. Magde, E. L. Elson, W. W. Webb, Biopolymers 1974, 13, 29–61. [52] J. Ries, P. Schwille, BioEssays 2012, 34, 361–368.
[53] M. Kinjo, R. Rigler, Nucleic Acids Res. 1995, 23, 1795–1799.
[54] G. Schneider, G. Decher, N. Nerambourg, R. Praho, M. H. V Werts, M. Blanchard-Desce, Nano Lett. 2006, 6, 530–6.
[55] N. Nerambourg, R. Praho, M. H. V. Werts, D. Thomas, M. Blanchard-Desce, Int. J.
Nanotechnol. 2008, 5, 722.
[56] J. R. G. Navarro, M. Plugge, M. Loumaigne, A. Sanchez-Gonzalez, B. Mennucci, A. Débarre, A. M. Brouwer, M. H. V Werts, Photochem. Photobiol. Sci. 2010, 9, 1042– 54.
[57] C. M. Pieper, J. Enderlein, Chem. Phys. Lett. 2011, 516, 1–11.
[58] M. M. Tirado, C. L. Martínez, J. G. de la Torre, J. Chem. Phys. 1984, 81, 2047–2052. [59] M. J. Urban, I. T. Holder, M. Schmid, V. Fernandez Espin, J. Garcia de la Torre, J. S.
Hartig, H. Cölfen, ACS Nano 2016, 10, 7418–7427.
[60] C. M. Alexander, J. C. Dabrowiak, J. Goodisman, J. Colloid Interf. Sci. 2013, 396, 53– 62.
[61] C. M. Alexander, J. Goodisman, J. Colloid Interf. Sci. 2014, 418, 103–112.
[62] J. Midelet, A. H. El-Sagheer, T. Brown, A. G. Kanaras, M. H. V. Werts, Part. Part.
Syst. Charact. 2017, 1700095.
[63] J. Walter, T. Thajudeen, S. Süβ, D. Segets, W. Peukert, Nanoscale 2015, 7, 6574–6587. [64] T. Detloff, T. Sobisch, D. Lerche, Part. Part. Syst. Charact. 2006, 23, 184–187.
[65] K. L. Planken, H. Cölfen, Nanoscale 2010, 2, 1849.
[66] P. Arosio, T. Müller, L. Rajah, E. V. Yates, F. A. Aprile, Y. Zhang, S. I. A. Cohen, D. A. White, T. W. Herling, E. J. De Genst, et al., ACS Nano 2016, 10, 333–341.
[67] M. H. V. Werts, V. Raimbault, M. Loumaigne, L. Griscom, O. Français, J. R. G. Navarro, A. Débarre, B. Le Pioufle, Proc. SPIE 2013, 8595, 85950W.
[68] A. Hatch, A. E. Kamholz, K. R. Hawkins, M. S. Munson, E. A. Schilling, B. H. Weigl, P. Yager, Nat. Biotechnol. 2001, 19, 461–465.
[69] P. Sengupta, K. Garai, J. Balaji, N. Periasamy, S. Maiti, Biophys. J. 2003, 84, 1977– 1984.
[70] M. F. Khan, M. K. Singh, S. Sen, J. Phys. Chem. B 2016, 120, 1008–1020.
[71] B. Zhang, H. Liu, X. Huang, C. Dong, J. Ren, Anal. Chem. 2017, 89, 12609–12616. [72] P. K. Harimech, S. R. Gerrard, A. H. El-Sagheer, T. Brown, A. G. Kanaras, J. Am.
Chem. Soc. 2015, 137, 9242–9245.
[73] M. P. Shortell, R. A. Hewins, J. F. S. Fernando, S. L. Walden, E. R. Waclawik, E. A. Jaatinen, Opt. Express 2016, 24, 17090.
[74] P. H. C. Eilers, Anal. Chem. 2003, 75, 3631–3636.
[75] R. Schafer, IEEE Signal Process. Mag. 2011, 28, 111–117.
[76] F. Pérez, B. E. Granger, J. D. Hunter, Comput. Sci. Eng. 2011, 13, 13–21. [77] J. P. Brody, P. Yager, Sens. Actuators A 1997, 58, 13–18.
SUPPORTING INFORMATION
Oligonucleotide synthesis and purification
Standard DNA phosphoramidites, solid supports, and additional reagents were purchased from Link Technologies Ltd, Glen Research and Applied Biosystems Ltd. All oligonucleotides were synthesized on an Applied Biosystems 394 automated DNA/ RNA synthesizer using a standard 0.2 μmole phosphoramidite cycle of acid-catalyzed detritylation, coupling, capping, and iodine oxidation. Stepwise coupling efficiencies and overall yields were determined by the automated trityl cation conductivity monitoring facility and in all cases were >98.0%. All -cyanoethyl phosphoramidite monomers were dissolved in anhydrous acetonitrile to a concentration of 0.1 M immediately prior to use. The coupling time for normal A, G, C, and T monomers was 60 s, and the coupling time for the thiol-modifier C6 S-S CE phosphoramidite monomer (from Link Technologies Ltd, 2126-F100) was extended to 600 s. Cleavage of the oligonucleotides from the solid support and deprotection was achieved by exposure to concentrated aqueous ammonia solution for 60 min at room temperature followed by heating in a sealed tube for 5 h at 55 °C.
The oligonucleotides were purified by reversed-phase HPLC on a Gilson system using an XBridgeTM BEH300 Prep C18 10M 10x250 mm column (Waters) with a gradient of
acetonitrile in ammonium acetate (0% to 50% buffer B over 30 min, flow rate 4 mL/min), buffer A: 0.1 M ammonium acetate, pH 7.0, buffer B: 0.1 M ammonium acetate, pH 7.0, with 50% acetonitrile. Elution was monitored by UV absorption at 300 nm. After HPLC purification, oligonucleotides were desalted using NAP-10 Sephadex columns (GE Healthcare). All oligonucleotides were characterised by negative-mode electrospray HPLC-mass spectrometry in water, using a Bruker Daltronics micrO-TOF HPLC-mass spectrometer, using an Acquity UPLC BEH C18 1.7 μm HPLC column (Waters), with a gradient of TEAA/CH3CN in TEAA/HFIP buffer, increasing from 5-40% buffer B over 14 minutes, with a flow rate of 0.1 mL min-1 (buffer A: 10 mM TEAA, 100 mM HFIP (H
2O); buffer B: 20 mM TEAA (CH3CN)). Raw data was processed/deconvoluted using the DataAnalysis function of the Bruker Daltronics CompassTM 1.3 software package.
Table S1. Oligonucleotide sequences and mass spectrometry. X = thiol-modifier C6 S-S. Electrospray Mass spectrometry of oligonucleotides was recorded in water using a Bruker micrOTOFTM II focus ESI-TOF MS
instrument in ES- mode. Raw data was processed/deconvoluted using the DataAnalysis function of the Bruker
Daltronics CompassTM 1.3 software package.
Code Oligonucleotide sequences (5´to 3´) Calc. Found
A XTTTGCCTGGAGATACATGCACATTACGGCTTTCCCTATTA GAAGGTCTCAGGTGCGCGTTTCGGTAAGTAGACGGGACC AGTTCGCC 27177 27179 B XTTTCGCGCACCTGAGACCTTCTAATAGGGTTTGCGACAG TCGTTCAACTAGAATGCCCTTTGGGCTGTTCCGGGTGTGG CTCGTCGG 27167 27168 C XTTTGGCCGAGGACTCCTGCTCCGCTGCGGTTTGGCGAAC TGGTCCCGTCTACTTACCGTTTCCGACGAGCCACACCCGG AACAGCCC 26942 26943 D XTTTGCCGTAATGTGCATGTATCTCCAGGCTTTCCGCAGCG GAGCAGGAGTCCTCGGCCTTTGGGCATTCTAGTTGAACGA CTGTCGC 27136 27135
Synthesis and characterization of ssDNA-AuNP monoconjugates and
DNA-linked AuNP dimers
Figure S1. Schematic representation of the synthesis and purification of the four monomer ssDNA-AuNP monoconjugates, and the two DNA-linked AuNP dimers with interparticle links of 26 ('short link' AD) resp. 146 bp ('long link' BC).
Spherical gold nanoparticles of 12 ± 3 nm diameter were synthesised using the well established Turkevich et al.[S1] method modified later on by Frens et al.[S2] A solution of sodium tetrachloroaurate (100 mL, 1 mM) was brought to 100 °C with mild stirring. Once
boiling, a warm solution of trisodium citrate (5 mL, 2% wt/V) was added with vigorous stirring. A colour change occurred from yellow to colourless to dark purple and finally to red. Once the red colour was obtained, the boiling and the stirring were maintained for 15 additional minutes before allowing the reaction mixture to cool down to room temperature. Transmission electron microscopy (TEM) analysis of the citrate AuNPs is shown in Figure S2.
Figure S2. (a) TEM picture and (b) Size distribution histogram of 12 ± 3 nm gold nanoparticles synthesised using the Turkevich method. Scale bar is 200 nm and total count is 400 particles
Particles were then incubated with BSPP to increase the stability by replacing the citrate (15 mg).[S3] After overnight stirring, NaCl was added to aggregate the particles. Aggregation was confirmed by a colour change from red to dark blue. The aggregated particles were then subject to centrifugation at 25,000 x g for 30 min at 25 °C and re-suspended in phosphate buffer (20 mM phosphate, 5 mM NaCl) prior to DNA functionalization.
Two types of dimers with different linker lengths were assembled through DNA hybridisation. AuNPs (12 ± 3 nm) dissolved in phosphate buffer were incubated in a 1:1 ratio with disulfide-functionalized oligonucleotides (A, B, C or D, Table S1). An aqueous solution of BSPP (bis(p-sulfonatophenyl)phenylphosphine dihydrate dipotassium salt, 10 µL, 1 mg/20 µL) was added to the solution of disulfide-terminated oligonucleotide. This mixture
was left while shaking for 1 h prior to being added to the nanoparticle solution. The AuNP-oligonucleotide monoconjugates of each strand were purified using agarose gel electrophoresis (1.75% in 0.5xTBE) run at 100 V for 45 minutes. After diffusion from the gel the monoconjugates were centrifuged for 20 min at 25 000 x g and redispersed in hybridization buffer (50 µL, 6 mM phosphate, 80 mM NaCl). Particles bearing the strands A and B were mix as well as the one bearing C and D in a ratio 1:1. Dimer hybridisation was then carried out by heating up the solutions to 75°C and leaving them to cool down to room temperature slowly. After a second agarose gel electrophoresis (1.75% in 0.5 x TBE) run at 100 V for an hour final dimers AD and BC were extracted from the gel. A last centrifugation was performed for 30min at 25 000 x g and the dimers were redispersed in Mili-Q water.
Figure S3. Agarose gel electrophoresis (1.75% in 0.5xTBE) for the separation of ssDNA-AuNP monoconjugates. With Lane 1- 12 ± 3 nm AuNP-BSPP and Lane 2 – AuNP-ssDNA conjugates
The ssDNA-AuNP monoconjugates and DNA-linked dimers were analyzed by agarose gel electrophoresis. As seen in the Figure S4a, both the short-link and long-link AuNP dimers (Lane 3 - AD and Lane 4 - BC, respectively) are delayed compared to BSPP-coated AuNPs or ssDNA-AuNP monoconjugates due to the increase in size of the assemblies. A further delay is noticed for BC dimers compared to AD dimers. This is attributed to their larger interparticle distance. After purification the dimer assemblies were characterised using transmission electron microscopy(Figure S4b).
All samples were deposited on Carbon Film 400 Mesh Copper grids for transmission electron microscopy (TEM) imaging. All TEM images were obtained on a Hitachi H7000 transmission electron microscope operating at a bias voltage of 75 kV. On the TEM images
the difference between the interparticle distance (26 bp for AD and 146 bp for dimer-BC) cannot be noticed. Since in duplex DNA, each base pair ideally adds a length of 0.34 nm, the AuNP dimers should theoretically be separated by at least 8.84 nm (i.e. the theoretical length of the double stranded part of the linkers). However, the TEM image shows AuNPs in the dimers in close proximity. This observation is the result of the capillary drying forces and Van der Waals nanoparticle attractions occurring during the TEM grid drying and is not representative for the distance in solution.[S4]
Figure S4. (a) Agarose gel electrophoresis (1.75% in 0.5xTBE) for the purification of DNA-AuNP dimers. With Lane 1- 12 ± 3 nm BSPP AuNPs, Lane 2- Strand A ssDNA-AuNP monoconjugates (AuNP-A), Lane 3- AD DNA-AuNP dimers and Lane 4 - BC DNA-AuNP dimers. TEM images: (b) AD and (c) BC DNA-linked 12 nm AuNP dimers. Scale bars are 200 nm.
Whittaker-Eilers smoother
The Whittaker-Eilers smoother was implemented in Python 3.6.1 with the numpy 1.12.1 and scipy 0.19.0 extensions (Anaconda Python Distribution, Anaconda, Inc., Austin, Texas, USA). The original Matlab program by Eilers[S5] uses the sparse Cholesky solver for solving the matrix equation involved in the smoothing procedure, but since a sparse Cholesky solver is not available in the 'scipy' sparse matrix library, we chose the sparse LU-decomposition based solver instead ('scipy.sparse.linalg.splu'). Our Python implementation was tested with the data provided with the original publication,[S5] and gave identical smoothing results. The core function is given here.
import numpy as np
import scipy.sparse as sparse from scipy.sparse.linalg import splu def speyediff(N, d, format='csc'): """
Construct a d-th order sparse difference matrix based on an initial N x N identity matrix (utility function)
Final matrix (N-d) x N """
assert not (d < 0), "d must be non negative" shape = (N-d, N)
diagonals = np.zeros(2*d + 1) diagonals[d] = 1.
for i in range(d):
diff = diagonals[:-1] - diagonals[1:] diagonals = diff
offsets = np.arange(d+1)
spmat = sparse.diags(diagonals, offsets, shape, format=format) return spmat
def whittaker_smooth(y, lmbd, d = 2): """
Implementation of the Whittaker smoothing algorithm, based on the work by Eilers [1].
[1] P. H. C. Eilers, "A perfect smoother", Anal. Chem. 2003, (75), 3631-3636
The larger 'lmbd', the stronger the smoothing.
This implementation applies to complete data series (no missing points), sampled at equal intervals.
It uses sparse matrices enabling high-speed processing of large input vectors
Arguments :
y : vector containing raw data
lmbd : parameter for the smoothing algorithm (roughness penalty) d : order of the smoothing
Returns :
z : vector of the smoothed data. """ m = len(y) E = sparse.eye(m, format='csc') D = speyediff(m, d, format='csc') coefmat = E + lmbd * D.conj().T.dot(D) z = splu(coefmat).solve(y) return z
Quantum-efficiency normalized light scattering spectrum: comparison of
experiment with Mie theory
Figure S5. QENLS spectrum calculated using Mie theory and idealized 12 nm gold nanospheres in pure water (dotted line), comparison with experimental QENLS spectrum for monomeric "A" DNA-modified AuNPs (solid red line). The spectra have not been re-scaled, and come directly from theory and experiment, respectively, demonstrating that they are within the same order of magnitude (scattering efficiency at maximum ~ 10-3). The
Mie calculation was realized using a previously published Python computer program.[S6]
Microfluidic diffusion coefficient measurements
Figure S6. Microfluidic circuit used for the determination of diffusion coefficients. Blue arrows indicate fluid
flow direction. The length of the flow interaction zone is 50 mm, with width 200 µm and height 140 µm. After splitting the flow, each channel follows a long serpentine channel for additional hydrodynamic resistance.
References for supporting information
[S1] J. Turkevich, P. C. Stevenson, J. Hillier, Discuss. Faraday Soc. 1951, 11, 55. [S2] G. Frens, Nat. Phys. Sci. 1973, 241, 20–22.
[S3] G. Schmid, A. Lehnert, Angew. Chem. Int. Ed. Engl. 1989, 28, 780–781.
[S4] S. J. Barrow, A. M. Funston, X. Wei, P. Mulvaney, Nano Today 2013, 8, 138–167. [S5] P. H. C. Eilers, Anal. Chem. 2003, 75, 3631–3636.