HAL Id: hal-01420956
https://hal.archives-ouvertes.fr/hal-01420956
Submitted on 21 Dec 2016
HAL is a multi-disciplinary open access
archive for the deposit and dissemination of
sci-entific research documents, whether they are
pub-lished or not. The documents may come from
teaching and research institutions in France or
abroad, or from public or private research centers.
L’archive ouverte pluridisciplinaire HAL, est
destinée au dépôt et à la diffusion de documents
scientifiques de niveau recherche, publiés ou non,
émanant des établissements d’enseignement et de
recherche français ou étrangers, des laboratoires
publics ou privés.
Automatic Anomaly Detection for Dysarthria Across
Two Speech Styles: Read vs Spontaneous Speech
Imed Laaridh, Corinne Fredouille, Christine Meunier
To cite this version:
Imed Laaridh, Corinne Fredouille, Christine Meunier. Automatic Anomaly Detection for Dysarthria
Across Two Speech Styles: Read vs Spontaneous Speech. 10th Language Resources and Evaluation
Conference, LREC 2016, May 2016, Portoroz, Slovenia. �hal-01420956�
Automatic Anomaly Detection for Dysarthria Across Two Speech Styles:
Read vs Spontaneous Speech
Imed Laaridh
1,2, Corinne Fredouille
1, Christine Meunier
21University of Avignon, CERI/LIA, France
2Aix Marseille Universit´e, CNRS, LPL UMR 7309, 13100, Aix-en-Provence, France
[email protected], [email protected], [email protected] Abstract
Perceptive evaluation of speech disorders is still the standard method in clinical practice for the diagnosing and the following of the condition progression of patients. Such methods include different tasks such as read speech, spontaneous speech, isolated words, sustained vowels, etc. In this context, automatic speech processing tools have proven pertinence in speech quality evaluation and assistive technology-based applications. Though, a very few studies have investigated the use of automatic tools on spontaneous speech. This paper investigates the behavior of an automatic phone-based anomaly detection system when applied on read and spontaneous French dysarthric speech. The behavior of the automatic tool reveals interesting inter-pathology differences across speech styles. Keywords: Dysarthria, automatic speech processing, anomaly detection, read speech, spontaneous speech, speech disorders
1.
Introduction
Dysarthria is a motor speech disorder resulting from neu-rological damages located either in the central or in the peripheral nervous system. This may lead to disturbances in any of the components involved in the speech produc-tion, including respiratory, phonatory, resonatory, articu-latory and prosodic elements. Consequently, this may be reflected by weakness, spasticity, incoordination, involun-tary movements, or abnormal muscle tone, depending on the location of the neurological damage. Dysarthric speech has been studied according to different axes : perceptual evaluation of speech alterations for dysarthria classification (Darley et al., 1969; Duffy, 2005; Darley et al., 1975), dif-ferent speech tasks (Van Lancker Sidtis et al., 2012; Kem-pler and Van Lancker, 2002), perceptual measurement of dysarthria severity, notably related to the speaker’s intelligi-bility (Enderby, 1983; Yorkston et al., 1996; Hustad, 2008; Lowit and Kent, 2010) or articulatory or/and acoustic anal-ysis (Kent et al., 1999; McAuliffe et al., 2006; Rosen et al., 2006; Green et al., 2013; Whitfield and Goberman, 2014) in order to observe and characterize the effects of dysarthria in the speech signal. These studies aim at helping clinicians in their knowledge of the speech impairment and its clinical evaluation, crucial for following the condition progression of patients in the case of treatment or/and of speech reha-bilitation to enhance them.
In this context, automatic speech processing approaches have been seen, very early, as potential solutions to pro-vide objective tools to deal with speech disorders (Ferrier et al., 1992; Rosen and Yampolsky, 2000; Carmichael, 2007; Middag et al., 2009; Nuffelen et al., 2009; Kim and Kim, 2012). In addition, they can also help people with speech disorders in their everyday life through Alternative and Augmented Communication (AAC) tools, involving auto-matic speech recognition for instance (Green et al., 2003; Parker et al., 2006; Rudzicz et al., 2012; Christensen et al., 2013a; Christensen et al., 2013b).
In the literature, the set of acoustic-perceptual cues in-cluding imprecision of consonants, distorsion of vowels,
slow rate, monopitch, monoloudness, hypernasality is com-monly used to characterize the main disturbances of the various types of dysarthria in the speech production. But, more descriptive acoustic and phonetic analyses are still necessary to take into account the large variability in terms of speech alterations observed among people in differ-ent groups of diseases, within the same group (Tomik and Guiloff, 2010) or across different speech styles (read speech, spontaneous speech, singing, isolated words, etc). Moreover, so that such analyses are relevant, they require a large number of people with speech disorders, a variety of diseases related to the different types of dysarthria (spastic, flaccid, ataxic, hyper- or hypokinetic, unilateral upper mo-tor neuron, or mixed), various levels of condition progres-sion and of severity degree in order to observe their effects on the speech production as well as the possible compen-sation strategies set up by speakers. Still here, automatic speech processing approaches would be of major interest in the task of focusing the attention of human experts on specific speech segments (among a large amount of speech productions) exhibiting unexpected acoustic patterns com-pared with a normal speech production.
As reported in (Chandola et al., 2007) in a more general context, anomaly detection refers to the problem of finding patterns in data that do not conform to an expected behav-ior. In dysarthric speech, anomalies can refer to the unex-pected acoustic patterns mentioned above and observed at different units of speech like phones for instance.
In previous works (Fredouille and Pouchoulin, 2011; Laaridh et al., 2015a), the authors have proposed an au-tomatic phone-based anomaly detection approach in two steps : a text-constrained phone alignment to obtain the phone segmentation and a classification of speech segments into normal and abnormal phones (anomalies). Further-more, in (Laaridh et al., 2015b), the quality of the automatic phone alignment was studied and found to be depending on phonetic categories, pathologies and the severity of the dysarthria. In this paper, the authors investigate the impact of the speech styles on the automatic anomaly detection and
classification process, focusing on read and spontaneous speech. Indeed, comparative studies on motor speech disor-ders have found different articulatory and voice character-istics (for instance speech rate and breath-pause positions (Brown and Docherty, 1995)) between speech styles. Also, it could be expected that dysarthric speakers develop strate-gies to avoid ”difficult” linguistic contexts. Such stratestrate-gies could only be applied during spontaneous speech. Within this context, it is interesting to study whether our classi-fication system is able to detect anomalies in spontaneous speech and whether it has the same behavior as when facing read dysarthric speech. This study is conducted in the con-text of French dysarthric speech produced by people suffer-ing from four different pathologies.
The rest of this paper is organized as follows. In section 2, both steps of the automatic anomaly detection approach are described. The corpora used in this study are presented in section 3. In section 4, the behavior of the approach fac-ing both read and spontaneous speeches is compared and discussed. Finally, section 5 provides a conclusion and di-rections for future works.
2.
Automatic Anomaly Detection
The anomaly detection approach studied here relies on two steps. The first step is a text-constrained phone alignment. The second step consists of a two class (normal and abnor-mal phones) supervised classification. In each class, phones are characterized by a set of features considered as relevant for the discrimination task.
2.1.
Automatic Phone-based Alignment
The segmentation of speech utterances into phones is car-ried out thanks to an automatic text-constrained phone alignment tool. This tool takes as input the sequence of words pronounced in each utterance and a phonetized phonologically-varied lexicon of words based on a set of 37 French phones. The sequence of words comes from a manual orthographic transcription performed by a human listener following some annotation rules. For this manual transcription, inter-pausal units (IPUs) are annotated by the human listener. An IPU is defined as a pause-free unit of speech separated from another IPU by at least 250ms of silence or non-speech. The automatic alignment process is then based on a Viterbi decoding and graph-search al-gorithms, the core of which is the acoustic modeling of each phone, based on a Hidden Markov Model (HMM). In this work, each phone is modeled using a 3-state context-independent HMM topology which are built using the Max-imum Likelihood Estimate paradigm on the basis of about 200 hours of French radiophonic speech recordings (Gal-liano et al., 2005). In order to get speaker-dependent mod-els, a three-iteration Maximum A Posteriori (MAP) adap-tation is performed to adapt all the HMM parameters. This automatic alignment process results in a couple of start and end boundaries per phone produced in the speech record-ings.
2.2.
Normal And Abnormal Speech
Classification
This step aims at characterizing each phone with a set of features found to be relevant for the anomaly detection task. The set of features used is mainly derived from the auto-matic text-constrained phone alignment outputs. For each phone p and its associated speech segment yp, the following
features and acoustic scores are extracted:
• the phone duration, expressed in terms of the number of 10ms frames covered by yp;
• the number of frames in ypfor which the one-best state
search among the HMM-based phone models, applied at the frame level, corresponds to those of p;
• the acoustic score of the best matching phone p0,
ob-tained by computing the scores of all the HMM phone models on segment yp; if p is the best matching phone,
the second-best matching phone is considered instead; • the phonetic category of p0;
• the acoustic score of the second-best matching phone p00; if p is one of the two best matching phones, the third one is considered instead;
• the phonetic category of p00;
• the acoustic score of p and its rank compared to the scores of all the HMM phone models.
The classification task is based on Support Vector Machines (SVM), which have been largely applied to pattern recogni-tion problems (Vapnik, 1995)(Scholkopf and Smola, 2001). Here, the SVM classification method is applied to a two-class problem: discriminating between normal and abnor-mal phones (anoabnor-malies). Each phone is characterized with the set of features defined above. All the SVMs are used with a polynomial kernel.
In order to better take into account each phonetic category specificities and to refine abnormal and normal classes, dif-ferent SVM models are trained by distinguishing the speech productions by gender and phonetic categories (unvoiced consonants, voiced consonants, oral vowels, nasal vowels). The different SVM models are trained using the SVMlight tool (see (Joachims, 1999) for more information).
3.
Corpora
The current study is based on two speech corpora.
Table 1: Information related to the LSD-corpus used in the modeling process including the # of speakers, the # of recordings and the minimum and maximum Dysarthria Severity Degrees (DSD) per disease.
Disease # of # of (Min;Max)
speakers recordings DSD
LSD 8 35 (1.5;3.0)
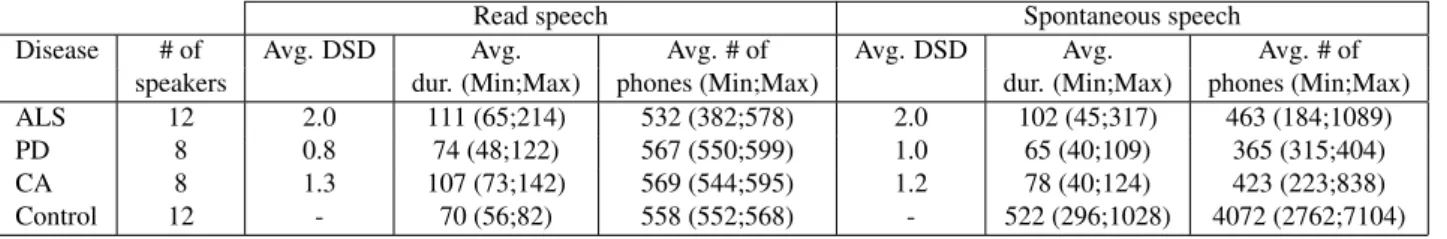
-Table 2: Information related to the Typaloc corpus including the # of speakers, the average Dysarthria Severity Degrees (DSD) and the average and (Min;Max) of recording duration (sec.) and # of phones from the automatic alignment per disease and speech style.
Read speech Spontaneous speech
Disease # of Avg. DSD Avg. Avg. # of Avg. DSD Avg. Avg. # of
speakers dur. (Min;Max) phones (Min;Max) dur. (Min;Max) phones (Min;Max)
ALS 12 2.0 111 (65;214) 532 (382;578) 2.0 102 (45;317) 463 (184;1089)
PD 8 0.8 74 (48;122) 567 (550;599) 1.0 65 (40;109) 365 (315;404)
CA 8 1.3 107 (73;142) 569 (544;595) 1.2 78 (40;124) 423 (223;838)
Control 12 - 70 (56;82) 558 (552;568) - 522 (296;1028) 4072 (2762;7104)
The first corpus (LSD-corpus) contains 8 dysarthric speak-ers and 6 control subjects. The dysarthric speakspeak-ers had been diagnosed with rare Lysosomal Storage Diseases (LSD), re-sulting in a mixed dysarthria, and showed disparities in the Dysarthria Severity Degree (DSD). All the speakers were asked to read the same text, a French fairytale called “Le cordonnier” (The cobbler), as naturally as possible and they each recorded 3 to 6 longitudinal records approximately ev-ery six months. All the speech utterances were annotated by a human expert in order to identify acoustic anomalies at the phone level. Consequently, this corpus was involved in the estimate of the normal and abnormal models required in the classification step described in section 2.2.. Table 1 provides information on this corpus.
The second corpus, named Typaloc (Meunier et al., 2016), contains 28 dysarthric speakers and 12 control subjects. Each speaker read the same text as the LSD-corpus and made an additional spontaneous speech record. For both dysarthric and control speakers, the spontaneous speech sit-uation was an interview conducted by a researcher/clinician in which they had to talk about their everyday life, per-sonal history or even particular events. Unlike the first cor-pus in which only LSD patients were recorded, this corcor-pus presents various diseases and types of dysarthria: Amy-otrophic Lateral Sclerosis (ALS)/mixed dysarthria, Parkin-son’s Disease (PD)/hypokinetic dysarthria and Cerebel-lar Ataxia (CA)/ataxic dysarthria distributed over various DSDs. All the patient’s speech recordings were evaluated perceptually by a jury of 11 experts who were asked to rate each patient on perceptual items of speech quality. Among these items, we focus on the DSD rated on a scale of 0 to 3 (0 -no dysarthria, 1 -mild, 2 - moderate, 3 -severe dysarthria). Table 2 provides information on the Typaloc corpus grouped per pathology and speech style. This in-cludes the number of patients, the average values of the DSD and the average and (Min;Max) of recording duration (sec.) and number of phones in the automatic alignment per speaker within each population.
We can point out that the spontaneous speech productions are shorter (duration and # of phones) than the read speech productions independently of pathologies. Indeed, patients are usually less prone to talk spontaneously due, not only to their pathologies and the fatigue effect, but also to the speech elicitation techniques used, which are not always fully adapted to this kind of speakers.
4.
Results And Discussions
This section details and discusses the behavior of the auto-matic anomaly detection approach for both read and spon-taneous speech on the Typaloc corpus.
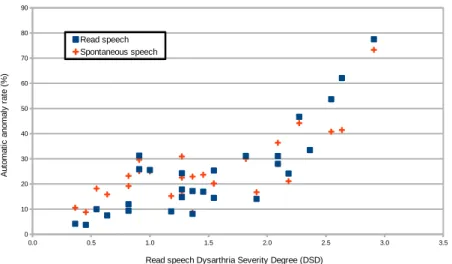
As reported in (Laaridh et al., 2015a) on read speech, the approach tends to detect more anomalies on patients with severe dysarthria. This behavior, though less dis-tinct, seems preserved on spontaneous speech. Indeed, the correlation between the automatic anomaly rates and the DSD reaches 0.81 and 0.60 for read and sponta-neous speech respectively. Similarly, figure 1 depicts the automatic anomaly rates for both read and spontaneous speech according to the patients’ DSD rated on the read speech uniquely (this typical configuration permits to lo-cate anomaly rates for both read and spontaneous speech for each speaker more easily). This confirms that the sys-tem is able to detect the evolution of dysarthria regardless of the production task performed by the patients (read or spontaneous speech).
Table 3: Average anomaly rate (%) per pathology and speech style computed over all phones.
Disease Read speech Spontaneous speech
ALS 35.8 31.9
PD 10.6 17.8
CA 20.6 24.4
Control 5.4 13.7
In a more detailed way, table 3 reports automatic anomaly detection rates on read and spontaneous speech grouped by population.
First, We observe that over the control speakers, the ap-proach detects more anomalies over spontaneous speech compared to read speech. This could be related to the fact that our models of normal and abnormal phones (section 2.2.) were built over read speech only. Indeed, sponta-neous speech may present more acoustic variability that is atypical (compared to read speech) without being patho-logical. This variation may be due to faster speech rate, false starts, hesitations and phone reductions more fre-quent in spontaneous speech. Figure 2 depicts the rela-tion between the read speech DSD and the difference of automatic anomaly detection rates between spontaneous and read speech (anomaly rate over spontaneous speech −
Figure 1: Relationship between the automatic anomaly rate and the dysarthria severity degree when applied on the Typaloc corpus.
anomaly rate over read speech); each point representing one speaker (either control or patient). Observing table 3 and figure 2, we find that, as for control speakers, the automatic approach detects more anomalies on spontaneous speech for PD and CA patients.
Figure 2: Distribution of differences between spontaneous and read speech anomaly rates according to read speech DSD.
These observations are consistent with results found in (Van Lancker Sidtis et al., 2012; Kempler and Van Lancker, 2002) on patients suffering from PD. In these papers, spon-taneous speech was found to be less intelligible and con-tained more disfluencies than read speech. However, pa-tients suffering from ALS present similar and even lower anomaly rates on spontaneous speech compared to reading (32% and 36% respectively). In our corpus, these patients have the most severe dysarthria (highest DSDs). Further analysis of this behavior is still necessary to study whether this observation is related to intrinsic characteristics of ALS which would affect more the reading task than spontaneous speech production. A second hypothesis is that this behav-ior is more linked to the severity of the dysarthria of the patients suffering from ALS than the pathology itself.
In-deed, the spontaneous speech production task offers to pa-tients more freedom to manage their fatigue, their speech rate and the different phones and sequences of phones or words to produce, which could lead to less anomalies at the phone level.
Finally, table 3 shows a more important increase in auto-matic anomaly rates computed over spontaneous speech for control speakers compared to dysarthric patients. addition-aly, Figure 2 suggests that the difference in anomaly rates between spontaneous and read speech is inversely propor-tional to the DSD measures. This would suppose that con-trol speakers change more their productions according to the speech style (which results in our case in more anoma-lies detected over spontaneous speech considering the na-ture of our models built over read speech) while patients (especially severely dysarthric) loose this capacity to adapt themselves to different styles and tend to make their pro-ductions uniform regardless of the task (which results in less differences between measures computed over read and spontaneous speech).
Table 4 reports the automatic anomaly detection rates per pathology, phonetic category and speech style.
For control speakers, all the phonetic categories show higher anomaly rates over spontaneous speech compared to read speech. Fricatives, however, present a more important increase in the anomaly rates from 7% over read speech to 23% over spontaneous speech. For PD patients, fricatives present the highest anomaly rates for both speech styles. Unlike other phonetic categories for which the increase of automatic anomaly rates over spontaneous speech is low, fricatives show an absolute increase of 29% (112% rela-tive). This behavior suggests more an intensification of an already observed phenomenon (high anomaly rate over read speech) linked to the Parkinsonian dysarthria than the emer-gence of a new one. Observing patients suffering from ALS and even though anomaly rates are more stable across both speech styles, we find still that vowels present less anoma-lies on spontaneous than read speech (-4% and -18% for oral and nasal vowels respectively). The global decrease
Table 4: Average automatic anomaly rate (%) computed per pathology, phonetic category and speech style (read and spontaneous speech).
Read speech Spontaneous speech
Phonetic category Control PD CA ALS Control PD CA ALS
Plosives 7 12 22 37 11 16 24 35 Fricatives 7 26 48 37 23 55 53 38 Nasal consonants 7 12 21 31 19 10 19 35 Liquid consonants 7 9 23 41 15 9 27 44 Oral vowels 2 6 10 33 11 10 13 29 Nasal vowels 4 8 20 44 8 13 13 26 Other 10 16 26 46 19 13 26 37
of anomaly rates observed over ALS patients in table 3 between read and spontaneous speech is the result of the decrease observed over vowels since consonants maintain similar anomaly rates between both speech styles.
Control_R Control_S ALS_R ALS_S PD_R PD_S CA_R CA_S
0 20 40 60 80 A utomatic anom aly rate (%)
{
***{
ns{
*{
nsFigure 3: Box plot of automatic anomaly rate per popula-tion and speech style.
For each population, a one-way ANOVA was conducted in order to test the effect of speech style (2 levels: read speech, spontaneous speech). Figure 3 depicts the box plot repre-sentation of automatic anomaly rates for each population and speech style. For control and PD speakers, signifi-cant differences are found between read and spontaneous speech ((p<0.001,F(1,22)=28) and (p<0.05, F(1,14)=5.4) respectively). These differences are emphasized when focusing only on fricatives ( (p<0.001,F(1,22)=19) and (p<0.01,F(1,14)=14) for control and PD speakers respec-tively). The difference between both speech styles is less distinct for patients suffering for CA and ALS. In-deed, the speech style effect can be masked by the higher intra-pathological variability observed over both popula-tions unlike patients suffering from PD, having all a mild dysarthria.
5.
Conclusion
The study of the behavior of an automatic phone-based anomaly detection system over read and spontaneous dysarthric speech has shown different effects of the task and the speech style according to pathologies. ALS pa-tients, in contrast to all other populations (control, PD, CA),
showed more anomalies over read speech than spontaneous speech. Globally, the control speakers show the most im-portant differences according to the speech style. Consider-ing patients, the more severe the dysarthria is, the less dif-ference between styles there is. A hypothesis could be that control speakers adapt their productions according to the speech style whereas dysarthric patients tend to gradually loose this capacity. By comparing the phonetic categories, fricatives show an important increase in terms of anomaly rates on spontaneous speech compared to read speech com-pared over the control speakers and the patients suffering from PD.
Future work will examine the effect of the localization of the phones (first, second, etc. syllable) on the anomaly de-tection process in order to investigate further on these dif-ferent behaviors.
6.
Acknowledgements
This work has been carried out thanks to the support of the BLRI Labex (ANR-11-LABEX-0036) and the A*MIDEX project (ANR-11-IDEX-0001-02) funded by the “Investissements d’Avenir” French government pro-gram managed by the ANR, and thanks to the French ANR project Typaloc (ANR-12-BSH2-0003-03).
7.
Bibliographical References
Brown, A. and Docherty, G. J. (1995). Phonetic variation in dysarthric speech as a function of sampling task. In-ternational Journal of Language & Communication Dis-orders, 30(1):17–35.
Carmichael, J. (2007). Introducing objective acoustic met-rics for the Frenchay Dysarthria Assessment procedure. Ph.d. dissertation, university of sheffield.
Chandola, V., Banerjee, A., and Kumar, V. (2007). Anomaly detection: a survey. University of Minnesota (USA).
Christensen, H., Green, P., and Hain, T. (2013a). Learning speaker-specific pronunciations of disordered speech. In Proceedings of Interspeech’13, Lyon, France.
Christensen, H., Casanueva, I., Cunningham, S., Green, P., and Hain, T. (2013b). homeservice: Voice-enabled as-sistive technology in the home using cloud-based auto-matic speech recognition. In 4th Workshop on Speech and Language Processing for Assistive Technologies, pages 29–34.
Darley, F. L., Aronson, A. E., and Brown, J. R. (1969). Differential diagnostic patterns of dysarthria. Journal of Speech and Hearing Research, 12:246–269.
Darley, F. L., Aronson, A. E., and Brown, J. R. (1975). Mo-tor speech disorders. W. B. Saunders and Co., Philadel-phia.
Duffy, J. R. (2005). Motor speech disorders: substrates, differential diagnosis and management. Motsby- Year-book, St Louis, 2nd edition.
Enderby, P. (1983). Frenchay dysarthric assessment. Pro-Ed, Texas.
Ferrier, L. J., Jarrell, N., Carpenter, T., and Shane, H. C. (1992). A case study of a dysarthric speaker using the dragondictate voice recognition system. Journal for Computer Users in Speech and Hearing, 8(1):33–52. Fredouille, C. and Pouchoulin, G. (2011). Automatic
de-tection of abnormal zones in pathological speech. In Intl Congress of Phonetic Sciences (ICPHs’11), Hong Kong. Galliano, S., Geoffrois, E., Mostefa, D., Choukri, K., Bonastre, J.-F., and Gravier, G. (2005). Ester phase ii evaluation campaign for the rich transcription of french broadcast news. In Proceedings of Interspeech’05, pages 1149–1152, September.
Green, P., Carmichael, J., Hatzus, A., Enderby, P., Hawley, M., and Parker, M. (2003). Automatic speech recog-nition with sparse training data for dysarthric speak-ers. In Proceedings of Interspeech’03, pages 1189–1192, Geneva, Switzerland.
Green, J. R., Yunusova, Y., Kuruvilla, M. S., Wang, J., Pattee, G. L., Synhorsti, L., Zinman, L., and Berry, J. D. (2013). Bulbar and speech motor assessment in als: Challenges and future directions. Amyotrophic Lat-eral Sclerosis and Frontotemporal Degeneration, 14(7– 8):494–500.
Hustad, K. C. (2008). The relationship between listener comprehension and intelligibility scores for speakers with dysarthria. Journal of Speech, Language and Hear-ing Research, 51(3):562–573.
Joachims, T. (1999). Making large-scale SVM learning practical. In B. Sch¨olkopf, et al., editors, Advances in Kernel Methods - Support Vector Learning, chapter 11, pages 169–184. MIT Press, Cambridge, MA.
Kempler, D. and Van Lancker, D. (2002). Effect of speech task on intelligibility in dysarthria: a case study of parkinson’s disease. Brain and language, 80(3):449– 464.
Kent, R. D., Weismer, G., Kent, J. F., Vorperian, H. K., and Duffy, J. R. (1999). Acoustic studies of dysarthric speech: Methods, progress, and potential. The Journal of Communication Disorders, 32:3:141–186.
Kim, M. and Kim, H. (2012). Automatic assessment of dysarthric speech intelligibility based on selected pho-netic quality features. In Computers Helping People with Special Needs, volume 7383 of Lecture Notes in Com-puter Science, pages 447–450.
Laaridh, I., Fredouille, C., and Meunier, C. (2015a). Auto-matic detection of phone-based anomalies in dysarthric speech. ACM Transactions on accessible computing, 6(3):9:1–9:24, May.
Laaridh, I., Fredouille, C., and Meunier, C. (2015b). Auto-matic speech processing for dysarthria: A study of inter-pathology variability. In Proceedings of Intl Congress of Phonetic Sciences (ICPHs’15), Glasgow.
Lowit, A. and Kent, R. D. (2010). Assessment of motor speech disorders, volume 1. Plural publishing.
McAuliffe, M. J., Ward, E. C., and Murdoch, B. E. (2006). Speech production in parkinson’s disease: I. an elec-tropalatographic investigation of tongue-palate contact patterns. Clinical linguistics & phonetics, 20(1):1–18. Meunier, C., Fougeron, C., Fredouille, C., Bigi, B.,
Crevier, L., Delais-Roussarie, E., Georgeton, L., Ghio, A., Laaridh, I., Legou, T., Pillot-Loiseau, C., and Pou-choulin, G. (2016). The typaloc corpus: A collection of various dysarthric speech in read and spontaneous speech. In Proceedings of the International Conference on Language Resources and Evaluation (LREC’16), Por-toroz.
Middag, C., Martens, J.-P., Nuffelen, G. V., and Bodt, M. D. (2009). Automated intelligibility assessment of patho-logical speech using phonopatho-logical features. EURASIP Journal on Applied Signal Processing, 2009(1).
Nuffelen, G. V., Middag, C., Bodt, M. D., and Martens, J.-P. (2009). Speech technology-based assessment of phoneme intelligibility in dysarthria. International journal of language and communication disorders, 44(5):716–730.
Parker, M., Cunningham, S., Enderby, P., Hawley, M., and Green, P. (2006). Automatic speech recognition and training for severely dysarthric users of assistive technol-ogy: the stardust project. Clinical Linguistics and Pho-netics, 20(2–3):149–156.
Rosen, K. M. and Yampolsky, S. (2000). Automatic speech recognition and a review of its functioning with dysarthric speech. Augmentative and Alternative Com-munication (AAC), 16(1):48–60.
Rosen, K. M., Kent, R. D., Delaney, A. L., and Duffy, J. R. (2006). Parametric quantitative acoustic analysis of conversation produced by speakers with dysarthria and healthy speakers. Journal of Speech, Language, Hear-ing Research, 49(2):395–411.
Rudzicz, F., Namasivayam, A. K., and Wolff, T. (2012). The torgo database of acoustic and articulatory speech from speakers with dysarthria. In Proceedings of the International Conference on Language Resources and Evaluation (LREC’12), pages 523–541.
Scholkopf, B. and Smola, A. J. (2001). Learning with Kernels: Support Vector Machines, Regularization, Op-timization, and Beyond. MIT Press, Cambridge, MA, USA.
Tomik, B. and Guiloff, J. (2010). Dysarthria in amy-otrophic lateral sclerosis: a review. Amyamy-otrophic Lateral Sclerosis, 11 (1–2):4–15.
Van Lancker Sidtis, D., Cameron, K., and Sidtis, J. J. (2012). Dramatic effects of speech task on motor and linguistic planning in severely dysfluent parkinsonian speech. Clinical linguistics & phonetics, 26(8):695–711. Vapnik, V. (1995). The Nature of Statistical Learning
The-ory. Springer-Verlag New York, Inc., New York, NY, USA.
Whitfield, J. A. and Goberman, A. M. (2014). Articulatory-acoustic vowel space: Application to clear speech in individuals with parkinson’s disease. Journal of communication disorders, 51:19–28.
Yorkston, K. M., Strand, E., and Kennedy, M. (1996). Comprehensibility of dysarthric speech: implications for assessment and treatment planning. American Journal of Speech Language Pathology, 55:55–66.