HAL Id: hal-03033985
https://hal.archives-ouvertes.fr/hal-03033985
Submitted on 4 Dec 2020
HAL is a multi-disciplinary open access
archive for the deposit and dissemination of
sci-entific research documents, whether they are
pub-lished or not. The documents may come from
teaching and research institutions in France or
abroad, or from public or private research centers.
L’archive ouverte pluridisciplinaire HAL, est
destinée au dépôt et à la diffusion de documents
scientifiques de niveau recherche, publiés ou non,
émanant des établissements d’enseignement et de
recherche français ou étrangers, des laboratoires
publics ou privés.
InPReSS: Indoor Plan Reconstruction Using the
Smartphone’s Five Senses
Jean-Gabriel Krieg, Gentian Jakllari, André-Luc Beylot
To cite this version:
Jean-Gabriel Krieg, Gentian Jakllari, André-Luc Beylot. InPReSS: Indoor Plan Reconstruction Using
the Smartphone’s Five Senses. IEEE International Conference on Communications - ICC 2018, May
2018, Kansas City, MO, United States. pp.1–6, �10.1109/ICC.2018.8422975�. �hal-03033985�
InPReSS: INdoor Plan REconstruction Using the
Smartphone’s Five Senses
Jean-Gabriel Krieg, Gentian Jakllari, André-Luc Beylot
University of Toulouse – IRIT {jeangabriel.krieg, jakllari, beylot}@enseeiht.fr
Abstract—Today, we can use our smartphones to drive from
Los Angeles to New York, yet we can not use them to find our way around Charles de Gaulle Airport. GPS simply does not work indoors and if outside areas are mapped very well, the indoors of most buildings remain a mystery to our favorite navigation apps. While the problem of indoor localization has attracted a lot of attention, with several solutions with meter-level accuracy emerging as research prototypes, the problem of building accurate and detailed indoor maps has been overlooked. We present InPReSS, a smartphone-based solution for dy-namic indoor map construction without explicit user input. It leverages the sensors available on off-the-shelf smartphones and their ubiquity to construct floor plans as users go about their daily lives. The InPReSS approach consists of four steps: 1. Collecting readings from five sensors, tagged with their location, from smartphones available in the target building, and divide the floor plan into cells using a Voronoi diagram. 2. Clustering the cells into rooms based on the sensor readings. 3. Identifying doors and ways between adjacent rooms using the Voronoi diagram and user movement traces. 4. Building a two-level graph of the floor plan for navigation. Experiments with an Android prototype in two different buildings show that InPReSS can build highly accurate floor plans with minimum user input and negligible impact on battery life.
I. INTRODUCTION
Someone named Carol enters a building, such as an airport or a big office space. Late and lost, her smartphone receives no GPS fix. She could use her favorite indoor localization application [1], [2], [3] to localize herself indoors with meter-level accuracy. There is only one issue: her application does not have the building’s floor plan.
Whereas outdoor areas have already been mapped and digitized by numerous applications such as Google Maps [4] or Yahoo Maps [5], it is far more difficult to achieve the same for indoor areas. Outdoor areas can be easily accessed by motorized vehicles, drones or even satellites. Indoors, the process is still heavily manual – Google Indoor Maps [6], for example, has collected manually more than 10,000 indoor floor plans of airports and shopping malls. To make matters worse, indoor plans are less stable than outdoor plans. Buildings are regularly reorganized, new rooms created, some doors are blocked while others are added, furniture changes place, etc. Each change could necessitate a new and expensive update of the indoor plan. Ideally, indoor plans should be created and updated dynamically, without any manual labor. Given the number of people with smartphones inside every building, leveraging the readings from the many sensors with which the smartphones are equipped could provide a practical answer
to such a formidable challenge. Unfortunately, even if recent works [7], [8], [9], [10], have started to introduce some solutions, a lot more work remains to be done.
Extending indoors the navigation experience enabled by GPS in most outdoors areas has been a popular research topic in recent years. Simultaneous localization and mapping (SLAM) [11], inspired by robotics, has been proposed to solve the mapping issue. The SLAM techniques address jointly the challenge of localization and mapping: while a robot navigates a building using an Inertial Measurement Unit (IMU) it mines its sensor readings so as to map its surroundings, including the walls. The performance of a SLAM system relies on two main parameters: the accuracy and predictability of the robot movement and the robot’s ability to analyze the surroundings by detecting obstacles with sonar or lasers for example. Hence the difficulty to use SLAM on smart-phones: First, the user movement is unpredictable and the smartphone IMU units are inaccurate [12]. Second, off-the-shelf smartphones are not equipped with laser or sonars to identify walls and obstacles, crucial for indoor mapping. The Wi-Fi transceivers, available on all smartphones, for example, are not capable of detecting walls by themselves [13], [14]. WiFi-SLAM [7], graphSLAM [9] and [10] propose to use Wi-Fi fingerprinting and crowdsourcing to evaluate building plans. However, a heavy offline phase is necessary to collect the fingerprints. JigSaw [15] bypasses the need for Wi-Fi by using the smartphone camera to collect images from users inside buildings to construct indoor floor plans. However, the solution requires heavy image processing and, most important, it requires active user participation – they have to hold their smartphones in a specific position.
We propose InPReSS, a lightweight system that leverages the smartphone sensors to reconstruct building floor plans dynamically without any training or user action. InPReSS breaks the problem into four parts: First, the entire floor1 of
a particular building is divided into cells, based on location information from smartphones inside the building, using a Voronoi diagram. Second, using ambiance sensor readings, cells are clustered into rooms. Third, InPReSS identifies the possible ways between the rooms by observing user movements, completing the indoor plan. Finally, InPReSS constructs a two-level graph for optimizing indoor navigation.
InPReSS faces several challenges, including how to use 1Building/floor contours are available from outdoor area surveys.
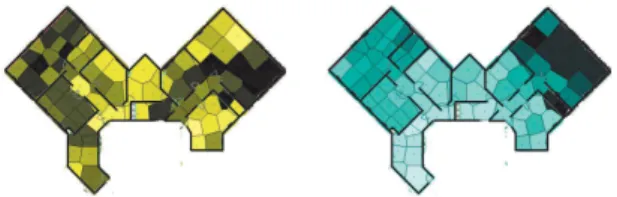
(a) Heatmap of the sound level in a480𝑚 building.
(b) Heatmap of the main Wi-Fi RSS in a480𝑚 building. Figure 1. Sound level and Wi-Fi signal are similar in the same room.
readings from inherently inaccurate and inexpensive sensors to identify walls and separations, and how to combine readings from sensors as different as the barometer and the microphone. In short, InPReSS addresses these challenges by introducing a novel dissimilarity index and careful measurement-based analysis.
In summary, our contribution can be summarized as follows:
∙ We introduce the first standalone system capable of
build-ing an indoor floor plan usbuild-ing only smartphone ambience sensors.
∙ We propose a solution for indoor navigation based on a
two-level graph.
∙ We develop InPReSS on the Android OS and carry out
experiments on two different smartphones and two differ-ent buildings. Experimdiffer-ents show that InPReSS is able to construct highly accurate indoor floor plans.
The remainder of this paper is organized as follows. tion II describes the room detection algorithm while in Sec-tion III we introduce the mechanism for identifying ways between the rooms. In Section IV we present the performance evaluation. Finally, Section VI concludes the paper.
II. ROOMDETECTION
In this section, we present InPReSS’ approach for iden-tifying the rooms inside a building. It is a constructive ap-proach consisting of three steps: First, using the Voronoi [16] diagrams, the indoor layout is divided into cells based on sensor readings. Second, working with every sensor separately, a preliminary decision is made as to where the walls are based on the difference in the readings of the particular sensor between adjacent Voronoi cells. Finally, an approach is introduced to combine the per-sensor decisions so as to generate a final placement for the walls. In the following, we describe each step in detail.
A. First-Level Area Separation
InPReSS’ room detection module is based on a simple observation: when Carol enters a room, her senses can detect differences in color, sound level, temperature, etc. Modern smartphones come equipped with several sensors: barometer, light-meter, magnetometer, microphone, Wi-Fi receiver, etc. Therefore, it is reasonable to ask whether properly mining the readings from these sensors can lead to automatic room detection by smartphones.
To verify this intuition, we conduct experiments in an office building with 11 rooms of different sizes and total area of 480 m2. A user carrying a LG Google Nexus 5 smartphone
walks around the building, making sure to enter every room, while an application is collecting sensor readings at regular intervals. At the end of the experiment, we get the following readings from80 different locations, which we also call seeds, tagged with their coordinates:
1) the measured pressure; 2) the measured luminosity;
3) the calculated magnetic power - calculated from the three axis magnetic field from the magnetometer;
4) the sound level - calculated from the microphone input; 5) the Wi-Fi main signal strength - we take only the main
RSS levels linked with the SSID. We store these values in a database 𝒮:
𝒮= (𝑠𝑖,𝑘)
𝑘∈J1;5K,𝑖∈J1;80K
where 𝑝𝑖 = (𝑥𝑖, 𝑦𝑖, 𝑧𝑖) is the position of location 𝑖, and 𝑠𝑖,𝑘
is the value of the sensor 𝑘 at this location.
We take as input the building footprint, which can be obtained from external mapping systems such as Google Maps [4], and use Voronoi diagrams [16] to partition it into cells based on the distance to the 80 seeds.
Figure 1(a) shows the sound levels computed from the microphone readings at the 80 locations. Each Voronoi cell is given a color corresponding to its seed value and is projected on the building’s blueprint. The data shows that there is some correlation between sound levels and rooms, however, it is not perfect. For example, the blueprint shows one big room on the right side of the building while the sound levels would indicate two different rooms. To overcome the limitations of a single sensor, we propose to combine it with another, such as the Wi-Fi. Figure 1(b) shows the voronoi cells, constructed using the Wi-Fi received signal strengths (RSS) at the 80 seeds, projected on the building’s blueprint. Here, we see that the RSS levels in the big room at the right corner are very similar, indicating a single room, which matches the ground truth.
Based on this experiment, we can reach two conclusions: First, there is a correlation between sensor readings and room separations inside buildings. However, one needs a systematic approach to turn readings from various sensors into a building blueprint. We address this challenge in § II-B.
Second, readings from several sensors are necessary for constructing correct building blueprints. However, an approach for combining conclusions based on sensors as different as the barometer and the Wi-Fi receiver is necessary. We address this challenge in § II-C.
B. Identifying Walls Part I: Using a Single Sensor
To identify a physical separation between two rooms, i.e. a wall, we measure the dissimilarity between neighboring Voronoi cells. However, the main challenge is quantifying this dissimilarity, also referred to as distance. In a colored graph, it corresponds to the scale and the thresholds for coloring the
(a) Colored map of the light level in a 480𝑚 building, low thresh-olds.
(b) Colored map of the light level in a480𝑚 building, high thresh-olds.
Figure 2. Sound level and Wi-Fi signal are similar in the same room. Thresholds of a colored graph can change the choice of rooms separation.
Sensor Name Distance𝑑𝑘(𝑖, 𝑗)
Pressure Euclidean ∣𝑠(𝑖,1)− 𝑠(𝑗,1))∣ Luminosity Logarithmic ∣𝑙𝑜𝑔(𝑠(𝑖,2)/𝑠(𝑗,2))∣ Magnetic Euclidean ∣𝑠(𝑖,3)− 𝑠(𝑗,3)∣ Sound Square ∣𝑠𝑞𝑟𝑡(𝑠(𝑖,4)) − 𝑠𝑞𝑟𝑡(𝑠(𝑗,4))∣ Wi-Fi Euclidean ∣𝑠(𝑖,5)) − 𝑠(𝑗,5)∣ Table I
DISTANCE USED FOR EACH SENSOR.
graph. To illustrate the importance of selecting the proper threshold values, Fig. 2 shows the colored maps for two different threshold levels. Let us consider two rooms, labeled 1 and 2 in the figure. In Fig. 2(a) room 1 is identified by the same color (dark green) but not in Fig. 2(b). It is the opposite case for room 2: it is properly identified in Fig. 2(b) but not in Fig. 2(a).
To overcome the sensitivity to the threshold value, we study the distribution of the different sensors. Figure 3(a) shows the Cumulative Distribution Function (CDF) of the light levels measured at the 80 seeds. The luminosity is concentrated at small values corresponding to places where there is no strong light source, with only a few high values measured. The high light values correspond to seeds located just under a light source. As a consequence, if the dissimilarity between two seeds is only calculated by the absolute difference between the two values, it will lead to erroneous room splitting. For example, two seeds, one right under a light source and one nearby will have very different values even though they are located in the same room. To avoid such scenarios, the light values distribution has to be “flattened", so that the bigger the absolute values are the smaller the impact their relative differences will have on the room splitting decision. In the case of light, we choose to use the logarithm function as shown in Figure 3(b). As a result, the CDF of the light level is pseudo-linear. Figure 3(c) shows a colored map of the building using this logarithmic scale. Rooms 1 and 2 are correctly identified.
Table I presents the distances chosen for each sensor. Eu-clidean distance is used for pressure, magnetic field and Wi-Fi since the values are uniformly distributed. Square root distance is used for sound since sound levels are concentrated at low values.
C. Identifying Walls Part II: Combining Multiple Sensors
Despite the single sensor distance selection approach in-troduced above, only one sensor is not enough to perfectly determine the room separations, as demonstrated in Fig. 3(c).
(a) CDF of light level.
(b) CDF of light level in logarithmic abscissa scale.
(c) Colored map of the light level in a480𝑚 building, using logarithmic scale.
Figure 3. Light level is particularly concentrated in small values. Some very high values are caused by the presence of a nearby lamp. To get the best map using luminosity, it is necessary to smooth the small values and instead consolidate larger. For that, we can use a logarithm.
To leverage the smartphone’s five senses, one solution is to use a classical classification algorithm, such as K-means [17], hierarchical clustering [18] or expectation-maximization (EM) [19]. K-means has the disadvantage of having to decide in advance the value of 𝐾, the number of classes. Here it would mean knowing the exact number of rooms, information InPReSS obviously does not have. Hierarchical clustering and expectation-maximization do not take into account the fact that seeds have physical coordinates — yet, two physically distant seeds cannot belong to the same room. Therefore, we decided against using a cluster-based algorithm and instead used a dissimilarity threshold to detect walls between Voronoi cells. For each seed, we calculate the dissimilarity between this seed and its neighbors. If the value is greater than a threshold we assume that there is a separation (a wall) at the intersection of the two Voronoi cells.
Finally, to combine the input from all 5 sensors, we intro-duce the dissimilarity index between cell 𝑖 and 𝑗, 𝐷(𝑖, 𝑗) as
Figure 4. ROC curve of the detector. 0.8 is chosen as the best compromise threshold - in red dot.
(a) Section of the floor plan as generated at the end of § II.
(b) Same floor plan section as repre-sented in memory.
Figure 5. When a user transitions between two rooms sharing a wall, InPReSS knows there is a door but no indoor localization system is accurate enough to tell the door location. InPReSS identifies the door location by comparing the dissimilarity index of neighboring Voronoi cells. Cells 5 (room A) and 9 (room B) have the lowest index and it is where InPReSS places the door connecting the two rooms.
follows: 𝐷(𝑖, 𝑗) = 5 ∑ 𝑘=1 𝛿𝑘(𝑖, 𝑗) (1)
where 𝛿𝑘(𝑖, 𝑗) is the normalized distance 𝑑𝑘(𝑖, 𝑗).
This index also represents the 5-dimension Euclidean dis-tance between seeds 𝑖 and 𝑗 using disdis-tances 𝑑𝑘(𝑖, 𝑗). To
determine the best threshold, we use a measurement-based approach. In two different buildings, we take measurements at 100 connecting pairs of seed points. 50 seeds are located in different rooms - constituting the true dissimilarity - while the other 50 seeds are located in same rooms - constituting the false dissimilarity. Figure 4 shows the ROC (receiver operating characteristic) curve of the 5 sensor detectors. The red dot depicts the point (0.8) chosen by InPReSS – it maximizes the true dissimilarity rate (84%) while minimizing the false positive rate (10%).
III. COMPLETING THE FLOOR PLAN
In this section, we describe how InPReSS identifies doors inside a building, completing the floor plan, and how the data is represented so that it can be used by a navigation application.
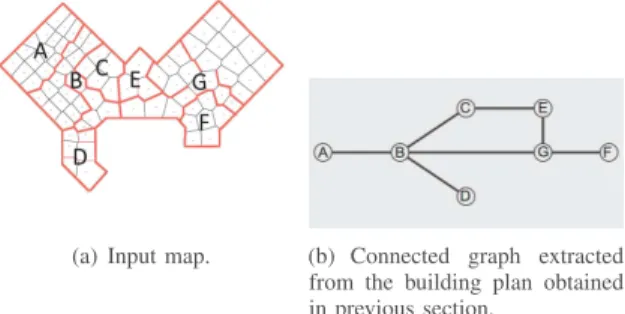
(a) Input map. (b) Connected graph extracted from the building plan obtained in previous section.
Figure 6. The path identification block aims to define what is the nature of the edges between the vertices : open door, closed door or wall.
(a) Floor-level graph. (b) Zooming in on room B to show its room-level graph. Figure 7. To facilitate navigation, InPReSS introduces a two-level graph.
A. Door Identification
With the rooms identified in § II, identifying where doors are is the last step for completing the floor plan for navigation purposes. To detect if there is a door between two rooms sharing a wall and, if that is the case, the location of the door, we rely on the movement of users running InPReSS. When a user is detected as moving from one room to another, InPreSS concludes that there is a room between these two rooms. However, most available indoor localization solutions offer only meter-level accuracy, not enough to place a door with accuracy. To address this problem, we make use of the Voronoi diagram separation of the floor plan and sensor readings collected in § II. All the adjacent Voronoi cells between the two rooms are compared using the dissimilarity index (Eq. 1) – the border between the two Voroni cells with the lowest index is transformed into a door. Fig. 5 illustrates the approach.
B. Floor Plan Representation
Navigating indoors requires user location in real time and an accurate floor plan, the main goal for InPReSS. Once these two requirements are fulfilled, the assumption is that one can simply use a shortest-path algorithm to reach their destination. However, in buildings with many alternative paths, it is preferable to minimize the numbers of rooms one crosses while at the same time using the shortest euclidian distance for crossing a particular room. To satisfy these two requirements, INPReSS introduces a two-level navigation graph. The floor-level graph (Fig. 7(a)) has a vertex for every room with an edge connecting two vertices if INPReSS has a identified a door
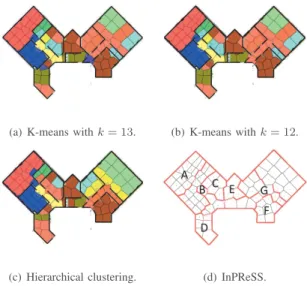
Figure 8. Blueprint of the first test building.
(a) K-means with𝑘 = 13. (b) K-means with𝑘 = 12.
(c) Hierarchical clustering. (d) InPReSS.
Figure 9. Floor plans of the test building computed using K-means, hierar-chical clustering and InPReSS. There are 12 rooms on this floor. InPReSS is the only one to identify all the indoor walls accurately.
between the respective rooms. The room-level graph (Fig. 7(b)) is based on the first-level area separation described in § II-A. For a user located, say, in room B (Fig. 7) and wanting to get to room F, InPReSS first uses the floor-level graph to find a path minimizing the number of rooms – in this case, the path B, G, F. To cross each room, say room B to reach G, InPReSS relies on the room-level graph. For example, assuming the user’s initial location is in cell 12 (Fig. 7(b)), to reach room G InPReSS proposes a path crossing cells (12, 11, 6, 5, 15, 16, 17).
IV. PERFORMANCEEVALUATION
We implemented InPReSS as an Android application. Sen-sors values are collected through the SensorEvent native Android API with a1 s period. The application automatically sends the collected values to the InPReSS server (via Wi-Fi or cellular network, depending on availability). The server merges the data to compute: a) the floor plan of the building in user-friendly format; b) the two-layer navigation graph. A user can point to a particular destination on the map using the smartphone’s screen. This triggers a request sent to the InPReSS server, which computes the best path and forwards it to the user’s phone.
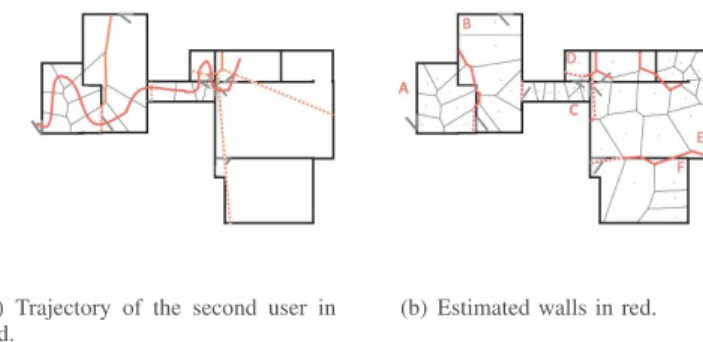
(a) Blueprint of the second test building.
(b) Trajectory of the user in red and the estimated walls in blue (dash blue for doors).
Figure 10. After one user trajectory, 5 rooms are correctly identified
The performance evaluation is divided into two parts: In the first part, we evaluate InPReSS’ capability to accurately identify rooms in a controlled experiment where we have seeds from every room in the building. In the second part, we evaluate InPReSS in a real-deployment kind of setting.
A. Part I: Controlled Experiment
We evaluate the performance of the room detection algo-rithm following the experimental setting described in § II-A. InPReSS is compared to k-means and hierarchical clustering. Figure 9 shows the final floor plans obtained with all three approaches for the building whose blueprint is shown in Fig. 8. Figure 9(a) and Fig. 9(b) have been computed using k-means with 𝑘 set to 13 and 12, respectively. As there are 12 rooms on the particular floor, these are the best-case values for 𝑘. Nevertheless, k-means fails to identify the correct number of rooms. This is due to the fact that the cells’ physical proximity is not taken into account. The same phenomenon is observed with hierarchical clustering in Fig. 9(c). The fact that the number of rooms is not required by this method improves the quality of the classification. However, there are still some errors. Figure 9(d) shows that InPReSS does not compute a colored map because there are no clusters created. It computes a real plan, based on the contours of the Voronoi cells. The only difference with the ground truth is the number of doors InPReSS identifies. As this an office space, some doors stay open all day, including while running the tests, leading InPReSS to think there is no door at all but just an opening. Note, however, that this is not a source of error for navigation – as long as the opening is real, whether a door is present or not, one can navigate without issues.
B. Part II: Real life setting experiment
Method: Unlike in the previous experiments where we had
80 seeds distributed across all the rooms of the floor, now we evaluate InPReSS in conditions similar to what one would expect in real-life usage. We give a volunteer an LG Google Nexus 5 phone and ask her to follow a particular trajectory in the building, as shown in Fig. 10(a). InPReSS, running on the volunteer’s phone, estimates the floor plan in real time. Once the first volunteer has reached her destination, a second user is asked to follow a second trajectory. InPReSS creates a new estimation of the floor plan.
(a) Trajectory of the second user in red.
(b) Estimated walls in red.
Figure 11. After the second trajectory, InPReSS has correctly identified all indoor walls but one.
Results: The first user follows the trajectory shown in
Fig. 10(b). The rooms the user visited are correctly identi-fied by InPReSS, including the 3 doors she went through. Nevertheless, there still remain “hidden” rooms. The second user follows another trajectory, shown in Fig. 11(a), using her own smartphone, a Samsung Galaxy S5. Note that the sensor readings from the two different users are not merged by InPReSS. The points collected by the two users do not necessarily match – the time of day may have changed, the sensor hardware may be different, etc. Thus, InPReSS analyzes the two trajectories separately and then merges the two floor plans by superposition. Figure 11(b) shows that after the second user trajectory, InPReSS has identified the floor plan with remarkable accuracy.
V. RELATED WORK
Most research on indoor floor plan construction is based on the SLAM (Simultaneous Localization And Mapping), a classical problem in robotics area [11]. [20], [15] propose to use intensive image processing to reconstruct the indoor floor plan. Even if this technique provides higher quality floor plans, it requires high-quality images from the smartphones, difficult to obtain without asking active participation from the user. Wi-Fi has been proposed to overcome this limitation since it is available in almost every building and most indoor localization solutions use it. Although WiFi-SLAM [7], graphSLAM [9] and [10] can construct indoor floor plans, the Wi-Fi alone is too unstable to work standalone without recalibration or fingerprinting. [21] proposes to use motion sensors with a dead-reckoning approach, however, the approach is severely limited by the high errors of the low-end accelerometers found on smartphones. To avoid recalibration due to the high accumulation of errors, iFrame [8] combines dead-reckoning with Wi-Fi and Bluetooth RSS analysis. Despite a significant improvement in the accuracy of the floor plan construction, iFrame, however, requires enabling Wi-Fi Direct, limiting the utilization of the smartphone by the user.
InPReSS decouples the simultaneous localization and map-ping (SLAM) problem, focusing on the latter. Ambience sensors are used to collect data from previous user trajectories in the building to estimate the indoor floor plan for future users.
VI. CONCLUSIONS
We presented InPReSS, a light-weight, smartphone-based solution for dynamic indoor plan construction. It leverages the advanced hardware of modern smartphones and their ubiquity to construct floor plans on the fly as users go about their daily business. Its key contribution is a novel approach for identifying rooms by combining readings from five different sensors. We developed InPReSS on the Android OS and through experiments in two different building showed that it can build highly accurate floor plans with minimum user input and negligible impact on battery life.
REFERENCES
[1] S. Kumar, S. Gil, D. Katabi, and D. Rus, “Accurate indoor localization with zero start-up cost,” in ACM MobiCom, 2014.
[2] H. Liu, Y. Gan, J. Yang, S. Sidhom, Y. Wang, Y. Chen, and F. Ye, “Push the limit of wifi based localization for smartphones,” in ACM MobiCom, 2012.
[3] K. Chintalapudi, A. Padmanabha Iyer, and V. N. Padmanabhan, “Indoor localization without the pain,” in ACM MobiCom, 2010.
[4] “Google maps,” https://www.google.fr/maps/, accessed: 2016-10-10. [5] “Yahoo maps,” https://maps.yahoo.com/, accessed: 2016-10-10. [6] “Google indoor floor plans,” https://support.google.com/maps/answer/
1685827, accessed: 2016-10-10.
[7] B. Ferris, D. Fox, and N. D. Lawrence, “Wifi-slam using gaussian process latent variable models,” in IJCAI, vol. 7, no. 1, 2007, pp. 2480– 2485.
[8] C. Qiu and M. W. Mutka, “iframe: Dynamic indoor map construction through automatic mobile sensing,” in IEEE Pervasive Computing and
Communications (PerCom), 2016.
[9] J. Huang, D. Millman, M. Quigley, D. Stavens, S. Thrun, and A. Ag-garwal, “Efficient, generalized indoor wifi graphslam,” in Robotics and
Automation (ICRA). IEEE, 2011, pp. 1038–1043.
[10] C. Wu, Z. Yang, and Y. Liu, “Smartphones based crowdsourcing for indoor localization,” IEEE Transactions on Mobile Computing, vol. 14, no. 2, pp. 444–457, 2015.
[11] H. Durrant-Whyte and T. Bailey, “Simultaneous localization and map-ping: part i,” IEEE robotics & automation magazine, vol. 13, no. 2, pp. 99–110, 2006.
[12] F. Li, C. Zhao, G. Ding, J. Gong, C. Liu, and F. Zhao, “A reliable and accurate indoor localization method using phone inertial sensors,” in Proceedings of the 2012 ACM Conference on Ubiquitous Computing, ser. UbiComp ’12. ACM, 2012, pp. 421–430.
[13] M. Montemerlo, S. Thrun, D. Koller, and B. Wegbreit, “FastSLAM: A factored solution to the simultaneous localization and mapping problem,” in Proceedings of the AAAI National Conference on Artificial
Intelli-gence. Edmonton, Canada: AAAI, 2002.
[14] F. Adib and D. Katabi, See through walls with wifi! ACM, 2013, vol. 43, no. 4.
[15] R. Gao, M. Zhao, T. Ye, F. Ye, Y. Wang, K. Bian, T. Wang, and X. Li, “Jigsaw: Indoor floor plan reconstruction via mobile crowdsensing,” in
Proceedings of the 20th annual international conference on Mobile computing and networking. ACM, 2014, pp. 249–260.
[16] D. Reem, “An algorithm for computing voronoi diagrams of general generators in general normed spaces,” in Voronoi Diagrams, 2009. ISVD
’09. Sixth International Symposium on, 2009, pp. 144–152.
[17] J. A. Hartigan and M. A. Wong, “Algorithm as 136: A k-means clustering algorithm,” vol. 28, pp. 100–108, 1979.
[18] G. J. Szekely and M. L. Rizzo, “Hierarchical clustering via joint between-within distances: Extending ward’s minimum variance method,” Journal
of Classification, vol. 22, no. 2, pp. 151–183, 2005.
[19] A. P. Dempster, N. M. Laird, and D. B. Rubin, “Maximum likelihood from incomplete data via the em algorithm,” JOURNAL OF THE ROYAL
STATISTICAL SOCIETY, SERIES B, vol. 39, no. 1, pp. 1–38, 1977. [20] Y. Tian, R. Gao, K. Bian, F. Ye, T. Wang, Y. Wang, and X. Li, “Towards
ubiquitous indoor localization service leveraging environmental physical features,” in IEEE INFOCOM, 2014.
[21] M. Alzantot and M. Youssef, “Crowdinside: Automatic construction of indoor floorplans,” CoRR, 2012.