Publisher’s version / Version de l'éditeur:
Technical Note (National Research Council of Canada. Division of Building
Research), 1967-02-01
READ THESE TERMS AND CONDITIONS CAREFULLY BEFORE USING THIS WEBSITE.
https://nrc-publications.canada.ca/eng/copyright
Vous avez des questions? Nous pouvons vous aider. Pour communiquer directement avec un auteur, consultez la première page de la revue dans laquelle son article a été publié afin de trouver ses coordonnées. Si vous n’arrivez pas à les repérer, communiquez avec nous à [email protected].
Questions? Contact the NRC Publications Archive team at
[email protected]. If you wish to email the authors directly, please see the first page of the publication for their contact information.
NRC Publications Archive
Archives des publications du CNRC
For the publisher’s version, please access the DOI link below./ Pour consulter la version de l’éditeur, utilisez le lien DOI ci-dessous.
https://doi.org/10.4224/20358952
Access and use of this website and the material on it are subject to the Terms and Conditions set forth at
Icing Observations, 1965-1966: Second Progress Report
Boyd, D. W.
https://publications-cnrc.canada.ca/fra/droits
L’accès à ce site Web et l’utilisation de son contenu sont assujettis aux conditions présentées dans le site LISEZ CES CONDITIONS ATTENTIVEMENT AVANT D’UTILISER CE SITE WEB.
NRC Publications Record / Notice d'Archives des publications de CNRC:
https://nrc-publications.canada.ca/eng/view/object/?id=dc6de2ca-9328-4c18-ab7b-760c22d2f7bf https://publications-cnrc.canada.ca/fra/voir/objet/?id=dc6de2ca-9328-4c18-ab7b-760c22d2f7bfDIVISION OF BUILDING RESEARCH
479
NOTlE
'f
EClHl
N
IlCAL
PREPARED BY D. W. Boyd CHECKED BY L.W.G. APPROVED BY
R. F. L.
February
1967
PREPARED FOR Inquiry and Record
SUBJECT ICING OBSERVATIONS,
1965-1966
SECOND PROGRESS REPORT
The weight of ice or snow that may accumulate on towers or wires is one of the loads that is usually considered in the design of aerials, communication lines, and power transmission lines. There seems, however, to be very little information available on the actual thickness or weight of ice that may accumulate on wires or structures in various parts of Canada.
In
1964
the Subcommittee on General Requirements of the Canadian Standards Association Committee on Aerial Joint Use of Poles and the Division of Building Research co-operated in drawing up and distributing over 1800 "Icing Report Forms" which were to be filled in and returned if icing conditions were sufficiently serious to damage any equipment. Many forms were returned and a progress report on the first winter was prepared(l).This report included a brief outline of the reasons for
adopting this method of collecting icing information and a tabulation of information abstracted from the Icing Reports. A map of Canada showing the mean annual number of hours with freezing drizzle and freezing rain was reproduced in the Note on the assumption that there should be SOme correlation between ice thickness and hours of freezing precipitation.
- 2
ICING REPORTS
During the winter of 1965 -66 a total of 74 reports was
received. These included a number of "Tbwer Failure Reports"
made available by the Radio Regulations Division of the Federal Department of Tr ansport and a few other s that wer e not on the Icing Report form.
As in the previous winter there were sOme forms that reported "no icing" or "failur e caused by wind." Nine such
reports have been filed without abstracting. The information
contained in the remaining 65 reports has been summarized and is pr esented in tables in this report.
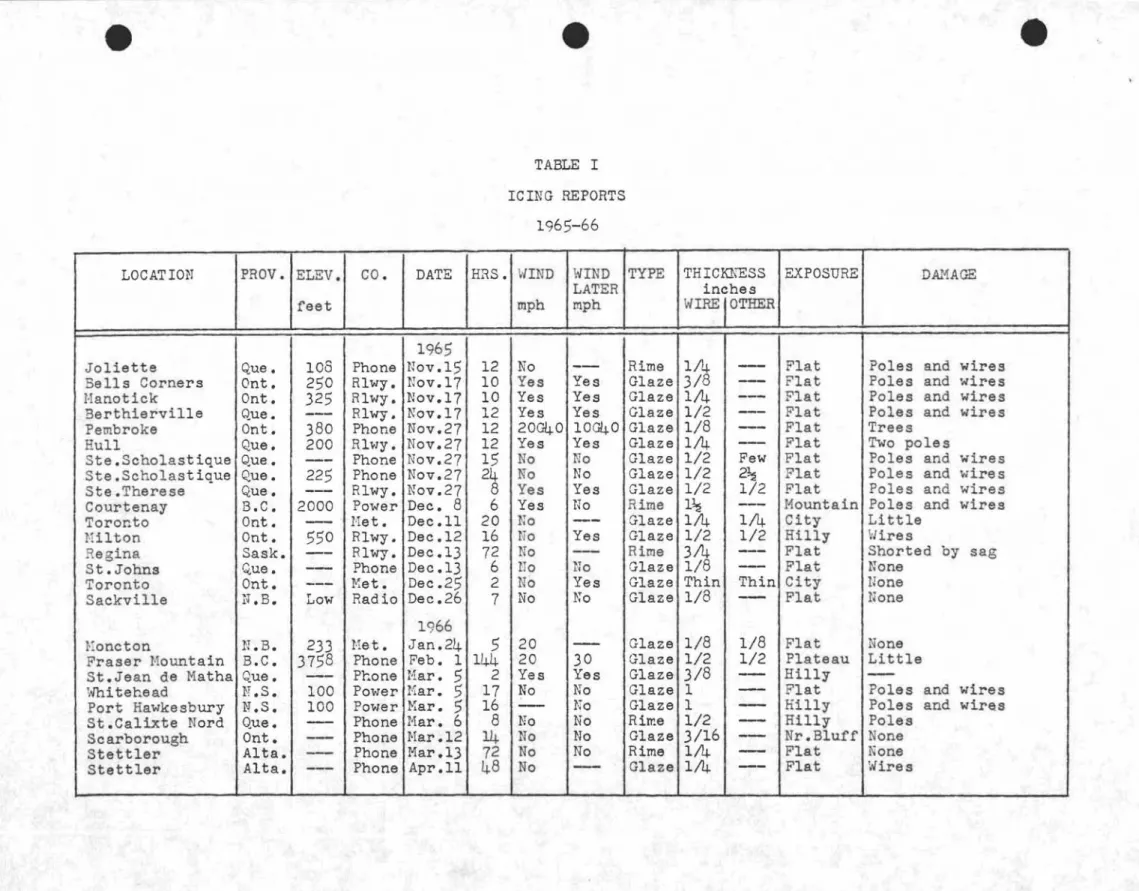
Table I is an abstract of the 25 reports of glaze or rime
lcmg during the past winter. Table I I is an abstract of the 16
cases of snow or frost that were reported. No reports of snow
or frost were tabulated in the first progress report because
none reported any damage. This year, however, almost half
of the snow and frost reports included SOme report of damage; the other s were abstracted for comparison.
Table II I consists of 24 reports of icing in earlier winters.
The condensation of 65 reports into 3 tables has necessitated sOme averaging and interpr etation, but the original reports are
on file if more details are required. SOme of the COmments in
the reports have been abbreviated to one or a few words to keep
the tables as short as possible. These abbreviations are expanded
or explained in the following paragraphs.
The location in the fir st column is usually the near est populated place but in a few cases it is only one of several places affected by an icing storm.
The elevation in feet above sea level is only approximate in most cases and in a few cases is an average for a considerable range of elevations.
The author of each icing report is identified only by the main business of his company.
The date is the day on which the ice began to form.
If the year only is given it means the winter ending in that year. The approximate duration in hour s is tabulated in the next column.
The wind speed can seldom be measured at the location where the icing is observed but same indication of wind speed
is given by the answers to the questions: "Was there a strong wind
during the icing storm? following the storm?" "Yes" in a wind column indicates strong winds; a number indicates a wind speed in miles per hour; a number following the letter "Gil. indicates the speed of peak gusts.
The type of ice is indicated in the next column. Glaze ice
is generally clear and dense. Rime is milky and granular and
may occasionally be almost as dense as glaze. Hoar, or fr ost,
is feathery and generally quite light. The snow in Tables I I and
I I I was usually described as wet and in same cases froze to the
wires. Sand ZR means a mixture of snow and freezing rain.
The exact meaning of sleet in Table I I I is not clear.
When two values for the thickness of the ice were given in the original report, only the lar ger has been tabulated.
In many cases the exposure was described quite completely in the reports and the single words used here are intended only as a general indication of the type of terrain.
Poles and wir es in the last column indicate that many of these were damaged; towers, however, indicate two or thr ee
antenna towers. Falling tree limbs or falling ice when melting
begins often cause more damage than the ice load on the wires or towers.
DISCUSSION
The reports abstracted in Table I indicate that the 1965 -66
season was somewhat less severe than the previous winter. Two
of the storms in the first progress report were described as the
worst in many years. The storm in Nova Scotia that continued
from about 28 December 1964, until 5 January 1965, is reported
again in this note in Table I I1. Inverness County in Cape Breton
and Antigonish County on the mainland seem to have suffered the
most. Ice 2 inches thick on wires and 10 inches on towers was
reported. The May storm in Alberta also covered a considerable
area. Thicknesses of 1 inch on wires and 6 inches on the windward
sides of poles were reported from Sedgewick.
The war st icing in Table I this year is
Ii
inches of rimenear Courtenay, B.
c.,
and two reports of 1 inch of glaze near'the Straits of Canso, N. S. The number of reports of glaze and
- 4
The reports of frost and snow tabulated in Table 1,1 are interesting because these types of storms caused no reported
damage in the previous winter. Wet snow occasionally accumulates
on wires in most parts of Canada, but it is believed that this snow usually falls off before the weight becomes sufficient to cause
damage. In British Columbia it seems that wet snow with very
light winds is mor e common and mor e damaging. The snow and
fr eezing rain reported from Alberni and Bella Coola in Table I II may be the same phenomena described in different words.
Two reports of hoarfrost
Ii
to 2 inches thick breakingcommunication lines seem rather surprising. Deloraine, Manitoba,
and North Portal, Saskatchewan, are about a hundred miles apart; both reported damage by hoarfrost on 11 December.
The earlier reports from British Columbia in Table II I are generally the most severe storms in the me'mory of the
observers. Some of the DOT tower failure reports also
represent the most severe storm in many years. The severity
of the icing in Nova Scotia and Newfoundland early in 1965 is confirmed by several reports of ice 10 to 15 inches thick on towers.
To illustrate the geographical distribution of the reports
of icing on wires a map has been prepared (Figure 1). This is
based on reports for the two winters 1964-65 and 1965 -66.
Icing on structur es other than wires has not been used. Snow
and hoarfrost have been excluded because their thicknesses are
much greater for the same load. Thicknesses of 1/8 inch or less
were considered negligible. Table I in DBR Tech. Note No. 459
(1) provided 14 reports of mor ethan 1/8 inch of ice in the winter of 1964-65 and 3 more for the same winter were taken from
Table II I in this note. For the winter of 1965 -66 ther ewer e
20 reports from Table I of this note.
These 37 reports have been plotted on the map (Figure 1)
using symbols to indicate the approximate thickness of ice. Two winter's reports cannot be expected to delineate areas of different icing severity but it is tempting to point out sOme similarities between this map and the map of mean annual number of hour s with 'fr eezing pr ecipitation published in
Tech. Note No. 459 in 1965. The Cape Breton - Antigonish
storm affected mainly the ar ea within the 60 -hour s -per -year isopleth on the freezing precipitation map but this may have
Newfoundland reported no wire damage in these two winters, but the tower failur es early in 1965 indicate that severe icing occurred in this area.
The large number of reports from the Hamilton, Ontario, to Joliette, Quebec, area may be due to the population density in this region, but it also fits nicely with the over 40 -hour s -per-year region on the freezing precipitation map. The reports from British Columbia do not correspond with any area of frequent fr eezing pr ecipitation. Perhaps the wet snow near the west coast will have to be treated separately. On the other hand it may be that these winters were exceptional, and future years will change the pattern on this map.
The conclusion is the same as it was a year ago. Only a small percentage of the occurrences of freezing precipitation cause damage to power or communication lines 'but not all the damaging storm s ar e being reported to us. The reliability of any map based on icing reports will depend almost entirely on how well the country is covered by conscientious observers.
We are grateful to all those who have assisted with this project in the last two winters, and we hope that more will join us in the winter s to COme.
REFERENCE
1. Boyd, D. W. Icing Observations 1964-65 - First Progress Report. National Research Council. Division of Building Research, Tech. Note No. 459, September 1965.
e
e
TABLE I IC ING REPORTS
1965-66
e
LOCATION PROV. ELEV. CO. DATE HRS. HIND WIND
TYPE
THICKNESS EXPOSURE DAMAGELATER inches
feet mph mph WIRE
I
OTHER1965
Joliette Que. 108 Phone Nov.1S 12 No
--
Rime 1/4--
Flat Poles and wiresBe 11 sCorners Onto 250 Rlwy. Nov.17 10 Yes Yes Glaze 3/8
--
Flat Poles and wires Hanotick ant. 32S Rlwy. Nov.17 10 Yes Yes Glaze 1/4---
Flat Poles and wires Berthierville Que.---
Rlwy. Nov.17 12 Yes Yes Glaze 1/2---
Flat Poles and wires Pembroke ant. 380 Phone Nov.27 12 20G40 10G40 Glaze 1/8--
Flat TreesHull Que. 200 Rlwy. Nov.27 12 Yes Yes Glaze 1/4
--
Flat Two polesSte.Scholastique 'lue.
--
Phone Nov.27 lS No No Glaze 1/2 Few Flat Poles and wires Ste.Scholastique Que. 225 Phone Nov.27 24 No No Glaze 1/2 Rセ Flat Poles and wires Ste.Therese Que.---
Rlwy. Nov.27 8 Yes Yes Glaze 1/2 1/2 Flat Pole s and wires Courtenay B.C. 2000 Power Dec. 8 6 Yes No Rime ャセ---
Mountain Poles and wiresToronto ant.
-
Het. Dec .11 20 No--
Glaze 1/4 1/4 City LittleI·tilton ant. 550 Rlwy. Dec.12 16 No Yes Glaze 1/2 1/2 Hilly 1:Jires
Regina Sask.
--
Rlwy. Dec.13 72 No-
Rime 3/4--
Flat Shorted by sagSt.Johns Que.
-
Phone Dec.13 6 no No Glaze 1/8-
Flat NoneToronto Onto
---
Met. Dec.25 2 No Yes Glaze Thin Thin City UoneSackville N.B. Low Radio Dec.26 7 No
No
Glaze 1/8-
Flat None1966
I':oncton N.B. 233 Het. Jan.24 5 20
-
Glaze 1/8 1/8 Flat NoneFraser Hountain B.C. 3758 Phone Feb. 1 144 20 30 Glaze 1/2 1/2 Plateau Little St.Jean de Matha Que.
--
Phone Har. 5 2 Yes Yes Glaze 3/8--
Hilly-Whitehead }T •S. 100 Power !1ar. 5 17 No No Glaze 1
-
Flat Poles and wiresPort HaWkesbury N.S. 100 Power Mar. 5 16
-
No Glaze 1-
nilly Poles and wiresSt .Calixte Nord Que.
-
Phone Mar. 6 8 No No Rime 1/2-
Rilly PolesScarborough ant.
--
Phone Nar.1214
No No Glaze 3/16-
Nr.Blufr NoneStettler Alta.
--
Phone Mar.l) 72 No No Rime 1/4-
Flat Nonee
e
TABLE II
FROST AND SNOW REPORTS 1965-66
LOCATION ,PROV. ELEV. CO. DATE fiRS. WINU ゥMAiセd TYPE THICIiliESS EXPOSURE DAMAGE
LATER inches
feet mph mph WIREIOTHER
1965
Thompson Htn. B.C. 6500 Phone Nov.29
-
Yes--
Hoar 1 1 Hilly NoneTerrace B.C. 700 Power Dec. 3 11 G15 No Snow 2
--
Benches ',viresイセッイエィ Portal Sask.
--
Rlwy. Dec.ll 10 No No Hoar ャセ--
Flat tiiresDeloraine Man.
--
Phone Dec .11 72 No No Hoar 2-
Flat HiresStettler Alta.
-
Phone Dec.14
48 No No Hoar 1/2---
Flat NoneCampbell River B.C. Low Phone Dec.24
24
15 No Snow Rセ--
Flat ''''iresSutton Pass B.C. 800 Power Dec.27 4 Ko No Snow 5
--
Mountain Shorting1966
Stettler Alta.
--
Phone Jan. 1 72 No No Hoar 1\--
Flat NoneSunset Beach B.C. 400 Power Jan. 4
--
No No Snow 2--
Hilly, Shorted by sagLake Cowicban B.C. 800 Power Jan. 9 10 No No Snow 2
--
Hilly Shorted by sag\'letaskiwin Alta. 2497 Phone Feb. 1
---
No No Hoar 1--
Flat NoneStettler Alta.
---
Phone Feb. 8 13 No No Hoar1/4
---
Flat NonePrince George B.C.
-
Power Few-- ---
-
Snow--
--
--
NoneStewart B.C.
--
Power Once--
Ro-
Snow 2---
--
Nonee
e
TABLE III
REPORTS FROM EARLIER WINTERS
e
LOCATION PROV. ELEV. CO. YEAR DATE HRS. IvIND TYPE THICKNESS EXPOSURE DAHAGE inches
feet mph WIRE OTHER
Langley B.C.
--
Power 1935 Jan.21 6 No Glaze Rセ---
Flat Poles&
wiresNatsqui R.C.
-
Power 1949--
3 No Glaze 1/2--
Flat セャゥイ・ウLittle Current Onto 975 DOT 1954 :·far. 1
--
HW29 S&ZR-
ャセ Hilly TowerCaledonia :1tn. N.B. 1300 DOT 1956 Jan. セMャGォ No Glaze
--
5 Hilly TowerSt. John's Nfld.
--
Met. 1958 Feb.2746
---
Glaze 1 1\---
Poles&
wiresVanderhoof B.C.
--
Power 1959 Dec. 48 No Sleet Rセ--
Sheltered NoneFort St. John B.C. 2200 Power 1960 May 23 48 40 Snow 1 3/4
-
Flat Poles&
wiresSt. Constant Que. 100 DOT 1961 Feb.25
---
enO
Glaze-
2 nat Towers100 Hile House B.C. 3180 Power 1961 Fall 12 No Rime 1/8
--
Rolling Shorted by sagFort Celson B.C. 1300 Net. 1962 Jan.ll
14
No Snow 1/2--
Sheltered };oneSt. La"rence Nfld. 96 DOT 1962 Feb.
--
SE40 Glaze---
3/l4--
AntennaClinton B.C.
--
Power 1962-
---
--
Snow 3---
--
-Terrace B.C. 300 Power 1963 Dec.2l 24 No Rime 2
--
Hilly ':liresEcum Secum N.S. 100 DOT 1964 I'1ar.27
---
Yes Glaze---
3 Hilly AntennaAlberni B.C. 1000 Pm.Ter 1964 Dec.1S
24
No S&ZR 3--
l"Iountain NoneSandspit B. C. 60 Power 1964 Dec.26 3 nH60 Glaze 1/2
--
Varied NoneBella Coola B.C. 50 Power 1964 Dec .31 18 5 3&ZR ャセ
-
Sheltered NoneAntigonish N.S. 1020 DOT 1965 Jan. 3
-
No Glaze-
10 Hilly TowerBrown's !-Itn. N.S.
--
News 1965 Jan. 5---
040 Glaze---
10 Hilly To'.er bentLascie Nfld. 330 DOT 1965 Jan. 6
--
\.J40 Glaze--
15 Flat TowerPort aux Basques Nfld. 185 DOT 1965 Feb.
-
50 Glaze---
1 Hilly TowersCook's Harbour Nfld. 450 DOT 1965 11ar. 5
---
G10S Glaze---
12 Hilly TowersNakusp B.C.
--
Power 30me--
Few No Snow 3-
---
イセッョ・Torbay Nfld. 525 DOT *1964 Feb.
--
G75 Glaze-
12 Flat Towere
Modified Equal Area Proieciion
FIGURE Ice on Wires