HAL Id: inserm-01616494
https://www.hal.inserm.fr/inserm-01616494
Submitted on 13 Oct 2017HAL is a multi-disciplinary open access archive for the deposit and dissemination of sci-entific research documents, whether they are pub-lished or not. The documents may come from teaching and research institutions in France or abroad, or from public or private research centers.
L’archive ouverte pluridisciplinaire HAL, est destinée au dépôt et à la diffusion de documents scientifiques de niveau recherche, publiés ou non, émanant des établissements d’enseignement et de recherche français ou étrangers, des laboratoires publics ou privés.
A novel role for cilia function in atopy: ADGRV1 and
DNAH5 interactions
Pierre-Emmanuel Sugier, Myriam Brossard, Chloé Sarnowski, Amaury
Vaysse, Andréanne Morin, Lucile Pain, Patricia Margaritte-Jeannin,
Marie-Hélène Dizier, William Cookson, Mark Lathrop, et al.
To cite this version:
Pierre-Emmanuel Sugier, Myriam Brossard, Chloé Sarnowski, Amaury Vaysse, Andréanne Morin, et al.. A novel role for cilia function in atopy: ADGRV1 and DNAH5 interactions. Journal of Allergy and Clinical Immunology, Elsevier, In press, Epub ahead of print. �10.1016/j.jaci.2017.06.050�. �inserm-01616494�
A novel role for cilia function in atopy: ADGRV1 and DNAH5 interactions
1 2
Pierre-Emmanuel Sugiera,b, MSc, Myriam Brossarda*, PhD, Chloé Sarnowskia*, PhD, Amaury 3
Vayssea, PhD, Andréanne Morinc,d, MSc, Lucile Paind, MSc, Patricia Margaritte-Jeannina, PhD, 4
Marie-Hélène Diziera, PhD, William O.C.M. Cookson, MD, D.Phile., Mark Lathropc, PhD, Miriam 5
F. Moffatt, D.Phil.e, Catherine Laprised‡, PhD, Florence Demenaisa‡, MD, Emmanuelle 6
Bouzigona‡, MD, PhD 7
8
*These authors shared second authorship. 9
‡These authors shared senior authorship. 10
aGenetic Variation and Human Diseases Unit, INSERM, Université Paris Diderot, Université 11
Sorbonne Paris Cité, Paris, France 12
bUniversité Pierre et Marie Curie, Paris, France 13
cMcGill University and Génome Québec Innovation Centre, Montréal, Canada 14
dDépartement des Sciences Fondamentales, Université du Québec à Chicoutimi, Chicoutimi, QC, 15
Canada 16
eSection of Genomic Medicine, National Heart and Lung Institute, London, UK 17
Correspondance:
18
Florence Demenais, MD 19
UMR-946, INSERM, Université Paris-Diderot 20
27 rue Juliette Dodu 21
75010 Paris 22
Fax: 33 (0) 1 53 72 50 49 24
Email: [email protected] 25
Disclosure of potential conflict of interest: all authors declare no conflict of interest
26 27
Sources of support: This work was supported by the French National Agency for Research
(ANR-28
11-BSV1-027-GWIS-AM; ANR-USPC-2013-EDAGWAS) and Université Pierre et Marie Curie 29
doctoral fellowship, The Canada Research Chair held by C Laprise and the funding supports from 30
Canadian Institutes of Health Research (CIHR) enabled the maintenance and continuation of the 31
SLSJ asthma study. C. Laprise is the director of the Asthma Strategic Group of the Respiratory 32
Health Network of the Fonds de la recherche en santé du Québec (FRSQ) and member of Allergen 33
network. Genotyping was supported by grants from the European Commission (No. LSHB-CT-34 2006-018996-GABRIEL). 35 36 Manuscript count: 3809 37 Abstract count: 248 38 39
ABSTRACT
40
Background: Atopy, an endotype underlying allergic diseases, has a substantial genetic
41
component. 42
Objective: Our goal was to identify novel genes associated with atopy in asthma-ascertained
43
families. 44
Methods: We implemented a three-step analysis strategy in three datasets: The Epidemiological
45
study on the Genetics and Environment of Asthma (EGEA) dataset: 1,660 subjects; The Saguenay-46
Lac-Saint-Jean (SLSJ) dataset: 1,138 subjects; and The Medical Research Council (MRC) dataset: 47
446 subjects). This strategy included a single-SNP genome-wide association study (GWAS), the 48
selection of related gene pairs based on statistical filtering of GWAS results and text-mining 49
filtering using GRAIL and SNP-SNP interaction analysis of selected gene pairs. 50
Results: We identified the 5q14 locus, harboring the adhesion G protein-coupled receptor V1
51
(ADGRV1) gene, that showed genome-wide significant association with atopy (rs4916831; 52
Pmeta=6.8x10⁻⁹). Statistical filtering of GWAS results followed by text-mining filtering revealed 53
relationships between ADGRV1 and three genes showing suggestive association with atopy (P≤10 -54
4). SNP-SNP interaction analysis between ADGRV1 and these three genes showed significant 55
interaction between ADGRV1 rs17554723 and two correlated SNPs (rs2134256 and rs1354187) 56
within dynein axonemal heavy chain 5 (DNAH5) gene (Pmeta-int=3.6x10⁻⁵ and 6.1x10⁻⁵, that met the 57
multiple-testing corrected threshold of 7.3x10⁻⁵). Further conditional analysis indicated that 58
rs2134256 alone accounted for the interaction signal with rs17554723. 59
Conclusion: As both DNAH5 and ADGRV1 contribute to function of cilia, this study suggests that
60
cilia dysfunction may represent a novel mechanism underlying atopy. Combining GWAS and 61
epistasis analysis driven by statistical and knowledge-based evidence represents a promising 62
Key Messages:
64
• ADGRV1 genetic variants are associated with atopy in asthma families 65
• Interaction between ADGRV1 and DNAH5 variants is associated with atopy; these two 66
genes are involved in ciliary function 67
• Use of a strategy that combines genome-wide association analysis and epistasis analysis 68
driven by statistical and knowledge-based evidence can successfully identify new genes 69
underlying complex traits. 70
Capsule summary:
71
This study in three family-based studies identified association between ADGRV1 and atopy and 72
interaction between ADGRV1 and DNAH5, two genes that contribute to ciliary functions. 73
Key words: atopy, asthma, genetics, genome-wide association study, gene-gene interaction,
text-74
mining, ADGRV1, DNAH5, ciliary function 75
Abbreviations:
76
ADGRV1: adhesion G protein-coupled receptor V1
77
DNAH5: dynein, axonemal, heavy chain 5
78
SNP: single nucleotide polymorphism 79
GWAS: genome-wide association study 80
SPT: skin prick test 81
EGEA: Epidemiological study on the Genetics and Environment of Asthma 82
SLSJ: Saguenay-Lac-Saint-Jean study 83
MRCA: Medical Research Council funded collection of nuclear families with Asthma 84
MRCE: Medical Research Council funded collection of nuclear families with Eczema 85
GRAIL: Gene Relationships Across Implicated Loci 86
QC: quality control 87
MAF: minor allele frequency 88 PCs: principal components 89 LD: linkage disequilibrium 90 ORs: odds-ratios 91
GTEx: Genotype-Tissue Expression 92
ETS: environmental tobacco smoke 93
CI: confidence interval 94
INTRODUCTION
96
Allergies and asthma are among the most common diseases in industrialized countries. Although 97
environmental factors play an important role in allergic diseases, estimates of heritability of allergy, 98
which range between 25% and 80%, suggest significant genetic contribution.1 Genome-wide 99
association studies (GWAS) have identified a number of loci associated with allergic diseases (i.e., 100
asthma, atopic dermatitis, rhinitis),2,3 but these loci only explain a small part of the genetic risk. 101
Part of the difficulty encountered in identifying the genetic factors involved in these allergic 102
diseases is due to the heterogeneity of these diseases and the uncertainty of diagnosis. However, 103
this problem can be alleviated by the study of an endotype underlying allergic diseases, such as 104
allergic sensitization or atopy. 105
Atopy is characterized by the production of allergen-specific immunoglobulin E against 106
environmental allergens. Estimates of heritability of atopy range from 40% to 85%.4,5 Many 107
candidate genetic studies of atopy have been conducted but have often led to inconsistent results.6 108
While the first GWAS of allergic sensitization only reported a few loci,7-10 two recent large-scale 109
meta-analyses of allergic sensitization11 and self-reported allergy12 increased the number of 110
associated loci to 10 and 16 loci, respectively. However, other loci may influence atopy as it is well 111
known that GWAS alone cannot reveal the whole genetic landscape underlying complex 112
phenotypes. 113
Heterogeneity across studies, which may be caused by variability in the genetic background of the 114
populations, environmental exposures, or study design, may be a limitation of meta-analyses of 115
GWAS for identifying new loci associated with a trait. Notably, the importance of data sampling 116
was recently highlighted by a positional cloning study of eczema, where association with 117
ANO3/MUC15 genetic variants was only found in family samples ascertained through asthmatic
subjects but neither in families ascertained through eczema patients nor in a case/control study of 119
eczema.13 120
Another limitation of GWAS is that they typically focus on the analysis of individual single 121
nucleotide polymorphisms (SNPs) and are underpowered to detect genetic factors which have a 122
small marginal effect but rather interact with each other. Gene-gene interaction analysis (or 123
epistasis analysis) has the ability to reveal novel genes involved in complex traits but raises an 124
enormous multiple-testing problem when performed at the genome-wide level. Statistical and 125
biological filtering pipelines can be used to limit the search for SNP-SNP interactions.14 Following 126
the “guilt-by-association” assumption which states connected genes are usually participating in the 127
same or related cellular functions,15 search for interactions can be restricted to genes pointed out 128
by a preliminary GWAS (e.g., interactions of genes harboring significant association signals with 129
genes harboring suggestive associations) and showing relationships based on prior knowledge. One 130
knowledge-based approach that can be particularly useful to prioritize genes for epistasis analysis 131
is text-mining of the literature as it can highlight relationships between genes16 according to their 132
co-occurrence with the same words in scientific articles. 133
134
The objective of this study was to identify novel genetic factors influencing atopy by combining a 135
GWAS and epistasis analysis driven by statistical and knowledge-based evidence in three family 136
samples ascertained through asthmatic subjects: the French Epidemiological study on the Genetics 137
and Environment of Asthma (EGEA; 1,660 subjects), the French-Canadian Saguenay-Lac-Saint-138
Jean study (SLSJ; 1,138 subjects) and the Medical Research Council UK study (MRC; 446 139
subjects). Our overall analysis strategy included three main steps: (1) a genome-wide single-SNP 140
association analysis, (2) the selection of related gene pairs based on statistical filtering from GWAS 141
results and text-mining filtering using the Gene Relationships Across Implicated Loci (GRAIL) 142
approach,17 and (3) a SNP-SNP interaction analysis for the selected gene pairs. 143
144
MATERIALS AND METHODS
145
Study datasets and definition of atopy 146
The EGEA study combines a case-control and a family-based study of asthma. The whole study 147
population includes 388 families ascertained through at least one asthmatic proband recruited in 148
chest clinics (1,705 probands and first-degree relatives) plus 415 population-based controls (total 149
of 2,120 subjects). All subjects were born in France and were of European ancestry. The protocol 150
of this study has been described elsewhere.18-20 Atopy was assessed by skin prick tests (SPT) 151
performed in 1,978 subjects. A positive SPT response was defined as a wheal diameter ≥ 3mm to 152
at least one of 11 aeroallergens belonging to three groups (indoor allergens, outdoor allergens, 153
molds). After quality control (QC) of genotypic data, 925 atopic and 735 non-atopic subjects were 154
included in the analysis. 155
The Saguenay-Lac-Saint-Jean and Quebec City Familial Asthma Collection (SLSJ) consists of a 156
French-Canadian founder population panel of 253 multigenerational families from Saguenay-Lac-157
Saint-Jean region, ascertained through two asthmatic probands.21 This study has been described 158
elsewhere.21 Skin tests were done in 1,195 SLSJ subjects and atopy was defined similarly as in 159
EGEA. After QC of genotypic data, the analysis dataset included 641 atopic and 497 non-atopic 160
subjects. 161
The Medical Research Council (MRC) UK study includes 207 nuclear families, recruited through 162
at least one proband with childhood-onset asthma (MRCA sample). The study protocol has been 163
described elsewhere.22 Atopy was defined similarly as in EGEA. To increase the number of 164
unaffected subjects (controls), we included subjects from another MRC-UK dataset that were 165
recruited through probands with eczema (MRCE sample). Only subjects without asthma, without 166
eczema and with low IgE levels were used as controls in this study. We checked that the age and 167
gender distributions were similar in MRCA and MRCE samples. After QC of genotypic data, the 168
analysis sample included 106 atopic and 340 non-atopic subjects. The whole UK sample will be 169
subsequently designated as the MRC sample. 170
Protocols of EGEA, SLSJ and MRCstudies have been approved by the local ethical committees. 171
All adult participants and child’s legal guardians provided written informed consent. 172
173
Genotyping 174
Both EGEA and SLSJ datasets were genotyped using the Illumina 610-Quad array (Illumina, San 175
Diego, CA), as part as of the Gabriel asthma consortium GWAS.23 Stringent quality criteria were 176
applied to select both individuals and SNPs and have been previously detailed.23,24 After QC, there 177
was a final set of 501,167 autosomal SNPs for analysis. The offspring in MRCA families and 178
MRCE controls were genotyped using the Illumina Sentrix HumanHap300 BeadChip (307,981 179
autosomal SNPs), as part of the first asthma GWAS.22,23 QC for MRC samples has been detailed 180
elsewhere.22,25 In order to get a number of SNPs in MRC sample as large as in EGEA and SLSJ 181
samples, SNP imputation was performed using MACH v1.00 software26 and HapMap2 release 21 182
CEU haplotypes as referencepanel.Imputed SNPs were kept for analysis if their imputation quality 183
score (rsq)27was ≥ 0.5 and minor allele frequency was ≥ 5%. 184
185
Descriptive statistics and strategy of analysis 186
Descriptive statistics of atopy together with sex, age and asthma status were assessed in each 187
dataset using Stata® V14.1 (distributed by Stata Corporation, College Station, Texas, USA). The 188
workflow of our three-step analysis strategy is summarized in Figure 1 and presented in the 189
following paragraphs. 190
191
Genome-wide single-SNP analysis 192
We performed a two-stage GWAS. In the first stage, association analysis between individual SNPs 193
and atopy was carried out in the EGEA dataset. This analysis was based on a logistic regression 194
model assuming an additive model for SNP effect, using Stata® V14.1. This model was adjusted 195
for significant effects of age and sex and two principal components (PCs) to account for population 196
structure. We took into account familial dependencies using the cluster and robust options of the 197
logit function in Stata®. Test of SNP effect was based on a Wald-test. In a second stage, the SNPs 198
reaching P≤10-4 in EGEA were followed–up in SLSJ and MRC. The association analysis in SLSJ 199
and in MRC used the same model as in EGEA. The results of stage 2 datasets and, then, of the 200
three datasets were combined using a fixed-effects meta-analysis. SNPs were declared significantly 201
associated with atopy if the three datasets meta-analysis P-value (Pmeta) reached the genome-wide 202
significance level of 1.5x10⁻⁷. This threshold was obtained by dividing the type I error of 5% by 203
the effective number of independent SNPs in the Illumina 610-Quad array.28 204
205
Selection of gene pairs using both statistical and text-mining filters 206
The statistical filtering consisted of selecting two sets of genes using the GWAS results: genes 207
showing significant association with atopy (set-1) and genes showing suggestive association with 208
atopy (set-2). The set-1 included all genes lying at a distance of 50 kb or less from SNPs reaching 209
the genome-wide significance level in the GWAS meta-analysis. The set-2 included all genes that 210
were at most 50 kb apart from SNPs having P≤10-4 in the stage 1 EGEA dataset and were not part 211
of set-1. To assign SNPs to genes, we used NCBI dbSNP Build 137 and human Genome Build 212
37.3. We further filtered gene pairs (formed by crossing set-1 genes with set-2 genes) through 213
GRAIL17 text-mining of PubMed abstracts (available in October 2014). For each gene, GRAIL 214
builds a vector of words where the elements of this vector are weights that take values between 0 215
and 1 depending on how often a word is found with a gene in an abstract. Then, GRAIL computes 216
pairwise similarity between genes from gene/word vectors and ranks the similarities between each 217
gene from set-1 and all genes of the genome. The PGRAIL of a gene from 2 with a gene from set-218
1 is equal to the proportion of all genes that have similarity with the set-1 gene greater than the 219
similarity between set-2 and set-1 genes (i.e. rank divided by total number of genes across the 220
genome). We used the threshold of PGRAIL≤ 0.10, as recommended,17 to select related gene pairs 221
for further epistasis analysis. 222
223
SNP-SNP interaction analysis for selected gene pairs 224
As for the single-SNP association analysis, we performed a two-stage SNP-SNP interaction 225
analysis. At stage 1, we analyzed all SNP-SNP interactions for the GRAIL-selected gene pairs in 226
the EGEA dataset. For each gene, we considered all SNPs lying within gene boundaries. Pairwise 227
SNP-SNP interactions were evaluated by logistic regression assuming an additive model for SNP 228
main effects and interaction and adjusting for the same covariates (age, sex, PCs) as in the GWAS, 229
using Stata® V14.1. We used the same coding scheme as usually proposed for SNP-SNP 230
interaction modelling.29 We modeled the additive effect of a SNP by coding the genotypes of 231
homozygotes for the minor allele, heterozygotes and homozygotes for the major allele as 1, 0, and 232
-1; the interaction term between two SNPs was obtained by multiplication of these genotypic values 233
for the two SNPs. Test of interaction was based on a likelihood-ratio test which follows a Chi-234
of the nine genotypic combinations appeared in fewer than five subjects (cases or controls). In a 236
second stage, all SNP pairs showing suggestive evidence for interaction in EGEA (Pint≤5x10⁻³) 237
were followed-up in SLSJ and MRC. The results of the stage 2 datasets and, then, of the three 238
datasets were meta-analyzed using a fixed-effects model. 239
To correct for multiple testing, we computed, for each gene pair investigated, the effective number 240
of independent interaction tests from the eigenvalues of the correlation matrix of products of SNP 241
variables, using an extension of Li and Ji’s method.30 The corrected threshold to declare an 242
interaction statistically significant was equal to the 5% type I error divided by the sum of effective 243
number of independent interaction tests over all gene pairs tested. 244
245
Stratified analyses according to asthma status
246
Because family samples were ascertained through asthmatic probands, we investigated whether 247
SNP associations and SNP-SNP interactions detected with atopy might be related to the presence 248
of asthma. Single-SNP and SNP-SNP interaction analyses were repeated in the two groups of 249
asthmatic and non-asthmatic subjects separately. These analyses were performed for the SNPs that 250
showed significant results in the meta-analyses of the three datasets. Homogeneity of the odds-251
ratios (ORs) between the two groups was tested using the Cochran’s Q statistic.31 252 253 254 RESULTS 255 Descriptive statistics 256
A total of 1,660 EGEA, 1,138 SLSJ and 446 MRC subjects were included in this study. The 257
proportion of atopic subjects was similar in EGEA and SLSJ (55.7% and 56.3% respectively) but 258
was lower in MRC (23.8%; P≤10-3). In each study, there was a higher proportion of males in atopic 259
than in non-atopic subjects and atopic subjects were younger than non-atopic subjects (see Table 260
E1 in the Online Repository). As expected, the proportion of asthmatic subjects was higher in 261
atopic than in non-atopic subjects in all datasets (Table E1). In EGEA (respectively in SLSJ and 262
MRC), 78.0% (75.0% and 78.3%) of atopic subjects had positive SPT to indoor allergens, 55.5% 263
(77.5% and 52.8%) to outdoor allergens, and 34.8% (14.8% and 12.3%) to molds. 264
265
Genome-wide single-SNP analysis 266
In the stage 1 EGEA dataset, no SNP reached the genome-wide significance level of 1.5x10⁻⁷ (see 267
quantile-quantile (QQ) plot and Manhattan plot in Figures E1 and E2). However, 73 SNPs lying in 268
47 loci showed associations with atopy exceeding the screening threshold of P≤10-4. These SNPs 269
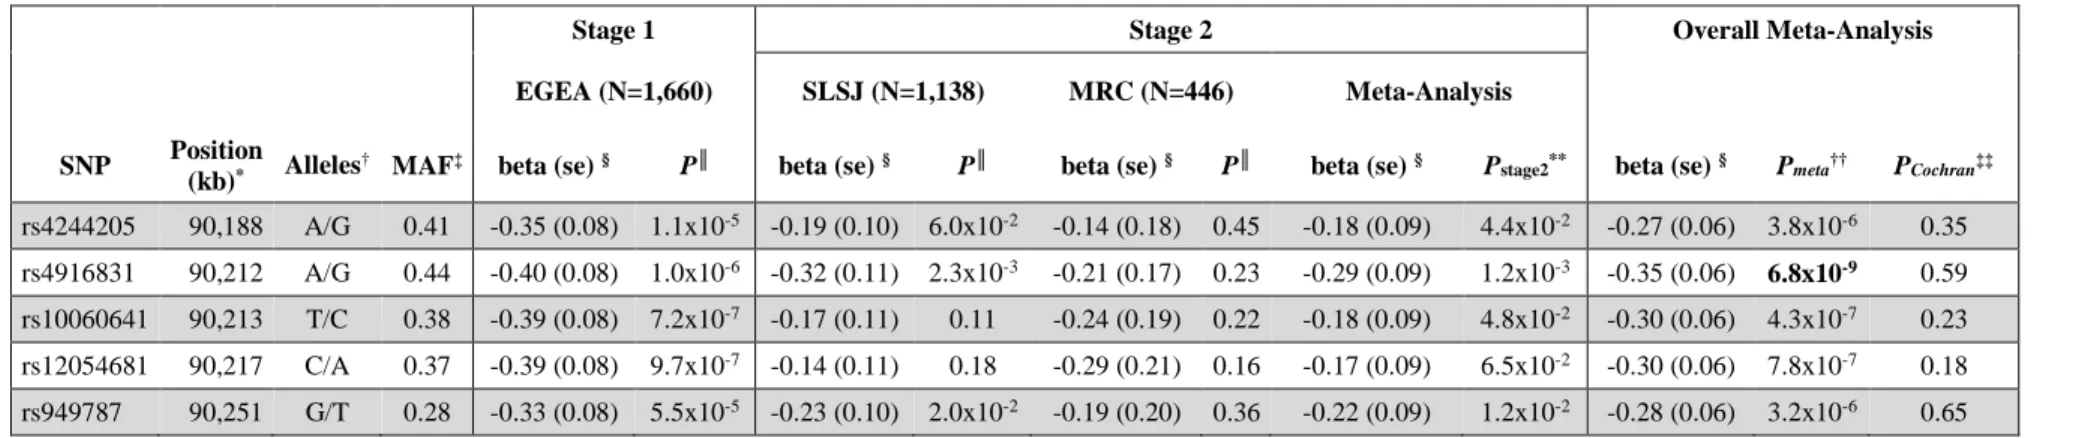
were followed-up in the stage 2 SLSJ and MRC datasets and meta-analyzed (Table E2). The SNP 270
rs4916831 within ADGRV1 gene at 5q14 reached the genome-wide significance level 271
(Pmeta=6.8x10⁻⁹) in the overall meta-analysis of the three datasets (Table I). Four other SNPs at that 272
locus, in moderate linkage disequilibrium (LD) with rs4916831 (r2 ranging between 0.51 and 0.79), 273
showed suggestive association (4.3x10⁻⁷≤Pmeta≤3.8x10⁻⁶; Table I). 274
275
Selection of gene pairs using both statistical and text-mining filters 276
The gene set-1 included ADGRV1, the only gene significantly associated with atopy. There were 277
30 genes that lied fewer than 50 kb apart from the 65 SNPs at 46 loci having P≤10-4 in EGEA (after 278
exclusion of ADGRV1 SNPs) and formed gene set-2 (Table E3). When GRAIL was applied to 30 279
gene pairs (date accessed: 04/24/2015), formed by each of these 30 genes with ADGRV1, three 280
genes were related with ADGRV1 at PGRAIL<0.10: DNAH5 on 5p15 (PGRAIL=0.084), CHD7 on 8q12 281
(PGRAIL=3.2x10⁻³) and ATP8B1 on 18q21 (PGRAIL=0.016). 282
SNP-SNP interaction analysis for selected gene pairs 284
In the stage 1 EGEA dataset, the three GRAIL-selected gene-pairs (ADGRV1/DNAH5, 285
ADGRV1/CHD7, ADGRV1/ATP8B1) were each examined for SNP-SNP interactions, making a
286
total of 5,324 SNP pairs. There were 37 SNP pairs that reached Pint ≤ 5x10⁻³ in EGEA and were 287
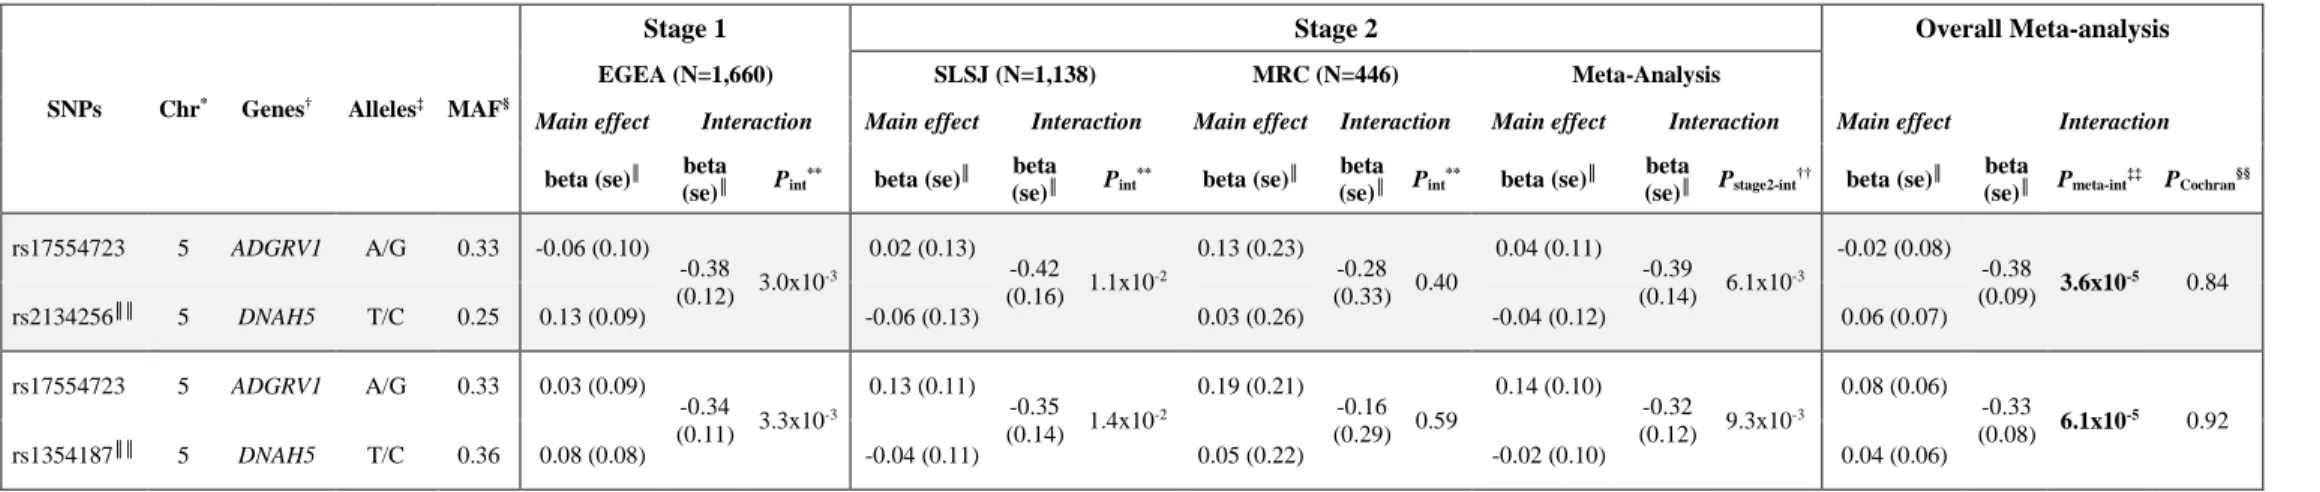
followed-up in SLSJ and MRC at stage 2. Two of these SNPs pairs, which are related to the 288
ADGRV1 and DNAH5 gene pair, met the multiple-testing corrected threshold, estimated to be
289
7.3x10⁻⁵ (see Table E4), in the meta-analysis of the three datasets (Table II). The two significant 290
interactions involved the same SNP rs17554723 within ADGRV1 and two SNPs within DNAH5, 291
rs2134256 (Pmeta-int=3.6x10⁻⁵) and rs1354187 (Pmeta-int=6.1x10⁻⁵), that are in moderate LD (r2=0.50; 292
D’=0.95). However, further conditional regression analysis in each of the strata defined by 293
genotypes at ADGRV1 rs17554723 showed that DNAH5 rs1354187 was no longer significantly 294
associated with atopy (P≥0.15) when conditioning on DNAH5 rs2134256. The most significant 295
SNP pair shows a pattern of interaction in which the ORs for atopy associated with TT (or CC) 296
genotype at DNAH5 rs2134256 are in opposite direction according to the genotype, AA (or GG), 297
at ADGRV1 rs17554723 (Figure 2). This pattern was consistent in all three datasets (Figure 2). 298
299
Stratified analyses according to asthma status
300
Association analyses of atopy with the genome-wide significant ADGRV1 rs4916831 SNP in 301
asthmatic and non-asthmatic subjects did not show any relationship with presence of asthma in the 302
stage 1 and stage 2 datasets and meta-analysis of the three datasets (PCochran for test of homogeneity 303
between the two groups ≥0.82; Table E5A). In the meta-analysis, the evidence for association was 304
even stronger although not significantly in non-asthmatics (P=7.8x10⁻⁶) than in asthmatics 305
(P=1.4x10⁻⁴). Similarly, interaction analyses for ADGRV1 and DNAH5 SNPs did not show any 306
relationship with asthma (PCochran ≥ 0.30; Table E5B). The evidence for interaction was only 307
significant in non-asthmatic subjects (Table E6B); this can be at least partly explained by the larger 308
sample size of non-asthmatic (N=1,849) than asthmatic subjects (N=1,354). 309
310
Functional annotations of SNPs showing significant results
311
All SNPs that show significant association (or interaction) with atopy are intronic. The two 312
ADGRV1 SNPs, rs4916831 and rs17554723 on 5q14, detected through GWAS and interaction
313
analysis, lie 120 kb apart in introns 83 (rs4916831) and 70 (rs17554723) and are in low LD 314
(r2=0.20, D’=0.75). The two DNAH5 SNPs (rs2134256 and rs1354187) at 5p15.2 are located in 315
introns 58 and 60 (8 kb apart) but only rs2134256 accounts for the interaction signal (see above). 316
By interrogating the Genotype-Tissue Expression (GTEx) database,32 rs4916831 was found 317
associated with ADGRV1 expression in esophagus mucosa (P=7.5x10⁻⁷).32 We also investigated 318
whether the ADGRV1 and DNAH5 SNPs (as well as their proxies, r2≥0.80) map to functionally 319
important regulatory regions using HaploRegV4.33 As shown in Table E6, these SNPs and/or 320
proxies map to binding sites of various transcription factors (TFs). In addition, four proxies of 321
ADGRV1 rs4916831 map to enhancer histone marks in lung and skin while a proxy of DNAH5
322
rs2134256 maps to promoter and enhancer marks in hematopoietic stem cells. 323
324
DISCUSSION
325
By combining genome-wide single-SNP analysis and epistasis analysis driven by statistical and 326
knowledge-based evidence in three asthma-ascertained family datasets, we identified significant 327
association of atopy at a novel 5q14 locus harboring ADGRV1 gene and significant interaction 328
between ADGRV1 and DNAH5 genetic variants. 329
The interaction between ADGRV1 and DNAH5 variants has biological relevance as these two genes 330
associated with genetic mutations encoding defective proteins, which result in either abnormal 332
formation or function of cilia.34 Mutations in the adhesion G protein-coupled receptor V1 333
(ADGRV1) gene cause Usher syndrome type IIC, a ciliopathy characterized by hearing loss and 334
visual impairment,35,36 while mutations of dynein axonemal heavy chain 5 (DNAH5) gene cause 335
primary ciliary dyskinesia type 3, a ciliopathy which combines upper and lower tract respiratory 336
manifestations, male infertility, and situs inversus.37 The ADGRV1 protein (also called GPR98) is 337
a component of the Usher protein network that functions in stereocilia of inner ear hair cells and 338
photoreceptor cilia. The heavy chain of axonemal dynein, encoded by DNAH5, is part of a 339
microtubule-associated motor protein complex that is responsible for cilia mobility, especially in 340
respiratory epithelial cells where cilia motility is essential for mucus transport and airway 341
clearance.38 Although the respective function of ADGRV1 and DNAH5 proteins was initially 342
described in different organs, these proteins may also have related functions. Indeed, the cilium in 343
photoreceptors is ultrastructurally very similar to the nasal ciliated epithelium and the nasal ciliated 344
epithelium of Usher syndrome II patients was found to have a lower ciliary beat frequency than 345
healthy controls.39 Moreover, Usher syndrome has been reported to be associated with 346
bronchiectasis, sinusitis and reduced nasal mucociliary clearance.40 347
Besides the involvement of both ADGRV1 and DNAH5 proteins in cilia functions, which supports 348
the statistical interaction found between these two genes, both DNAH5 and ADGRV1 genes have 349
been previously associated with respiratory diseases and related phenotypes. Recent GWAS 350
reported significant association of DNAH5 variants with total lung capacity in chronic obstructive 351
pulmonary disease41 and suggestive association with Immunoglobuline E grass sensitization.9 352
However, the SNP reported by that latter study was not in LD with the DNAH5 SNPs interacting 353
with ADGRV1 SNP in this study (r2<0.13). Based on an approach similar to ours, which combined 354
genome-wide expression data in nasal epithelial cells, allele frequency variation between 355
populations and literature search to select candidate genes, nominal association of asthma with 356
DNAH5 was reported and stronger association was found with KIF3, a gene involved in transport
357
of protein complexes within cilia and potentially in allergen clearance as DNAH5.42 In addition, 358
DNAH5 belongs to the same gene family as DNAH9 which showed interaction with environmental
359
tobacco smoke (ETS) exposure for bronchial hyperresponsiveness in EGEA and SLSJ families.43 360
Moreover, suggestive association of ADGRV1 with asthma has been recently reported by a meta-361
analysis of GWAS.44 Though most previously reported associations concern asthma or respiratory 362
phenotypes, the interaction between ADGRV1 and DNAH5 SNPs associated with atopy in the 363
present study appears independent of asthma, as shown by the stratified analysis on asthma. 364
Although the mechanism by which these two genes influence atopy is still unknown, we can 365
hypothesize that they are involved in dysfunction of cilia that move secreted mucus containing 366
trapped foreign particles up and out of the airways, which favors allergic sensitization. This is 367
supported by recent observations of a differential mRNA expression of both ADGRV1 and DNAH5 368
genes in sputum from House Dust Mite (HDM)-sensitized wheezing subjects as compared to non-369
atopic controls.45 Furthermore, DNAH5 as well as other genes of the same family including DNAH9 370
were among the highest-ranking co-expression hubs in one of the HDM-wheezing associated gene 371
modules, which was strongly enriched with genes involved in the function of ciliated epithelial 372
cells.45 All these observations suggest cilia-related genes may constitute an important emerging 373
pathway for atopy. 374
The strategy used in this study, that enabled identifying novel relevant candidates for atopy, 375
combined genome-wide single-SNP analysis and gene-gene interaction analysis based on both 376
statistical filtering of GWAS results and text-mining filtering. It is of note that our three-step 377
strategy was designed a priori and SNP-SNP interaction tests were only performed for gene pairs 378
towards one gene (ADGRV1) which harbored the lead SNP rs4916831 reaching genome-wide 380
significance and four other SNPs showing suggestive association. By increasing the density of 381
SNPs through Hapmap2-based imputation at that locus, an additional SNP (r2=0.80 with 382
rs4916831) reached genome-wide significance and six other SNPs had P-values within one order 383
of magnitude of the genome-wide threshold (results not shown), which strengthens our finding. 384
Further conditional analysis in that region showed that association with atopy was only accounted 385
for by the lead genotyped SNP. The subsequent statistical and text-mining filters, used prior to 386
epistasis analysis, made it possible to detect gene-gene interaction by lowering the multiple testing 387
burden. Indeed, use of both filters reduced the number of interaction tests by 9-fold as compared 388
to using the statistical filter only. The text-mining filter was based on GRAIL that was shown to be 389
successful in pointing out true disease regions that were validated.17 Although many sources of 390
biological information can be used to connect genes, such as co-expression gene networks or 391
protein-protein interaction networks, the advantage of GRAIL is to provide a broader framework 392
for revealing gene-gene relationships of any origin through literature search. However, GWAS and 393
candidate gene studies, which are driven by researchers’ expectations, can create a bias towards 394
genes that are frequently reported in the literature. An appropriate approach would be to utilize the 395
existing knowledge and to correct for potential bias but, to our knowledge, such method does not 396
exist yet. 397
398
In conclusion, this study shows that the proposed strategy that combines GWAS and epistasis 399
analysis driven by statistical and knowledge-based evidence can successfully identify strong 400
candidate genes for complex phenotypes as atopy. The interaction between DNAH5 and ADGRV1, 401
two genes involved in cilia functions, is of biological relevance and provides a novel mechanism 402
underlying atopy. Further studies, including functional and experimental studies, are needed to 403
confirm the current findings and to identify the functional variants. 404
Acknowledgments
406
EGEA: The authors thank all those who participated to the setting of the study and on the various 407
aspects of the examinations involved: interviewers, technicians for lung function testing and skin 408
prick tests, blood sampling, IgE determinations, coders, those involved in quality control, data and 409
sample management and all those who supervised the study in all EGEA centers. The authors are 410
grateful to the three CIC-Inserm of Necker, Grenoble and Marseille who supported the EGEA study 411
and in which subjects were examined. They are also grateful to the biobanks in Lille (CIC-Inserm) 412
and at Annemasse (Etablissement français du sang) where EGEA biological samples are stored. 413
We thank the Epidemiological Study on Genetics and Environment of Asthma (EGEA) cooperative 414
group members as follows. 415
Coordination: V Siroux (epidemiology, PI since 2013); F Demenais (genetics); I Pin (clinical 416
aspects); R Nadif (biology). F Kauffmann (PI 1992-2012); Respiratory epidemiology: Inserm U 417
700, Paris M Korobaeff (Egea1), F Neukirch (Egea1); Inserm U 707, Paris: I Annesi-Maesano 418
(Egea1-2); Inserm CESP/U 1018, Villejuif: F Kauffmann, N Le Moual, R Nadif, MP Oryszczyn 419
(Egea1-2), R. Varraso; Inserm U 823, Grenoble: V Siroux. Genetics: Inserm U 393, Paris: J 420
Feingold; Inserm U 946, Paris: E Bouzigon, F Demenais, MH Dizier; CNG, Evry: I Gut (now 421
CNAG, Barcelone, Spain), M Lathrop (now Univ McGill, Montreal, Canada). Clinical centers: 422
Grenoble: I Pin, C Pison; Lyon: D Ecochard (Egea1), F Gormand, Y Pacheco; Marseille: D Charpin 423
(Egea1), D Vervloet (Egea1-2); Montpellier: J Bousquet; Paris Cochin: A Lockhart (Egea1), R 424
Matran (now in Lille); Paris Necker: E Paty (Egea1-2), P Scheinmann (Egea1-2); Paris-Trousseau: 425
A Grimfeld (Egea1-2), J Just. Data and quality management: Inserm ex-U155 (Egea1): J Hochez; 426
Inserm CESP/U 1018, Villejuif: N Le Moual, Inserm U780: C Ravault (Egea1-2); Inserm ex-427
U794: N Chateigner; Grenoble: J Ferran (Egea1-2). 428
SLSJ: We thank all participants included in the SLSJ asthma familial collection. Catherine Laprise
429
built, coordinates and manages the SLSJ study. Drs. Paul Bégin and Charles Morin confirmed the 430
respiratory diagnosis for the adults and children respectively. We also thank the laboratory 431
technician (Nadia Mior, Denise Morin), research professional (Anne-Marie Madore) and nurses 432
(from the ECOGENE-21 Biocluster). Catherine Laprise is the Canada Research Chair in 433
Environment and Genetics of Respiratory Disorders and Allergy, Director of the Asthma Strategic 434
Group of the Respiratory Health Network (RHN) of Fonds de la recherche en santé du Québec 435
(FRSQ) and researcher of the AllerGen NCE. 436
MRC: The authors thank all the families who participated and were recruited as part of the MRCA 437
and MRCE collections (Coordination: M.F. Moffatt, W.O.C.M Cookson and J.I. Harper). We thank 438
the research nurses involved as well as personnel who conducted blood extractions, IgE 439
determinations and sample management (Anna Dixon). Genotyping of the cohorts was done by the 440
CNG, Evry: I Gut (now CNAG, Barcelone, Spain), M Lathrop (now Univ McGill, Montreal, 441
Canada). 442
REFERENCES
444
1. Ober C, Yao TC. The genetics of asthma and allergic disease: a 21st century perspective. Immunol Rev 445
2011; 242:10-30. 446
2. Welter D, MacArthur J, Morales J, Burdett T, Hall P, Junkins H, et al. The NHGRI GWAS Catalog, a 447
curated resource of SNP-trait associations. Nucleic Acids Res 2014; 42:D1001-6. 448
3. Bonnelykke K, Sparks R, Waage J, Milner JD. Genetics of allergy and allergic sensitization: common 449
variants, rare mutations. Curr Opin Immunol 2015; 36:115-26. 450
4. Los H, Postmus PE, Boomsma DI. Asthma genetics and intermediate phenotypes: a review from twin 451
studies. Twin Res 2001; 4:81-93. 452
5. Thomsen SF, Ulrik CS, Kyvik KO, Ferreira MA, Backer V. Multivariate genetic analysis of atopy 453
phenotypes in a selected sample of twins. Clin Exp Allergy 2006; 36:1382-90. 454
6. Vercelli D. Discovering susceptibility genes for asthma and allergy. Nat Rev Immunol 2008; 8:169-82. 455
7. Andiappan AK, Wang de Y, Anantharaman R, Parate PN, Suri BK, Low HQ, et al. Genome-wide 456
association study for atopy and allergic rhinitis in a Singapore Chinese population. PLoS One 2011; 457
6:e19719. 458
8. Castro-Giner F, Bustamante M, Ramon Gonzalez J, Kogevinas M, Jarvis D, Heinrich J, et al. A 459
pooling-based genome-wide analysis identifies new potential candidate genes for atopy in the European 460
Community Respiratory Health Survey (ECRHS). BMC Med Genet 2009; 10:128. 461
9. Ramasamy A, Curjuric I, Coin LJ, Kumar A, McArdle WL, Imboden M, et al. A genome-wide meta-462
analysis of genetic variants associated with allergic rhinitis and grass sensitization and their interaction 463
with birth order. J Allergy Clin Immunol 2011; 128:996-1005. 464
10. Wan YI, Strachan DP, Evans DM, Henderson J, McKeever T, Holloway JW, et al. A genome-wide 465
association study to identify genetic determinants of atopy in subjects from the United Kingdom. J 466
Allergy Clin Immunol 2011; 127:223-31, 31 e1-3.
11. Bonnelykke K, Matheson MC, Pers TH, Granell R, Strachan DP, Alves AC, et al. Meta-analysis of 468
genome-wide association studies identifies ten loci influencing allergic sensitization. Nat Genet 2013; 469
45:902-6. 470
12. Hinds DA, McMahon G, Kiefer AK, Do CB, Eriksson N, Evans DM, et al. A genome-wide association 471
meta-analysis of self-reported allergy identifies shared and allergy-specific susceptibility loci. Nat 472
Genet 2013; 45:907-11.
473
13. Dizier MH, Margaritte-Jeannin P, Madore AM, Esparza-Gordillo J, Moffatt M, Corda E, et al. The 474
ANO3/MUC15 locus is associated with eczema in families ascertained through asthma. J Allergy Clin 475
Immunol 2012; 129:1547-53 e3.
476
14. Sun X, Lu Q, Mukherjee S, Crane PK, Elston R, Ritchie MD. Analysis pipeline for the epistasis search 477
- statistical versus biological filtering. Front Genet 2014; 5:106. 478
15. Li ZC, Huang MH, Zhong WQ, Liu ZQ, Xie Y, Dai Z, et al. Identification of drug-target interaction 479
from interactome network with 'guilt-by-association' principle and topology features. Bioinformatics 480
2016; 32:1057-64. 481
16. Luo Y, Riedlinger G, Szolovits P. Text mining in cancer gene and pathway prioritization. Cancer 482
Inform 2014; 13:69-79.
483
17. Raychaudhuri S, Plenge RM, Rossin EJ, Ng AC, Purcell SM, Sklar P, et al. Identifying relationships 484
among genomic disease regions: predicting genes at pathogenic SNP associations and rare deletions. 485
PLoS Genet 2009; 5:e1000534.
486
18. Kauffmann F, Dizier MH, Annesi-Maesano I, Bousquet J, Charpin D, Demenais F, et al. EGEA 487
(Epidemiological study on the Genetics and Environment of Asthma, bronchial hyperresponsiveness 488
and atopy)-- descriptive characteristics. Clin Exp Allergy 1999; 29 Suppl 4:17-21. 489
19. Kaufmann F, Dizier MH, Pin I, Paty E, Gormand F, Vervloet D, et al. Epidemiological Study of the 490
Genetics and Environment of Asthma, Bronchial Hyperresponsiveness, and Atopy. Am J Respir Crit 491
Care Med 1997; 156:123-9.
20. Bouzigon E, Nadif R, Le Moual N, Dizier MH, Aschard H, Boudier A, et al. [Genetic and 493
environmental factors of asthma and allergy: Results of the EGEA study]. Rev Mal Respir 2015; 494
32:822-40. 495
21. Laprise C. The Saguenay-Lac-Saint-Jean asthma familial collection: the genetics of asthma in a young 496
founder population. Genes Immun 2014; 15:247-55. 497
22. Moffatt MF, Kabesch M, Liang L, Dixon AL, Strachan D, Heath S, et al. Genetic variants regulating 498
ORMDL3 expression contribute to the risk of childhood asthma. Nature 2007; 448:470-3. 499
23. Moffatt MF, Gut IG, Demenais F, Strachan DP, Bouzigon E, Heath S, et al. A large-scale, consortium-500
based genomewide association study of asthma. N Engl J Med 2010; 363:1211-21. 501
24. Sarnowski C, Sugier PE, Granell R, Jarvis D, Dizier MH, Ege M, et al. Identification of a new locus at 502
16q12 associated with time to asthma onset. J Allergy Clin Immunol 2016. 503
25. Liang L, Morar N, Dixon AL, Lathrop GM, Abecasis GR, Moffatt MF, et al. A cross-platform analysis 504
of 14,177 expression quantitative trait loci derived from lymphoblastoid cell lines. Genome Res 2013; 505
23:716-26. 506
26. Li Y, Abecasis GR. Mach 1.0: Rapid haplotype reconstruction and missing genotype inference. Am. J. 507
Hum. Genet. 2006; S79:2290.
508
27. Li Y, Willer C, Sanna S, Abecasis G. Genotype imputation. Annu Rev Genomics Hum Genet 2009; 509
10:387-406. 510
28. Li MX, Yeung JM, Cherny SS, Sham PC. Evaluating the effective numbers of independent tests and 511
significant p-value thresholds in commercial genotyping arrays and public imputation reference 512
datasets. Hum Genet 2012; 131:747-56. 513
29. Herold C, Steffens M, Brockschmidt FF, Baur MP, Becker T. INTERSNP: genome-wide interaction 514
analysis guided by a priori information. Bioinformatics 2009; 25:3275-81. 515
30. Li J, Ji L. Adjusting multiple testing in multilocus analyses using the eigenvalues of a correlation 516
matrix. Heredity 2005; 95:221-7. 517
31. Cochran WG. The comparison of percentages in matched samples. Biometrika 1950; 37:256-66. 518
32. The GTEx Consortium. Human genomics. The Genotype-Tissue Expression (GTEx) pilot analysis: 519
multitissue gene regulation in humans. Science 2015; 348:648-60. 520
33. Ward LD, Kellis M. HaploReg: a resource for exploring chromatin states, conservation, and regulatory 521
motif alterations within sets of genetically linked variants. Nucleic Acids Res 2012; 40:D930-4. 522
34. Fliegauf M, Benzing T, Omran H. When cilia go bad: cilia defects and ciliopathies. Nat Rev Mol Cell 523
Biol 2007; 8:880-93.
524
35. Weston MD, Luijendijk MW, Humphrey KD, Moller C, Kimberling WJ. Mutations in the VLGR1 525
gene implicate G-protein signaling in the pathogenesis of Usher syndrome type II. Am J Hum Genet 526
2004; 74:357-66. 527
36. Besnard T, Vache C, Baux D, Larrieu L, Abadie C, Blanchet C, et al. Non-USH2A mutations in USH2 528
patients. Hum Mutat 2012; 33:504-10. 529
37. Leigh MW, Zariwala MA, Knowles MR. Primary ciliary dyskinesia: improving the diagnostic 530
approach. Curr Opin Pediatr 2009; 21:320-5. 531
38. Olbrich H, Horvath J, Fekete A, Loges NT, Storm van’s Gravesande K, Blum A, et al. Axonemal 532
localization of the dynein component DNAH5 is not altered in secondary ciliary dyskinesia. Pediatr 533
Res 2006; 59:418-22.
534
39. Armengot M, Salom D, Diaz-Llopis M, Millan JM, Milara J, Mata M, et al. Nasal ciliary beat frequency 535
and beat pattern in retinal ciliopathies. Invest Ophthalmol Vis Sci 2012; 53:2076-9. 536
40. Bonneau D, Raymond F, Kremer C, Klossek JM, Kaplan J, Patte F. Usher syndrome type I associated 537
with bronchiectasis and immotile nasal cilia in two brothers. J Med Genet 1993; 30:253-4. 538
41. Lee JH, McDonald ML, Cho MH, Wan ES, Castaldi PJ, Hunninghake GM, et al. DNAH5 is associated 539
with total lung capacity in chronic obstructive pulmonary disease. Respir Res 2014; 15:97. 540
42. Kovacic MB, Myers JM, Wang N, Martin LJ, Lindsey M, Ericksen MB, et al. Identification of KIF3A 541
as a novel candidate gene for childhood asthma using RNA expression and population allelic 542
frequencies differences. PLoS One 2011; 6:e23714. 543
43. Dizier MH, Nadif R, Margaritte-Jeannin P, Barton SJ, Sarnowski C, Gagne-Ouellet V, et al. Interaction 544
between the DNAH9 gene and early smoke exposure in bronchial hyperresponsiveness. Eur Respir J 545
2016; 47:1072-81. 546
44. Almoguera B, Vazquez L, Mentch F, Connolly J, Pacheco JA, Sundaresan AS, et al. Identification of 547
Four Novel Loci in Asthma in European and African American Populations. Am J Respir Crit Care 548
Med 2016 Sep 9; [Epub ahead of print].
549
45. Jones AC, Troy NM, White E, Hollams EM, Gout AM, Ling KM, et al. Persistent activation of 550
interlinked Th2-airway epithelial gene networks in sputum-derived cells from aeroallergen-sensitized 551
symptomatic atopic asthmatics. bioRxiv 2016; https://doi.org/10.1101/063602 552
Table I. ADGRV1 locus on 5q14 showing significant association with atopy
Stage 1 Stage 2 Overall Meta-Analysis
EGEA (N=1,660) SLSJ (N=1,138) MRC (N=446) Meta-Analysis SNP Position
(kb)* Alleles† MAF‡ beta (se) § P║ beta (se) § P║ beta (se) § P║ beta (se) § Pstage2** beta (se) § Pmeta†† PCochran‡‡ rs4244205 90,188 A/G 0.41 -0.35 (0.08) 1.1x10⁻⁵ -0.19 (0.10) 6.0x10⁻² -0.14 (0.18) 0.45 -0.18 (0.09) 4.4x10⁻² -0.27 (0.06) 3.8x10⁻⁶ 0.35
rs4916831 90,212 A/G 0.44 -0.40 (0.08) 1.0x10⁻⁶ -0.32 (0.11) 2.3x10⁻³ -0.21 (0.17) 0.23 -0.29 (0.09) 1.2x10⁻³ -0.35 (0.06) 6.8x10⁻⁹ 0.59 rs10060641 90,213 T/C 0.38 -0.39 (0.08) 7.2x10⁻⁷ -0.17 (0.11) 0.11 -0.24 (0.19) 0.22 -0.18 (0.09) 4.8x10⁻² -0.30 (0.06) 4.3x10⁻⁷ 0.23
rs12054681 90,217 C/A 0.37 -0.39 (0.08) 9.7x10⁻⁷ -0.14 (0.11) 0.18 -0.29 (0.21) 0.16 -0.17 (0.09) 6.5x10⁻² -0.30 (0.06) 7.8x10⁻⁷ 0.18
rs949787 90,251 G/T 0.28 -0.33 (0.08) 5.5x10⁻⁵ -0.23 (0.10) 2.0x10⁻² -0.19 (0.20) 0.36 -0.22 (0.09) 1.2x10⁻² -0.28 (0.06) 3.2x10⁻⁶ 0.65
*Position in kilobases (kb) according to NCBI dbSNP Build 137 †Major allele/Minor allele
‡Minor allele frequency
§beta is the regression coefficient for a one-unit increase of the effect allele in logistic regression assuming an additive model; se is the standard error associated
with the regression coefficient.
║P is the P-value associated with the Wald test of SNP effect. **P
stage2 is the P-values associated with the Wald test of meta-analyzed SNP effect in the stage 2 datasets (SLSJ and MRC). ††P
meta is the P-value associated with the Wald test of meta-analyzed SNP effect in the three datasets (EGEA, SLSJ, MRC); the P-value is shown in bold when it
reached the multiple-testing corrected threshold of 1.5x10⁻⁷. ‡‡P
Table II. SNP pairs showing significant interaction for atopy
*Chr is the chromosome number where the SNP is located †Gene symbol of gene where SNP lies
‡Major allele/Minor allele §Minor allele frequency
║beta for the main effect is the regression coefficient for a one-unit increase of the effect allele in logistic regression assuming an additive model; beta for interaction
is the regression coefficient for homozygotes for the minor allele at the two loci or homozygotes for the major allele at the two loci with respect to heterozygotes at either one or the two loci using the coding scheme under an additive genetic model described in the methods section; se is the standard error associated with the regression coefficient.
**P
int is the P-value of the likelihood-ratio test for interaction between SNPs (which follows a chi-square distribution with one degree of freedom assuming an
additive model).
††P
stage2-int is the P-values associated with the Wald test of meta-analyzed interaction effect in the stage 2 datasets (SLSJ and MRC). ‡‡P
meta-int is the P-values associated with the Wald test of meta-analyzed interaction effect in the three datasets (EGEA, SLSJ, MRC); Pmeta-int is shown in bold when
it reached the multiple-testing corrected threshold of 7.3x10⁻⁵. §§P
Cochran is the P-value associated with Cochran’s Q test of homogeneity across the three datasets.
║║The two DNAH5 SNPs, rs1354187 and rs2134256, showing significant interaction with ADGRV1 SNP are in moderate linkage disequilibrium (r²=0.50; D'=0.95).
SNPs Chr* Genes† Alleles‡ MAF§
Stage 1 Stage 2 Overall Meta-analysis
EGEA (N=1,660) SLSJ (N=1,138) MRC (N=446) Meta-Analysis
Main effect Interaction Main effect Interaction Main effect Interaction Main effect Interaction Main effect Interaction
beta (se)║ beta (se)║ Pint
** beta (se)║ beta
(se)║ Pint
** beta (se)║ beta
(se)║ Pint
** beta (se)║ beta
(se)║ Pstage2-int
†† beta (se)║ beta
(se)║ Pmeta-int ‡‡ P Cochran§§ rs17554723 5 ADGRV1 A/G 0.33 -0.06 (0.10) -0.38 (0.12) 3.0x10 -3 0.02 (0.13) -0.42 (0.16) 1.1x10 -2 0.13 (0.23) -0.28 (0.33) 0.40 0.04 (0.11) -0.39 (0.14) 6.1x10 -3 -0.02 (0.08) -0.38 (0.09) 3.6x10 -5 0.84 rs2134256║║ 5 DNAH5 T/C 0.25 0.13 (0.09) -0.06 (0.13) 0.03 (0.26) -0.04 (0.12) 0.06 (0.07) rs17554723 5 ADGRV1 A/G 0.33 0.03 (0.09) -0.34 (0.11) 3.3x10 -3 0.13 (0.11) -0.35 (0.14) 1.4x10 -2 0.19 (0.21) -0.16 (0.29) 0.59 0.14 (0.10) -0.32 (0.12) 9.3x10 -3 0.08 (0.06) -0.33 (0.08) 6.1x10 -5 0.92 rs1354187║║ 5 DNAH5 T/C 0.36 0.08 (0.08) -0.04 (0.11) 0.05 (0.22) -0.02 (0.10) 0.04 (0.06)
FIGURE LEGENDS
Figure 1. Three-step analysis strategy
Figure 2. Odds-ratio (ORs) and 95% confidence intervals for atopy associated with each genotype
at DNAH5 rs2134256 (TT, CT, CC) in each of the strata defined by genotypes at ADGRV1 rs17554723 (AA, AG, or GG). These ORs were calculated using the genotype coding scheme defined in the text and are shown for each of the three datasets (EGEA, SLSJ, MRC) and for the combined dataset.