HAL Id: hal-00779218
https://hal.archives-ouvertes.fr/hal-00779218
Submitted on 21 Jan 2013
HAL is a multi-disciplinary open access
archive for the deposit and dissemination of
sci-entific research documents, whether they are
pub-lished or not. The documents may come from
teaching and research institutions in France or
abroad, or from public or private research centers.
L’archive ouverte pluridisciplinaire HAL, est
destinée au dépôt et à la diffusion de documents
scientifiques de niveau recherche, publiés ou non,
émanant des établissements d’enseignement et de
recherche français ou étrangers, des laboratoires
publics ou privés.
Articulatory speaker normalisation based on MRI-data
using three-way linear decomposition methods
Julián Andrés Valdés Vargas, Pierre Badin, Laurent Lamalle
To cite this version:
Julián Andrés Valdés Vargas, Pierre Badin, Laurent Lamalle. Articulatory speaker normalisation
based on MRI-data using three-way linear decomposition methods. Interspeech 2012 - 13th
An-nual Conference of the International Speech Communication Association, Sep 2012, Portland, United
States. pp.Thu.O9c.03. �hal-00779218�
Articulatory speaker normalisation based on MRI-data using three-way linear
decomposition methods
Julián Andrés Valdés Vargas
1, Pierre Badin
1, Laurent Lamalle
21
GIPSA-lab (Département Parole & Cognition), UMR 5216 CNRS – Grenoble University
2
SFR1 RMN Biomédicale et Neurosciences (Unité IRM Recherche 3 Tesla), INSERM, CHU de
Grenoble
{julian-andres.valdes-vargas,Pierre.Badin}@gipsa-lab.grenoble-inp.fr, [email protected]
Abstract
The aim of this study was to characterise, to model and to compare the different lingual articulatory strategies of a group of speakers. Individual principal component analysis (PCA) and multi-linear decomposition methods have been applied to different representations of the tongue contour extracted from magnetic resonance images (MRI). The corpus consisted of seven speakers articulating 63 French vowels and consonants. On the average, over the seven speakers, the Root Mean Square prediction Error (RMSE) was 0.12 cm accounting for a percentage of variance explanation of 92.6% for the individual PCA, using 4 components. Several Multi-linear decomposition methods, to model the tongue contour with a single set of components, have been performed and compared. The 2-Level-PCA gave the best results among the other techniques. By means of a Student's t-test, at 5% of significance level, we found that 2-level-PCA equals the PCA performance with 11 components to represent 91% of the variance explanation with a RMSE of 0.11 cm. While the same method, with 4 components, represents 75% of the variance explanation with a RMSE of 0.19 cm.
Index Terms: Articulatory modelling, speaker normalisation,
factor analysis, MRI.
1.
Introduction
The Speech & Cognition Department at GIPSA-lab has developed acoustic-to-articulatory inversion methods to provide speakers with a visual articulatory feedback [1] based on a fairly complete orofacial clone. This clone is made of a set of models of articulators (jaw, tongue, velum, lips, etc.) based on articulatory data acquired on a single speaker [2]. Therefore, the clone represents faithfully the characteristics of a specific speaker, but not necessarily those of other speakers that may have different morphologies and different articulatory control strategies. Thus, one important issue is the normalisation problem: how can the speaker-specific models of the orofacial clone be adapted to other speakers? This problem is particularly challenging as it implies discovering how different speakers with different morphologies can produce articulated sounds that are considered equivalent for speech communication purposes. Several studies based on measurements with Electromagnetic Articulography (EMA) and Magnetic Resonance Imaging (MRI), based only on vowels, have been led in this field. The present study attempts to extend this type of modelling from vowels to consonants. We first describe the set of data acquired to perform the different experiments and the linear decomposition methods
used; then we describe the performance of individual speaker models and compare them in terms of relative variance explained – i.e. the ratio of the variance of the reconstructed data over the variance of the original measured data – of Root Mean Square Error (RMSE), and of individual articulatory strategies. Next, we present a summary of the state of the art and compare our results with those reported in the literature. Finally, we show and compare the performance of different multi-linear decomposition methods to build a single model that drives the tongue contours of all the speakers.
2.
Data
In this study, midsagittal Magnetic Resonance Images (MRI) of seven French speakers (two males: PB, YL, and five females: HL,
AA, MG, AK, MGO) have been collected. The subjects were
instructed to pronounce and maintain the vocal tract shape of 63 different articulations for 16 seconds each. The corpus consisted of the 10 French oral vowels /i e ε a y ø œ u o ɔ/, the 3 nasal
vowels /ã ɛ ɔ/ and the 10 consonants /p t k f s ʃ m n ʁ l/
articulated in symmetric VCV context of five vowels /a e ε i u/. The contour of the tongue was manually edited with splines and re-sampled with N = 150 equidistant points. The present study is limited to the contour from the tongue tip to the base of the epiglottis.
3.
Linear decomposition methods
3.1 Principal component analysis (PCA)
PCA is a two-way factor analysis approach often used for dimensionality reduction and analysis of data sets to summarize their main characteristics. Consider articulatory measurements Xs = [x1, x2, ... , xA] for the speaker s which consists of vectors of
measurements (1 ≤ n ≤ N) for the articulations from 1 to A. Such that Xs is decomposed into a set of control parameters πs[A x Cmp]
(set of Cmp components that explain the variations in articulations) and the articulatory model Cs[N x Cmp] (Coefficients
that explain the contribution of each articulator point to the components) by the following equation:
Xs = πs * CsT + ξs (1)
3.2 Two-Level PCA
This method has been proposed by Ananthakrishnan [3]. The technique consists in unfolding the contour coordinates of all subjects together as X = [Xs1; Xs2; . . . ; Xsy] in which each
subject is a set of articulatory measurements Xs = [x1, x2,...,
xA].The data is decomposed using PCA according to equation 1.
3.3 Parallel factor (PARAFAC)
PARAFAC is a three-way factor analysis approach which is often used to decompose 3-dimensional data. In our specific case, the three dimensions are related to the articulations, articulator points and subjects, respectively. The data of a given subject Xs is decomposed as:
Xs = π * Фs * CT + ξs (2)
where ξ is the residual error. The extra matrix Фs, respect to the
PCA, provides speaker-specific weights to the contribution of the components.
3.4 Tucker
Tucker [4] also called three-mode PCA is an extension of PCA to three modes of variation. The data of a given subject Xs is
decomposed as:
Xs = ∑∑∑π * Фs * C *G (3)
The extra matrix G, respect to the PARAFAC,is called the core matrix which contains the factor loadings for all three modes of variation.
4.
Individual articulatory models (PCA)
The models were made and assessed by means of a leave-one-out cross validation (LOOCV) procedure. One observation of the data was left out; the model was built from the remaining data and used to predict the left-out articulation, this process was repeated for each articulation on the set. LOOCV was useful to decide how many predictors to use. For instance, the cross-validated mean-square error will tend to decrease if valuable predictors are added, but increase if worthless predictors are added. Indeed, increasing the number of predictors might lead to an over-fitted or degenerated model (Riu & Bro, 2003).
1 2 3 4 5 6 7 8 9 10 0 0.1 0.2 0.3 0.4 0.5 0.6 0.7 0.8 0.9 1
PCA jacknife Variance explained
Subject pb Subject yl Subject hl Subject aa Subject mg Subject ak Subject mgo 1 2 3 4 5 6 7 8 9 10 0 0.05 0.1 0.15 0.2 0.25 0.3 0.35 0.4 0.45 0.5
PCA jacknife Rmse Subject pb Subject yl Subject hl Subject aa Subject mg Subject ak Subject mgo
Figure 1 - Performance of the LOOCV PCA individual models as
a function of number of components for the tongue contours of the seven speakers PB, YL, HL, AA, MG, AK and MGO. Left: variance explained. Right: RMSE in centimeters.
Figure 1displays the variance explained and RMSE relative to the reconstruction of the tongue for the whole corpus of vowels
and consonants. For interpretability reasons, the final number of components used is four. This is explained in detail on section 4.1. We have found that, on average over our seven speakers, the LOOCV PCA model with the first four components explains an amount of 91.26% of the data variance, with an RMSE of 0.14 cm.
4.1 Differences between speaker control strategies
Using a procedure based on a guided PCA analysis of tongue contours, Badin and Serrurier [2] have shown that the first four components account for the largest amount of tongue movement variance. In this section we describe the results of the Guided PCA analysis of our seven speakers. The jaw height parameter
JH was defined as the normalized value of the measured lower
incisor height; it was used as the first control parameter of the tongue model (the associated model coefficients were obtained by the linear regression (LR) of all the vertex coordinates against
JH). The next two parameters, tongue body TB and tongue dorsum TD were extracted by PCA from the coordinates of the
midsagittal tongue contour, excluding the tongue tip region, from which the JH contribution had been removed (the associated model coefficients were obtained by LR, as for JH). The next parameter called tongue tip TT was extracted by PCA from the midsagittal tongue tip contour coordinates, from which the TB and TD contributions had been removed (the associated coefficients were also obtained by LR).
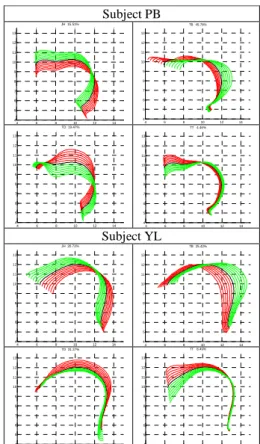
Subject PB 4 6 8 10 12 14 4 5 6 7 8 9 10 11 12 13 JH 15.51% 4 6 8 10 12 14 4 5 6 7 8 9 10 11 12 13 TB 45.78% 4 6 8 10 12 14 4 5 6 7 8 9 10 11 12 13 TD 19.47% 4 6 8 10 12 14 4 5 6 7 8 9 10 11 12 13 TT 4.46% Subject YL 4 6 8 10 12 14 4 5 6 7 8 9 10 11 12 13 JH 20.72% 4 6 8 10 12 14 4 5 6 7 8 9 10 11 12 13 TB 25.42% 4 6 8 10 12 14 4 5 6 7 8 9 10 11 12 13 TD 31.37% 4 6 8 10 12 14 4 5 6 7 8 9 10 11 12 13 TT 8.49%
Figure 2 - Illustration of the first four components and their
variance explained extracted by Guided PCA for the tongue contour of speakers PB and YL (from up to bottom respectively). Each predictor (JH, TB, TD and TT) is varied from -3 to +3 with a 0.5 step.
Hence, in order to understand the articulatory characteristics of each subject, we compared their four guided PCA components explained above. Figure 2 illustrates the associated nomograms for the subject PB and YL. The main effect of JH is a rotation of the tongue around a point located in its back. The JH parameter of subjects MGO, MG, AA and AK is more associated with a movement of the front of the tongue without movement in the back. Oppositely, subjects HL, PB and YL move the back of the tongue when JH moves. The tongue body parameter TB controls front-back displacements while the TD parameter is related to flattening-arching movements. It appears that the TB component of subjects HL, AK and YL is a rather horizontal movement of the tongue body while it is a more diagonal movement for subjects PB, MG, AA and MGO. Besides, TB explains more variability than TD for most subjects, but that behaviour is swapped for subject YL: in other words, subject YL uses more his tongue dorsum component than his tongue body component compared to the other subjects. On the other hand, the TT parameter controls precisely the tongue tip motions. We have observed that subjects AA, AK, MG, MGO and PB are able to move their tongue tips more independently from the tongue back than the subjects HL and YL do.
5.
Comparison with the literature:
PARAFAC model with vowels
In order to make a fair comparison of our results with those given by the literature, we restricted our modelling to the 10 French oral vowels. Using a two factor PARAFAC model, the average reconstruction error, over our seven speakers, was 0.25 cm for the 150 articulator points while the RMSE for tongue contours under-sampled to 3 points was 0.21 cm, accounting for a variance of 75.1% and 85.8%, respectively. Table 1shows that, on the overall, our results are comparable with those reported in the literature. The challenge is to extend this analysis to a corpus with consonants (63 articulations), as explained in the following sections.
Table 1 – Comparison of our results with the literature using
PARAFAC with 2 components.
6.
Multi-linear decomposition methods with
different representations of Data
Figure 3 illustrates the grid system proposed by [11]to represent the tongue contour with intersection points (INTRXY) and intersection distances (INT). The coordinates INTRXY refers to the intersections between the grid lines and the tongue contour. On the other hand, the coordinates INT are related to the internal distances of the grid lines up to the tongue contour.
In this section, we describe the results of different multi-linear decomposition methods such as 2-Level-PCA, PARAFAC, and TUCKER. The experiments are performed with 150 equidistant tongue contour points (TngUpper), 22 intersection points (INTRXY) and 22 intersection distances (INT).
Figure 3 – illustration of the grid system to represent the tongue
contour with INTRXY and INT.
Figure 4 shows the performance of all the methods with the different representations of data in terms of variance explanation and RMSE. The experiments with TUCKER show a very similar performance compared to 2-Level-PCA. As explained on sections 3.2 and 3.4, TUCKER is a method with a more complex structure and more parameters compared with the 2-Level-PCA. So, we keep the 2-Level-PCA and TUCKER is not further analysed on this paper.
2 4 6 8 10 12 14 16 18 20 0 0.1 0.2 0.3 0.4 0.5 0.6 0.7 0.8 0.9 1 number of components p e rc e n ta g e o f v a ri a n c e %
comparison variance PARAFAC TUCKER and 2LPCA
PCA tngUpperContour PCA INTRXY PCA INT PARAFAC tngUpperContour PARAFAC INTRXY PARAFAC INT 2Lpca tngUpperContour 2Lpca INTRXY 2Lpca INT TUCKER tngUpperContour TUCKER INTRXY TUCKER INT 2 4 6 8 10 12 14 16 18 20 0 0.1 0.2 0.3 0.4 0.5 0.6 0.7 0.8 0.9 1 number of components R M S E i n c m
comparison rmse PARAFAC TUCKER and 2LPCA PCA tngUpperContour PCA INTRXY PCA INT PARAFAC tngUpperContour PARAFAC INTRXY PARAFAC INT 2Lpca tngUpperContour 2Lpca INTRXY 2Lpca INT TUCKER tngUpperContour TUCKER INTRXY TUCKER INT
Figure 4 - Performance of the multi-linear decomposition
methods with several representations of data as a function of number of components of the seven speakers PB, YL, HL, AA, MG, AK and MGO. Left: variance explained. Right: RMSE in centimetres.
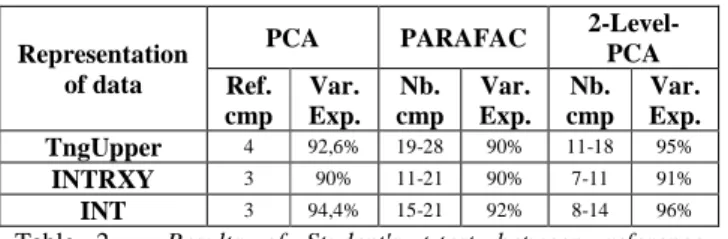
PCA models have been used as baseline models to assess the performance of the different multi-linear decomposition methods for each representation of data separately. As shown in section 4.1, the first four components account for about 90% of tongue movement variance for the TngUpper representation. Thus, 4 components are chosen as reference model. For the experiments with INTRXY and INT, we find that 3 components are sufficient to explain about the same variance as the PCA with TngUpper. We have then used a Student's t-test, at 5% significance level, to determine the number of components for each method that give RMSE not statistically different from those obtained by the reference PCA models (see Table 2). For the TngUpper
representation, the PARAFAC and 2-level-PCA need respectively between 19 and 28 components - depending on the speakers - and between 11 and 18 components. For the INTRXY representation, the PARAFAC and 2-Level-PCA need respectively 11-21 components and 7-11 components. Globally, the 2-Level-PCA with INTRXY uses the smallest range of components to model the tongue contour of all the speakers. We could conclude that, in terms of reduction of components, the 2-Level-PCA with INTRXY appears to be the optimal solution. Besides, we have verified that the first four components of the 2-Level-PCA models, for each of the 7 speakers, can be approximately interpreted in terms of jaw height, tongue body, tongue dorsum and tongue tip motions. These movements can appear in different order according to different subjects’ strategies.
Representation of data
PCA PARAFAC
2-Level-PCA Ref. cmp Var. Exp. Nb. cmp Var. Exp. Nb. cmp Var. Exp. TngUpper 4 92,6% 19-28 90% 11-18 95% INTRXY 3 90% 11-21 90% 7-11 91% INT 3 94,4% 15-21 92% 8-14 96%
Table 2 – Results of Student's t-test between reference
component PCA and the multi-linear methods (PARAFAC and 2-Level-PCA), for each representation of data.
7.
Conclusions
We applied individual PCA models and linear decomposition methods to model the tongue contours of 63 French phonemes extracted from an MRI database of 7 French speakers. As far as we know, this is one of the very few studies that includes both vowels and consonants. The primary focus of this study was to establish a model that represents different speaker articulatory strategies. The experiments carried out showed that such a kind of model is possible, using 4 components, with a RMSE of 0.12 cm accounting for a variance explanation of 92.6% for the individual PCA models. Several Multi-linear decomposition methods to model the tongue contour with a single set of components have been performed and compared with a reference PCA component by means of a Student's t-test. The 2-Level-PCA with INTRXY gave the best results. We found that 2-level-PCA and TUCKER are significantly equivalent to 2-level-PCA with a maximum of 11 components to represent 91% of the variance explanation with a RMSE of 0.11 cm. On the other hand, PARAFAC generally needs more components to be significantly equivalent to the reference PCA performance. The multi-linear decomposition methods showed an increase number of components compared with the individual PCA models. As showed on section 3.1, there is indeed an inter-speaker variability due to speaker independent control strategies. We suppose that linear methods may not offer a good solution to model tongue variations among different speakers, especially in the presence of consonants. Thus, future work is to be directed at using non linear methods.
8.
Acknowledgements
We sincerely thank all our kind and patient subjects. We thank also S. Masaki, S. Takano, I. Fujimoto, and Y. Shimada (ATR, Kyoto, Japan) for the MRI data on the first subject, and G. Ananthakrishnan (KTH, Stockholm, Sweden) for help with tracings and discussions about the methods. This work has been partially supported by the French ANR-08-EMER-001-02 grant
ARTIS (Articulatory inversion from audio-visual speech for
augmented speech presentation).
9.
References
[1] Ben Youssef, A., Hueber, T., Badin, P. and Bailly, G., "Toward a multi-speaker visual articulatory feedback system", In Interspeech, pp. 589-592, 2011. Florence, Italy.
[2] Badin, P. and Serrurier, A., "Three-dimensional modeling of speech organs: Articulatory data and models", In IEICE Technical Report, vol. 106, no. 177, pp. 29-34, 2006.
[3] Ananthakrishnan, G., Badin, P., Valdés Vargas, J.A. and Engwall, O., "Predicting unseen articulations from multi-speaker articulatory models", pp. 1588-1591, Makuhari, Japan, September 2010.
[4] Tucker, L., "Some mathematical notes on three-mode factor analysis", Psychometrika, pp. 279–311, 31(3) 1966.
[5] Hoole, P., "Modelling tongue configuration in German vowel production", in 5th ICSLP., paper 1096, Sydney, Australia, December 1998.
[6] Geng, C. and Mooshammer, C., "Modeling the German stress distinction" , pp. 161-164, Kloster Seeon, Germany, May 2000.
[7] Hu, F., "On the lingual articulation in vowel production: case study from Ningbo Chinese" , Ubatuba, SP, Brazil, 2006.
[8] Harshman, R., Ladefoged, P. and Goldstein, L., "Factor analysis of tongue shape", The J. Acoust. Soc. Am., vol. 62, no. 3, pp. 693-707, 1977.
[9] Hoole, P., Wismueller, A., Leinsinger, G., Kroos, C., Geumann, A. and Inoue, M., "Analysis of the tongue configuration in multi-speaker, multi-volume MRI data", pp. 157-160, Kloster Seeon, Germany, May 2000.
[10] Zheng, Y., Hasegawa-Johnson, M. and Pizza, S., "Analysis of the three-dimensional tongue shape using a three-index factor analysis model", The J. Acoust. Soc. Am., vol. 113, no. 1, pp. 478-486, 2003.
[11] Beautemps, D., Badin, P. and Bailly, G., "Linear degrees of freedom in speech production: Analysis of cineradio- and labio-film data and articulatory-acoustic modeling", J. Acoust. Soc. Am., vol. 109, pp. 2165–2180, 2001.