Synesthesia in children with difficulties in written language
learning
Anahita Basirat 1,* & Jean-Michel Hupé 2
1 Univ. Lille, CNRS, UMR 9193 - SCALab - Sciences Cognitives et Sciences Affectives, F-59000 Lille, France
2 Univ. Toulouse Paul Sabatier, CNRS, UMR 5549 - CerCo - Centre de Recherche Cerveau et Cognition, F-31000 Toulouse, France
* Corresponding author [email protected] Département d'Orthophonie
Faculté de Médecine (pôle formation) F-59045 Lille Cedex
France
Telephone: +33 3 20 62 76 07
Running title: Synesthesia and learning in children
This is the accepted manuscript of the following article:
Basirat, A. and J. M. Hupé (2020) Synesthesia in children with difficulties in written language learning. Conscious Cogn 82: 102951.
Abstract
We tested whether the acquisition of grapheme-color synesthesia during childhood is related to difficulties in written language learning by measuring whether it is more frequent in 79 children receiving speech and language therapy for such difficulties than in the general population of children (1.3%). By using criteria as similar as possible to those used in the reference study (Simner et al. 2009), we did not identify any synesthete (Bayesian 95% credible interval [0, 4.5]% for a flat prior). The odds of the null model (no difference between 0/79 and 1.3%) over alternative models is 28 (Bayes Factor). A higher prevalence of grapheme-color synesthetes among children with learning difficulties is therefore very unlikely, questioning the hypothesis of a link between synesthesia and difficulties in language acquisition. We also describe the difficulty of diagnosing synesthesia in children and discuss the need for new approaches to do so.
1. Introduction
P.M., who is a synesthete, has been associating colors, textures and personalities with letters and numbers since childhood. Here is how she describes the complex relationship she experienced between her synesthesia and learning when she was a child: “My perception of digits as well as their capacity to get along, or even to stand each other, created serious problems of dyscalculia at school, my mathematical logic not following that of my teachers. […] Contrary to digits during my school years, letters, with the complex and inexorable code I have forever been attributing to them, helped me a lot during the learning of reading and writing. [...]”. (Personal communication. See Appendix A for the full extract). Such a questioning by adult synesthetes of the role of synesthesia during their childhood is typical of many reports received by synesthesia researchers since the 19th century, as already evidenced
by this remark from one of Francis Galton’s correspondents, who experienced a fixed, colored mental scheme where he spatialized numerals: “I learnt arithmetic in a thoroughly old-fashioned unintelligent style, the first step being to learn to count without the least conception as to what the numbers meant” (Galton, 1880, report #14). Such anecdotal reports suggest that synesthetic associations may either facilitate or hinder the difficult mastering of literacy and/or numerical skills, suggesting a link between synesthesia and learning in children. Such a link should lead to a larger number of synesthetes among children with difficulties, either because synesthetic children have learning difficulties more often or because children with difficulties develop synesthetic associations more often to overcome their learning challenges. The aim of the current study was therefore to probe the hypothesis of a link between synesthesia and learning by investigating whether there is a higher prevalence of grapheme-color synesthesia in children with difficulties in written language learning than in the general population of children.
1.1. Synesthesia in children
Synesthesia is a subjective phenomenon involving additional, involuntary, arbitrary, idiosyncratic and constant associations (Chun & Hupé, 2016; Simner, 2012). Many types of associations exist. Grapheme-color synesthesia, the object of this study, refers to the association of colors to either letters or numbers (or both). Grapheme-color associations are already present during childhood. In chapter two of his autobiography, Nabokov (1966) stated that he had to associate colors with letters already at the age of seven, since he remembered remarking to his mother that the colors of his old alphabet blocks “were all wrong” (Hupé, 2020). Apart from anecdotal reports, only two published studies have systematically measured the prevalence of grapheme-color synesthesia in children. Simner et al. (2009) tested 615 UK school children aged 6-7 years and again one year later. They identified eight synesthetes (1.3%, 95% Credible Interval, CI [0.7, 2.6]%, here and later, the frequentist 95% confidence interval is about the same) who made constant color associations with letters or numbers. This prevalence is within the same range as that measured in the adult population of the UK by using similar procedures and criteria (colored letters and/or digits): 54 / 3893 = 1.4%, 95% CI [1.1, 1.8]% (Simner & Carmichael, 2015), suggesting that most synesthetes acquire their associations at that age and keep them as adults. However, grapheme-color associations develop progressively during childhood. In a follow-up study of their cohort of synesthetes, Simner and Bain (2013) observed that only 34% of associations were established at the age of 6-7 years, 48% at the age of 7-8 years and 71% at the age of 10-11 years. Using slightly different criteria to determine synesthesia for methodological reasons, Smees, Hughes, Duncan, Carmichael, & Simner (2019) identified 51 synesthetes among 1531 children aged 12-13 years from Scotland (3.33%, 95% CI [2.5, 4.4]%).
The origin of synesthesia is not well understood (for review, Ward, 2013). Some authors consider that it has a genetic (e.g. Asher et al., 2009) or neurodevelopmental (e.g. Hubbard, 2007) basis. Others highlight the role of learning and hypothesize that synesthetic associations are learned and memorized during childhood (e. g. Calkins 1893; Witthoft & Winawer, 2013; Watson, Akins, Spiker, Crawford, & Enns, 2014; Hupé & Dojat, 2015). In general, the former assumptions concern the development of the synesthesia and the latter the origins of specific associations (e.g. grapheme-color associations). These assumptions are not necessarily incompatible because they address different levels of causality (for a discussion about this issue, see Watson et al., 2017).
In the context of the learning hypothesis, the origin of synesthetic associations could relate to difficulties with reading and writing abilities in two different ways, either as an aid or as obstacle. Watson et al. (2017) hypothesized that some children may develop a synesthetic strategy by matching colors or character traits to letters to facilitate learning. Indeed, many methods of written language learning by teachers and language therapies make associations between colors or character traits (e.g. happy, jealous) with letters and sounds (e.g. French method "Planet of Alphas", Huguenin & Dubois, 1999). Such methods aim at improving the memorization of grapheme-phoneme correspondence. Consistent multimodal cues such as synesthetic associations can also improve statistical learning (Forest, Lichtenfeld, Alvarez, & Finn, 2019).
Watson et al. (2017) reasoned that the spontaneous development of this strategy is more likely when a child is faced with a more complex learning situation. They compared the prevalence of adult synesthetes among speakers of languages with transparent (easier) and opaque (more difficult) orthographies. In a transparent orthography such as Spanish, the grapheme-phoneme correspondence is consistent and regular. In an opaque orthography such as English, it is variable and irregular. Children
who are native speakers of languages with transparent orthography perform better in reading than those who are native speakers of languages with opaque orthography (e. g. Ellis et al., 2004). In a Canadian university with a large diversity of native languages, the authors found a higher prevalence of synesthetes (any type) among monolinguals of languages with opaque orthographies (2.8%, 95% CI [2.36, 3.35]%, N = 4297) compared to that among monolinguals of languages with transparent orthographies (1.17%, 95% CI [0.58, 2.40]%, N = 596; CI of the odd ratio [1.1, 6.2]). Reports of reading problems in childhood among the 6405 students enrolled in the survey were also associated with reporting synesthesia, as in our anecdotal reports. However, not all the results of their large-scale study were consistent with their hypothesis. For example, native speakers of Czech (transparent language) tested in a university in Prague (N = 4790) were more likely to be synesthetes (4.4%) than native speakers of English (opaque language) tested in the Canadian University (2.7%, N = 4003). The authors suggested that this was because more Czechs learned non-native second languages, which they found to be associated with synesthesia. Nevertheless, this does not imply that the proportion of measured Czech-speaking synesthetes would have been lower than that of English-speaking ones if the learning of a non-native second language could have been controlled for (this analysis could not be done in the absence of monolingual Czechs in their study). The possible link between synesthesia and the difficulty of learning is therefore still hypothetical.
1.3. Synesthesia in children as an obstacle to learning?
Whatever the origin of synesthetic associations in children, these associations could lead to learning difficulties because of conflicts in cognitive logic, as explained by synesthete P.M. (see the extract in the beginning of the Introduction). Cognitive interference does exist in adult synesthetes as demonstrated by “synesthetic Stroop” effects (e.g. Ruiz & Hupé 2015). To our knowledge, only three
studies have addressed this question directly in children. Green and Goswami (2008) studied the performance of two 9-year-old grapheme-color synesthetes in a magnitude judgment task. Their performance decreased when the numbers were presented in colors other than the "synesthetic" colors they associated with them. The authors posited the putative effect of synesthesia on the development of mathematical cognition (but see Smees et al. (2019) for a discussion on this issue). Simner and Bain (2018) tested whether there was any interference between synesthesia and cognitive performance (e.g. working memory, receptive vocabulary) in five synesthetes around 10-11 years old. Their performance was not lower than that of the controlled non-synesthetes. They even performed better in some tests than normal controls. In a longitudinal study of 1531 children, Smees et al. (2019) tested the link between children’s oral language skills, as well as their academic self-concept for mathematics and reading, and synesthesia. The children were tested for expressive vocabulary at the age 4-5 years, for expressive vocabulary, receptive vocabulary, sentence comprehension, and academic self-concept at age 10-11 years and for synesthesia at age 12-13. The results showed significant advantages for children who were identified as synesthetes over their peers in both vocabulary and academic self-concept for reading. Interestingly, synesthetes did not show any a priori advantage at age 5 years, which suggests a link between the development of synesthesia and learning performance in children. The latter result therefore suggests a lower proportion of synesthetes in children with learning difficulties, contrary to our hypothesis. Overall, the scarcity of data leaves the question open.
1.4. Approach of the current study
Since few studies so far have examined the hypothesis of a link between synesthesia and learning difficulties, we performed an exploratory analysis by testing for synesthesia a population of children who were receiving speech and language therapy. If synesthesia has a cost during childhood (Green &
Goswami, 2008) or if it is developed when learning is complex (Watson et al., 2014, 2017), one may expect to find more children with synesthesia among those with learning difficulties than those in the general population. We focused on grapheme-color synesthesia because this is the only type of synesthesia for which prevalence estimates of synesthesia exist in children.
2. Methods
2.1. Determination of required sample size
As an exploratory study, we had to decide arbitrarily on the effect size we wanted to test. The aim of the study was not to estimate the exact proportion of synesthetes within our population, i.e. children who received speech and language therapy for difficulties in written language, but only to be able to detect if this proportion was much larger than in the general population. Sample size was determined by practical considerations and simulations. Practically, two students had three months to test children as part of their masters thesis in speech and language therapy. Each student planned to test 50 children. A sample size of 100 would allow the validation of our hypothesis if at least 10% of the tested children had synesthesia. Indeed, if the true proportion of synesthetes in our population was 10%, there is a 95% chance of obtaining a sample including between 5 to 18 synesthetes. Detecting as few as 5 synesthetes (5%) would correspond to an odds ratio of 4 (95% CI [1, 14]) in comparison with the 8/615 (1.3%) synesthetes detected in the reference study (Simner et al. 2009). Such a result would then typically suggest the need to perform a replication study. Detecting between 0 and 4 synesthetes would be compatible with the absence of difference. The end of data acquisition was determined by academic constraints, not by reaching a given number of participants or a predefined outcome, since data analysis was started only after the end of testing.
2.2. Participants
Seventy-nine children aged from 6 to 11 years and 7 months were included in the study. One additional child was tested but excluded because he did not have enough data to be included in analysis (see 2.3. Data analysis). Children were included if they were receiving speech and language therapy for difficulties in written language (67 children for delay in acquisition, 8 children for dyslexia and dysorthographia, 3 children with dyslexia and 1 child with dysorthographia). The study was conducted in accordance with the tenets of the 1964 Helsinki Declaration revised in Edinburgh in 2000 and the ethical guidelines of the Department of Speech and Language Therapy at the University of Lille. Parents received a letter of information about the study. They approved the participation of their child by signing a consent form. The children were informed orally of the procedure and they gave their oral assent to participate in the study.
2.3. Material
We used the grapheme-color consistency test, which is the gold standard used in the literature to identify grapheme-color synesthetes (e.g. Asher et al., 2006, Simner et al., 2006). The test consists in associating each of the letters of the alphabet and each digit with a color from a palette. We chose the 26 letters of the French alphabet, the digits 0-9 and a palette with 12 colors (Appendix B). We used a digital tablet and OpenSesame software (Mathôt, Schreij, & Theeuwes, 2012) to present the stimuli and collect the responses (i.e., the associations made by participants). We also asked the children a series of questions (oral questionnaire, Appendix C) about the strategy they used to probe the existence of synesthetic associations from a phenomenological approach.
We used a procedure similar to that of Simner et al. (2009) to identify synesthesia in children so we could compare the prevalence of synesthetes in our group of children with that in the general population. The procedure is based on synesthetes making constant associations between graphemes and colors, as observed in adult synesthetes who outperform non-synesthetes in surprise retests of associations using the grapheme-color consistency test. Their procedure was as follows. The authors asked children to choose a color for each of 26 letters and 10 numbers presented randomly. The procedure was repeated after a 10-s break. Children who made similar choices significantly more than average were tested the same way one year later. They were considered as synesthetes if their associations were more consistent than average within each of the sessions one year apart and across the two sessions. This procedure makes it possible to take into account the fact that children make fewer associations than adults, and that, unlike with adults, it is not possible to explain to them what synesthesia involves or to ask them to make a list of their associations (Simner et al., 2009).
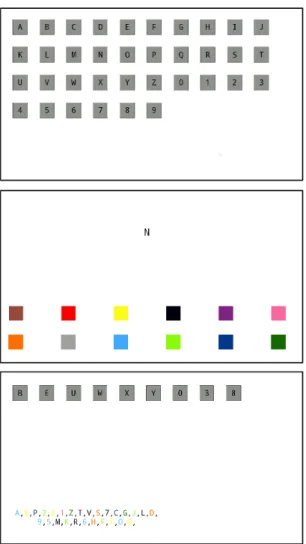
In the current study all children were tested in two sessions, regardless of whether they made more than average constant color-associations in the first session. In each session, we asked them to play a game where they had to associate letters and digits with the palette of colors presented. In the first part of the session, all letters and digits were shown on the screen (Figure 1, top). The children were instructed to choose them one by one, in the order they wanted. The chosen letter or digit appeared in a new window above 12 colored squares (Figure 1, middle). The children were asked to choose the color that "best matched" the selected letter or digit. The layout of the colors changed randomly for each selection. When the color was chosen, the letter or digit disappeared from the list and appeared at the bottom of the window in the color chosen by the child (Figure 1, bottom). The children were told that there was neither a right nor wrong answer and that they could choose the same color several times if they wanted
to. This part ended when a color was assigned to all letters and digits. After a break, they performed an immediate retest. In this part, letters and digits were presented one by one in random order (Figure 1, middle). Session 2 took place at least two weeks after session 1. The existence of session 2 was announced only at the end of session 1 in order to prevent the children from using strategies (e.g. memorizing associations in session 1 to reproduce them in session 2). The procedure was identical to that of the first session. We ended the second session by writing down the responses of the children to the oral questionnaire.
FIGURE 1
2.3. Data analysis
We applied the criteria used by Simner et al. (2009) and in the follow-up study by Simner and Bain (2013).
2.3.1. Cut-off values for the consistency test
In the general population of children, Simner et al. (2009) computed the number of constant associations made by the whole group of children (non-synesthetes included) aged 6 and 7 years (N = 338 and 277, respectively). First, they considered as “potential synesthetes” the children who scored a higher-than-average number of constant associations (upper 2.5% of the distribution, i.e. a score higher than the group mean + 1.96*SD) in the immediate retest (first criterion). Second, they tested potential synesthetes again one year later (N = 47). They considered as synesthetes those who met the following conditions. Children again had to score a significantly higher number of constant associations than their aged-matched pairs in the immediate retest (second criterion). Since the identical associations made in the first session and those in the second session were not necessarily the same, the authors added a third criterion: to be declared synesthetes, children also had to score a higher number of constant
associations across both tests one year apart than those made by the younger group. In their follow-up study (Simner & Bain, 2013), children were tested a third time when they were 10-11 years old. The cut-off values of identical letter-color and digit-color associations to declare a child a synesthete using the above criteria are indicated in Table 1. For example, 6-year-old children had to make at least 6 identical letter-color associations or 3 identical digit-color associations in the three comparisons to qualify as a synesthete.
To apply the above criteria in the current study, we measured the consistency of the associations in the following comparisons: test vs. immediate retest of the first session (Session1Test1–Session1Test2), test vs. immediate retest of the second session (Session2Test1–Session2Test2), test of the first session
vs. test of the second session (Session1Test1–Session2Test1), immediate retest of the first session vs.
immediate retest of the second session (Session1Test2–Session2Test2). Table 1 shows the cut-off values used in the current study. Since we did not have any age-matched reference groups large enough for our children aged between 6 and 11 years old, we used the cut-off values used by Simner et al. (2009) for 6- and 7-year-old children and the cut-off values used by Simner and Bain (2013) for 10- and 11-year-old children. For 8- and 9-year-old children, we used the cut-off values of the 7-year-old children. The condition to declare a child as synesthete was therefore “Session1Test1– Session1Test2 >= cut-off & Session2Test1–Session2Test2 >= cut-off & (Session1Test1– Session2Test1 >= cut-off or Session1Test2–Session2Test2 >= cut-off)”.
Age group Cut-off for identical letter-color associations (/26)
Cut-off for identical digit-color associations (/10)
7-, 8-, 9-year-old 8 4
10-, 11-year-old 10 5
Table 1: Cut-off values in current study for grapheme-color consistency test, applied from Simner et al. (2009) and Simner & Bain (2013).
For 9 tested children (N = 80), the tablet did not save the responses properly in one of the tests. For 8 of them, the number of identical associations in the recorded comparison (Session1Test1–Session1Test2 or Session2Test1–Session2Test2) was lower than the cut-off values, so they could be included as non-synesthetes. Only one child, aged 11 years, had 5 identical associations for digits in Session1Test1– Session1Test2, thus just reaching the threshold for that age. Without the data for Session2Test1– Session2Test2, we could not decide whether he was a synesthete or not, so we had to exclude him from the analysis.
2.3.2. Case of repeated colors
If each of the 12 possible colors were chosen randomly (no color preference), the chance of choosing the same color was 1/12 for each choice. For example, for 7-year-old children, having 8/26 identical choices would correspond to p = .001 and 4/10 identical choices to p = .007. However, these probabilities are not exact because the 12 colors did not have the same probability of being chosen, depending on the children’s color preferences and possible strategies: they might more often select the colors they liked best or might avoid the colors recently selected during the test. In the extreme case where a child would use the same color or only a couple of colors for all associations, a high score of constant associations would be recorded, without indicating synesthesia. Thus, like Simner et al. (2009) and Smees et al. (2019), we tested if above-threshold scores of constant associations were due to choosing the same color repeatedly. Smees et al. (2019) excluded children who chose the same color
“for at least 50% of their consistent graphemes”. In our study, only one child scored above thresholds and used the same color for 100% of his consistent graphemes (see Results).
2.3.3. Questionnaire
A phenomenological report of synesthetic experiences is considered as essential to assess synesthesia (Eagleman, Kagan, Nelson, Sagaram, & Sarma, 2007), in addition to the objective criterion of constant associations. Simner et al (2009) analyzed the responses to a few questions, but they did not use them as a criterion. Smees et al. (2019) did use a phenomenological criterion, but they asked questions different than ours and they tested 12-13 year-old children, i.e. older than in our study. We could not use the responses to our questionnaire to apply a similar criterion. Since the data by Simner et al. (2009) were the only ones we could compare our data with, we did not use any phenomenological criterion. However, since phenomenological data are important, we consider them in the Discussion.
3. Results
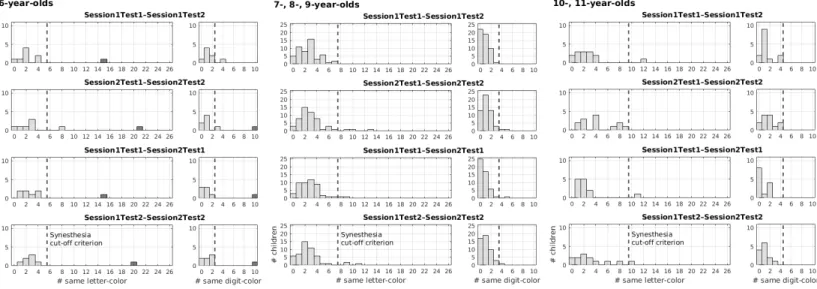
Figure 2 shows the distribution of consistent associations for the four comparisons in the study for each age group and for letters and digits separately. None of the 79 included children qualified as a synesthete. The only child who could qualify based on the cut-offs presented in Table 1 chose the black color for all digits and most letters (Appendix D). If black is excluded, he had no constant association on any of the comparisons and was therefore not considered as a synesthete. The population values compatible with the absence of synesthetes in this group were comprised between 0 and 5.6% (Agresti-Coull method to estimate the 95% confidence interval). There was no ground to reject the null hypothesis of the absence of difference between the group of children tested by Simner et al. (2009) (8 synesthetes among 615 children) and our group of children (Fisher’s exact test, p = 0.61). We applied Bayesian analysis to estimate the likelihood of the null hypothesis. The credible interval was [0, 4.5]%
of synesthetes if using a flat, non-informative prior. If we consider that the proportion of synesthetes in the general population is 1.3 %, as observed in children from the UK (Simner et al., 2009) and in a larger population of adults (1.4%, Simner & Carmichael, 2015), the odds of the null model (no difference between our proportion and 1.3%) over alternative models is 28.5, as computed with a Bayes factor with a flat prior. If we compare directly the absence of synesthetes in our group of 79 children to the 8 synesthetes in the group of 615 children tested by Simner et al. (2009), the Bayes factor is 4.0 against the hypothesis of a higher proportion of synesthetes in our group of children with learning difficulties.
FIGURE 2
4. Discussion
We tested whether the acquisition of grapheme-color synesthesia during childhood was related to difficulties in written language learning. Previous studies suggest two possible links: (1) synesthesia could have a cost for the learner (Green & Goswami, 2008) and thus lead to learning difficulties in children; (2) synesthesia might be developed preferentially in complex learning situations as a strategy to facilitate learning (Watson et al., 2014, 2017). In both cases, synesthetes should be more frequent among children with learning difficulties. This hypothesis was not validated since we did not detect any grapheme-color synesthete among 79 children who had received language therapy for difficulties in written language learning.
4.1. Possible limitations of our results
Our study had limited power given the relatively small size of our sample (N = 79). Our credible interval was therefore quite large, with a synesthete proportion of up to 4.5% of the population of children with learning difficulties being compatible with our sample, meaning up to about three times
more synesthetes than in the general population tested by Simner et al. (2009). Testing larger populations of children with difficulties would narrow down the possibilities. However, the present results do not suggest that pursuing this effort is worthwhile, with Bayes factors clearly in favor of the null hypothesis. For example, had we found 8 synesthetes in a group of 615 children, as did Simner et al. (2009), the Bayes factor in favor of the null hypothesis (against the hypothesis of a higher proportion of children with learning difficulties) would have been only 3.2, while it is 4.0 with our data. Another possible limitation was the impossibility to apply the same criteria as in the study used for comparison (Simner et al. 2009). However, all the small differences reinforce our results. The first difference was the absence of age-matched control groups in our study to determine the cut-off values. We used the values reported by Simner et al. (2009) when available but we did not have any value for 8- and 9-year-old children. We applied the cut-offs for 7-year-old children. Since the number of identical associations increases with age (Simner & Bain, 2013), our criteria were more liberal than “real” cut-offs for children of these age groups, meaning that we could have found more, not fewer synesthetes. A second difference was the shorter interval between our two sessions (2 weeks instead of a year). Again, this could have made children more likely to reach the criteria based on memory rather than synesthesia. A third difference is the difference in language, French vs. English, so the reference value for the comparison might be inadequate. Indeed, Watson et al. (2017) suggested that the proportion of synesthetes varies between people using different languages. Indirect estimates (Chun & Hupé 2013) suggested a proportion of grapheme-color synesthetes in the French adult population of 4.1% (95% CI [2.9, 5.4]%), so if anything, larger than in the UK population. Even though the difference in methodology makes the direct comparison with our observed [0, 4.5] CI very tentative, applying these numbers to French children would indicate that the likelihood of having more synesthetes among those
with learning difficulties would be close to zero. As long as there exists no precise estimate of the proportion of grapheme-color synesthetes among French children, using strict and reproducible criteria, as well as no clear evidence whether proportions differ or not among languages and cultures, there is no rationale for a more precise estimation of the proportion of synesthetes among French children with learning difficulties.
4.2 Specific problems with the identification of synesthesia in children
Most of the few studies investigating synesthesia in children have used test-retest procedures. However, this method was designed for adult synesthetes for whom reporting the synesthetic colors is self-evident, and for whom phenomenological reports typically agree with test-retest results. This might not be the case for children. For example, Simner et al. (2009) identified 8 synesthetes (1.3%) among 615 children using two test-retest sessions, whereas Smees et al. (2019) identified 51 synesthetes (3.3%) among 1531 children combining a single test-retest session with phenomenological responses. This difference corresponds to a Bayes factor of 7.9 in favor of a higher proportion of synesthetes in the
second study. The children in that study were a few years older, but the age difference, rather than methodology, is unlikely to explain the observed difference. Indeed, the prevalence of synesthesia estimated in the adult population using only test-retest procedures is 1.4% (Simner & Carmichael, 2015). The study by Smees et al. (2019) further highlights possible differences between quantitative and phenomenological criteria: these authors had to exclude 344 children (20%) among 1875 because of their “ambiguous status”: These children did not pass the consistency test yet responded like a synesthete on at least two of the three phenomenological questions. On the other hand, among 124 children who passed the consistency test, 73 did not pass the phenomenological test and were not considered as synesthetes.
Therefore, the “true” proportion of synesthetes among children may be difficult to estimate. Multi-sessions of test-retests, as proposed by Simner et al. (2009) and applied in our study, can only provide a conservative lower bound of the estimate. Underestimating the true proportion is problematic when comparing two groups of people, like in our study, if underestimation is large and possibly different in different groups. Underestimation depends on whether children systematically decide or not to use their synesthetic associations in a test-retest procedure. For example, in our tablet tests, a child may “know what the color of a grapheme is” but decide to print it in a different color. This is indeed what may have happened for a child tested by Simner and Bain (2013), who was consistent in her first test-retest session but not in the second one after one year (0% match, so she was then considered as a high-memory non-synesthete), but again in the third session after four years. Her choices were also consistent across all the first tests of the three sessions, justifying her classification as a synesthete. Simner and Bain (2013) reported that she may have been “distracted” in the retest task of the second session, but she may also have decided to choose other colors. An adult synesthete reported to us that a letter printed with the “wrong” color was like a person dressing in someone else’s clothes or trying to disguise themselves. Children may be more likely than adults to experiment this kind of disguise, which may look funny to them. Our method, involving a different procedure for the test and immediate retest, may also have prompted the children to use a different personal rule to “play the game” in the two parts. Thus, test-retest methods may underestimate the number of synesthetes in children.
The responses to the questionnaire collected in the current study allowed us to further explore the underestimation problem. Twenty-four out of 79 children responded positively to questions 2 or 3 (“Do you usually see numbers [letters] with colors in your head?”) and were able to provide at least one example (average = 4.5 examples). However, the examples corresponded to at least one association
made in one of the four tests in only about half the cases (average = 2.4 “correct” examples). Unlike in our experience with adult synesthetes, most responses were ambiguous. For example, three children declared that during the game they had chosen the same colors as in their head (question 4), even though in most cases they never did so. For one of them (9 years old), we had the opportunity to ask him again about the colors of the grapheme examples he provided; he chose different colors and declared he had lied. On the other hand, another child (8 years old) provided very fine descriptions of color associations to numbers (and none for letters), which are typical of synesthetes: “2, green; 3, red; 4, silver with specks; 5, fluorescent green; 6, pink; 7: yellow; eight, golden; 9, light blue; 10, orange”. However, he said that he did not always see these colors, and that he did not choose them for the tests, but instead chose the colors randomly. Indeed, only two of these associations were present in the tests, and only once. Another child (10 years old) proposed two examples of digit-color associations and stated that “1, purple, it’s annoying for example when watching the Tour de France” (where the leading cyclist wears a yellow shirt). For letters, she first responded negatively for letter-color associations (question 4), but then she added “when I focus on a letter, then I see it with a color”. Such spontaneous comments are also quite typical of synesthetes, yet she declared that she had chosen other colors during the test (negative response to question 5), and she never had more than two constant associations for letters or digits in any of the comparisons (and 1 was never purple).
4.3. Ambiguity in determining synesthesia in children: two examples
Two cases in our study demonstrate the difficulty in determining synesthesia in children. We think that these children may qualify as synesthetes even though they did not meet our quantitative criteria.
One 7-year-old girl provided two examples for numbers and seven examples for letters. She said she had magnets on her fridge but that she chose the same colors as the magnets only for some graphemes.
She said that she had chosen the same colors, and indeed she did at least once for all of them. She was also extremely slow and chose colors very carefully. The first test took 15 minutes, and she had to hurry up during the first retest because her grandmother was telling her she was late. This could explain her low scores in Session1Test1–Session1Test2 (3 constant associations for letters and zero for numbers). In the second session (Session2Test1–Session2Test2), however, she had 9 constant letter-color associations and five number-letter-color associations (Figure 3, top), both above the 8 and 4 cut-off values for that age. She also had 5 constant number-color associations for Session1Test1– Session2Test1. In addition, she said she associated colors with days of the week.
A 9-year-old boy declared that he had used the same colors as those he had in his mind, and he did so at least twice for the three examples he provided. He also said that sometimes the color associations changed. He made 13 constant letter-color associations in Session2Test1–Session2Test2, which was the highest score obtained in any comparison in our sample. Remarkably, none of these associations corresponded to the first letter of color names (for example R was brown marron in French, not red
-rouge in French: Figure 3, bottom). He also had 9 constant associations for Session1Test2–
Session2Test2, 7 of them identical to those in Session2Test1–Session2Test2. However, he could not qualify as a synesthete, according to our criteria, because he had only one constant letter-color association for Session1Test1–Session1Test2. We noted, however, that during the first test (Session1Test1), he tried to make words when choosing the letters. This could have distracted him from the matching task he was supposed to do. He also reported associations of personalities to numbers (“2 is a nice girl”), and weather associations for each day of the week.
5. Conclusions
We investigated a putative link between the acquisition of grapheme-color synesthesia and difficulties in written language learning in children. We did not observe any higher prevalence than that expected from studies in the general population of children when using strict quantitative criteria. These criteria estimate only the lower bound of prevalence. By analyzing the literature and the responses of children to questionnaires, we speculated that the true prevalence of grapheme-color synesthesia in children could be rather higher than its lower bound, because children may not have systematically reported their synesthetic colors in our tests. Under this hypothesis, we do not know whether the lower bound of prevalence is a reliable, though biased, estimator of the true prevalence. If not, our results do not rule out the possibility of a higher proportion of synesthetes in children with learning difficulties, if for any (random) reason the children we tested decided to use their synesthetic colors less often than the children in the reference study. However, if this were to be the case, our conclusions would still hold about the unlikelihood of a link between grapheme-color synesthesia and difficulties in written language learning.
Indeed, if synesthetic associations in children are as yet neither frequent nor strong enough to make them choose their synesthetic color systematically when they have the choice, it means that they can hardly be considered as a serious impediment to learning how to read, write and calculate. Therefore, our data still show convincingly that grapheme-color synesthesia has no real cost during written language learning, at least at the group level, in line with the results of Simner and Bain (2013) and Smees et al (2019). These studies even documented better performances in synesthetes, but our study was not designed to determine whether there could be fewer synesthetes in our sample than in the general population. Our results are less conclusive concerning the hypothesis that children may have a
higher incentive to develop synesthetic associations in response to their difficulties (Watson et al., 2014, 2017). If so, however, it is certainly not a systematic strategy, unless if the lower bound of synesthesia prevalence is not only unreliable but utterly uninformative. Since we do not know of any argument justifying such an extreme argument, we conclude that there is no systematic relationship between grapheme-color synesthesia and early-learning challenges concerning written language acquisition. In addition to this direct contribution, our study demonstrates the difficulty to determine synesthesia in children using current methods, which are more adapted to adults (see also Garnier, 2016). Importantly, these difficulties are independent of the sample size and cannot be addressed by testing more children with the same paradigms. The scientific community investigating synesthesia may consider making a coordinated effort to develop new approaches to better measure synesthesia in children. This could involve spending more time with children in different contexts, including at their home, to observe any sign of synesthesia by means of a combination of an observation grid and a semi-structured interview with the children and their parents, in addition to the current methods such as the consistency test. Otherwise, it may be difficult, if not impossible, to further investigate the possible link between synesthesia and learning in a reliable manner, at least on the basis of prevalence studies.
Acknowledgements
We would like to thank all the children who participated in this study and their parents. We are grateful to Camille Rochas and Anne-Claire Simonnet for their valuable help in collecting data. We also thank the speech and language pathologists of the children who participated in this study, Ingrid Gibaru and Maxime Rosito, for their help in preparing the study, and Laurent Ott for his help with the figures. This
paper was supported by the European Center for Humanities and Social Sciences (MESHS-Lille, France) and by the French Ministry of Higher Education, Research and Innovation.
References
Asher, J. E., Aitken, M. R., Farooqi, N., Kurmani, S., & Baron-Cohen, S. (2006). Diagnosing and phenotyping visual synaesthesia: a preliminary evaluation of the revised test of genuineness (TOG-R). Cortex, 42(2), 137-146.
Asher, J. E., Lamb, J. A., Brocklebank, D., Cazier, J. B., Maestrini, E., Addis, L., ... & Monaco, A. P. (2009). A whole-genome scan and fine-mapping linkage study of auditory-visual synesthesia reveals evidence of linkage to chromosomes 2q24, 5q33, 6p12, and 12p12. The American
Journal of Human Genetics, 84(2), 279-285. https://doi.org/10.1016/j.ajhg.2009.01.012
Calkins, M. W. (1893). A statistical study of pseudo-chromesthesia and of mental-forms. American
Journal of Psychology, 5, 439–464.
https://doi.org/10.1016/j.concog.2015.02.001
Chun, C. A., & Hupé, J.-M. (2013). Mirror-touch and ticker tape experiences in synesthesia. Frontiers
in Psychology, 4. https://doi.org/10.3389/fpsyg.2013.00776
Chun, C., & Hupé, J.-M. (2016). Are synesthetes exceptional beyond their synesthetic associations? A systematic comparison of creativity, personality, cognition, and mental imagery in synesthetes and controls. British Journal of Psychology, 107(3), 397-418.
https://doi.org/10.1111/bjop.12146
Eagleman, D. M., Kagan, A. D., Nelson, S. S., Sagaram, D., & Sarma, A. K. (2007). A standardized test battery for the study of synesthesia. Journal of Neuroscience Methods, 159(1), 139-145. https://doi.org/10.1016/j.jneumeth.2006.07.012
Ellis, N. C., Natsume, M., Stavropoulou, K., Hoxhallari, L., Daal, V. H. P., Polyzoe, N., … Petalas, M. (2004). The effects of orthographic depth on learning to read alphabetic, syllabic, and
logographic scripts. Reading Research Quarterly, 39(4), 438-468. https://doi.org/10.1598/RRQ.39.4.5
Forest, T. A., Lichtenfeld, A., Alvarez, B., & Finn, A. S. (2019). Superior learning in synesthetes: Consistent grapheme-color associations facilitate statistical learning. Cognition, 186, 72-81. Galton, F. (1880). Visualised numerals. Nature 21, 252-6.
Garnier, M. M. (2016). La synesthésie chez l'enfant: prévalence, aspects développementaux et cognitifs (Doctoral dissertation, Université Toulouse le Mirail-Toulouse II).
Green, J. A. K., & Goswami, U. (2008). Synesthesia and number cognition in children. Cognition,
106(1), 463-473. https://doi.org/10.1016/j.cognition.2007.01.013
Hubbard, E. M. (2007). Neurophysiology of synesthesia. Current Psychiatry Reports, 9(3), 193-199.
https://doi.org/10.1007/s11920-007-0018-6
Huguenin, C., & Dubois, O. (1999). La Planète des Alphas. Récréalire.
Hupé, J.-M. (2020). «An Introduction to Synesthesia via Vladimir Nabokov». In M. Bouchet, J.
Loison-Charles and I. Poulin (Eds.), The Five Senses in Nabokov's Works, Palgrave Macmillan : Springer Nature Switzerland. ISBN 978-3-030-45405-0.
Hupé, J.-M., & Dojat, M. (2015). A critical review of the neuroimaging literature on synesthesia.
Frontiers in Human Neuroscience, 9. https://doi.org/10.3389/fnhum.2015.00103
Mathôt, S., Schreij, D., & Theeuwes, J. (2012). OpenSesame: An open-source, graphical experiment builder for the social sciences. Behavior Research Methods, 44(2), 314-324.
https://doi.org/10.3758/s13428-011-0168-7
Nabokov, V. (1966). Speak, Memory: An Autobiography Revisited. Reprint (1989), New York: Vintage.
Ruiz, M. J., & Hupé, J.-M. (2015). Assessment of the hemispheric lateralization of grapheme-color synesthesia with Stroop-type tests. PloS one, 10(3).
Simner, J. (2012) Defining synaesthesia. Br J Psychol 103, 1-15.
Simner, J., & Bain, A. E. (2013). A longitudinal study of grapheme-color synesthesia in childhood: 6/7 years to 10/11 years. Frontiers in Human Neuroscience, 7.
Simner, J., & Bain, A. E. (2018). Do children with grapheme-colour synaesthesia show cognitive benefits? British Journal of Psychology, 109, 118-136. https://doi.org/10.1111/bjop.12248
Simner, J. & Carmichael, D. A. Is synaesthesia a dominantly female trait? (2015) Cogn. Neurosci. 6, 68-76
Simner, J., Harrold, J., Creed, H., Monro, L., & Foulkes, L. (2009). Early detection of markers for synaesthesia in childhood populations. Brain, 132(1), 57-64.
https://doi.org/10.1093/brain/awn292
Simner, J., Mulvenna, C., Sagiv, N., Tsakanikos, E., Witherby, S. A., Fraser, C., Scott, K., & Ward, J. (2006). Synaesthesia: The Prevalence of Atypical Cross-Modal Experiences. Perception, 35(8), 1024–1033. https://doi.org/10.1068/p5469
Smees, R., Hughes, J., Carmichael, D. A., & Simner, J. (2019). Learning in colour: children with
grapheme-colour synaesthesia show cognitive benefits in vocabulary and self-evaluated reading.
Philosophical Transactions of the Royal Society B, 374(1787), 20180348.
Ward, J. (2013). Synesthesia. Annual Reviews in Psychology, 64, 49–75. https://doi.org/10.1146/annurev-psych-113011-143840
Watson, M. R., Akins, K., Spiker, C., Crawford, L., & Enns, J. T. (2014). Synesthesia and learning: a critical review and novel theory. Frontiers in Human Neuroscience, 8.
https://doi.org/10.3389/fnhum.2014.00098
Watson, M. R., Chromý, J., Crawford, L., Eagleman, D. M., Enns, J. T., & Akins, K. A. (2017). The prevalence of synaesthesia depends on early language learning. Consciousness and Cognition,
48, 212-231. https://doi.org/10.1016/j.concog.2016.12.004
Witthoft, N., & Winawer, J. (2013). Learning, memory, and synesthesia. Psychol. Sci., 24(3), 258-265. https://doi.org/10.1177/0956797612452573
Figure 1: Presentation screen. Top: initial screen of first test. Middle: example of color selection screen for letter “N”. Bottom: example of screen when first test is in progress. For the immediate retest, only the second screen was shown, letters and numbers being presented in a random order.
Figure 2: Distributions of the number of consistent associations for letters (/26) and digits (/10) for 6-year-old, 7-, 8-, 9-6-year-old, and 10-,11-year-old age groups. The dashed line shows the cut-offs to identify a synesthete, applied from Simner et al. (2009) and Simner & Bain (2013). Session1Test1– Session1Test2: Test vs. immediate retest of the first session. Session2Test1–Session2Test2: Test vs. immediate retest of the second session. Session1Test1–Session2Test1: Test of the first session vs. test of the second session. Session1Test2–Session2Test2: immediate retest of the first session vs. immediate retest of the second session. The dark bin corresponds to the only child who met our quantitative criteria, but by choosing systematically the black color (see Results and Appendix D).
Figure 3: Color choices of two children (top: s62, 7 years old; bottom: s43, 9 years old) who answered positively to our question about letter-color associations. Letters and numbers are printed in bold and italic when the same color was used in a comparison.
Appendix A:
Extracts of email by synesthete P.M. received by author JMH (November 2005) and full extract in French.“My perception of digits as well as their capacity to get along, or even to stand each other, created serious problems of dyscalculia at school, my mathematical logic not following that of my teachers. For example, […] the 5 (light brown) […] is for me clumsy, hypersensitive and even naive, while the 7, feminine, burgundy, stern, poorly tolerant towards weaknesses, cannot stand the 5 (epidermal reaction). […] 7+5 always requires some effort for me to say that they add up to 12 since, in my opinion, they cannot do anything good together. […] Contrary to digits during my school years, letters, with the complex and inexorable code I have forever been attributing to them, helped me a lot during the learning of reading and writing. Some sort of internal signal would tell me the right spelling by a combination of color and compatibility features between letters”.
The underlined passages are those translated in the above paragraph.
“Ma perception des chiffres et leur capacité à s'entendre, voire à se supporter, m'ont posé de gros problèmes scolaires de dyscalculie, ma logique mathématique ne relevant pas de celle de mes profs. Exemples:
- Le 2: vert anis, masculin, fin d'esprit et diplomate, s'entend très bien avec tous les chiffres, plus particulièrement avec le 6 qui lui est féminin, intelligent et sociable rouge vermillon. La sœur aînée du 6 est le 8.
- Le 6 est très tolérant avec le 5 (marron clair) qui pour moi est maladroit, hypersensible voir naïf alors que le 7 féminin rouge bordeaux sévère, autoritaire et peu tolérant envers les faiblesses ne supporte pas le 5 (réaction épidermique).
2 + 6 font donc bien 8 (féminin jaune mâture instruit), mais 7 + 5 me demande toujours un effort pour définir qu'ils font bien 12 car pour moi, ils ne peuvent rien faire de bon ensemble.
J'ai depuis repris confiance au niveau des maths qui m'ont longtemps parus étrangers, mais sitôt que je n'utilise pas une règle mathématique pendant quelques jours, ma propre logique reprend inexorablement sa place avec mon code et les enseignements académiques s'effacent.
Les lettres: idem avec une différence de perception entre les consonnes et les voyelles.
A l'inverse des chiffres pendant ma scolarité, les lettres et le code complexe et inexorable que je leur attribue inconsciemment depuis toujours m'ont beaucoup aidée dans l'apprentissage de la lecture et de l'écriture.
En fait, c'est un peu comme si je n'avais jamais eu besoin de faire le moindre effort pour être lettrée. Bien plus qu'une règle d'orthographe, de grammaire ou de conjugaison, mes sensations intérieures se chargeaient de guider mon stylo vers la bonne écriture ou la bonne prononciation.
Une sorte de signal intérieur m'informait de la bonne orthographe par jeu de couleur, de caractère et de compatibilité des lettres entre elles.
Ma prof de 6e ne comprenait pas que je puisse avoir 0/20 en grammaire et 20/20 en orthographe.
Comme pour les chiffres, les règles académiques en matière de grammaire et d'orthographe ne correspondent pas à mon code personnel.”
Appendix B: Colors used in tests on tablet
RGB color code Color RGB color code Color
Gray (158,158,156) Light green (128,250,6)
Black (2,0,13) Dark green (20,103,0)
Red (248,5,1) Light blue (59,185,255)
Pink (255,99,155) Dark blue (3,51,133)
Orange (255,105,0) Purple (121,32,126)
Appendix C: Questionnaire (translated from French)
1. Do you have or have you had colored letter or number magnets?
If yes: Did you choose the same colors as your magnets during the game? 2. Do you usually see numbers with colors in your head?
If yes: Ask for some examples
3. Do you usually see letters with colors in your head? If yes: Ask for some examples
4. During the game, did you know what color letters and numbers should be? Did you choose the same colors as in your head?
This question was asked only if the responses to Q2 and/or Q3 are “yes”. 5. How did you respond to the tablet game?
6. For you, are numbers like people?
If a child does not understand the question, ask: Can they be nice or angry, or shy? 7. For you, are letters like people?
If a child does not understand the question, ask: Can they be happy or afraid, for example? 8. When you think about the days of the week (Monday, Tuesday, etc), do you imagine them in color, or organized in a particular space?
9. How do you see the numbers in your head? Do you see them in a straight line, or ordered with particular shapes? Do you always see them the same way?
Questions 5 to 9 were exploratory in the event of a huge prevalence of these types of synesthesia in our sample, but we did not verify the accuracy of the reports. Among the 79 children tested, 11 reported associations between days and colors and 5 reported personifications of letters or numbers.
Appendix D
Color choices for the only child who met our quantitative criteria. The color of all constant grapheme-color associations was black in all comparisons (Session1Test1–Session1Test2, Session2Test1–
Session2Test2, Session1Test1–Session2Test1, Session1Test2–Session2Test2). No other identical association was observed.
Author statement
AB: Conceptualization, supervision of data collection, formal analysis, writing. JMH: Conceptualization, methodology, formal analysis, writing.