HAL Id: hal-01685483
https://hal.archives-ouvertes.fr/hal-01685483
Submitted on 29 Apr 2019
HAL is a multi-disciplinary open access
archive for the deposit and dissemination of
sci-entific research documents, whether they are
pub-lished or not. The documents may come from
teaching and research institutions in France or
abroad, or from public or private research centers.
L’archive ouverte pluridisciplinaire HAL, est
destinée au dépôt et à la diffusion de documents
scientifiques de niveau recherche, publiés ou non,
émanant des établissements d’enseignement et de
recherche français ou étrangers, des laboratoires
publics ou privés.
Biomass Growth Rate of Trees from Cameroon Based on
14C Analysis and Growth Models
B Tandoh, F Marzaioli, B Battipaglia, M Capano, S Castaldi, B Lasserre,
Mario Marchetti, I Passariello, F Terrasi, R. Valentini
To cite this version:
B Tandoh, F Marzaioli, B Battipaglia, M Capano, S Castaldi, et al.. Biomass Growth Rate of
Trees from Cameroon Based on 14C Analysis and Growth Models.
Radiocarbon, University of
Arizona, 2013, Proceedings of the 21st International Radiocarbon Conference, 55 (2), pp.885-893.
�10.1017/S0033822200058045�. �hal-01685483�
ANALYSIS AND GROWTH MODELS
J B Tandoh1,2 • F Marzaioli1,3 • G Battipaglia4 • M Capano3,5 • S Castaldi4 • B Lasserre6 • M Marchetti6 • I Passariello5 • F Terrasi1,5 • R Valentini7
ABSTRACT. The question of whether the rise in CO2 levels observed during the industrial era has influenced the rates of tree
biomass growth represents one of the main unsolved questions in the field of climate change science. In this framework, the African tropical forest represents one of the most important carbon (C) sinks, but detailed knowledge of its response to ele-vated CO2 is still lacking, especially regarding tree growth rate estimations. A major limitation to determining growth rates
in the African tropical region is that many trees lack seasonality in cambial activity determining annual growth rings. In this study, several species of trees characterizing the African tropical forest have been investigated to estimate their biomass growth rate by means of a procedure based on 14C and growth models. A total of 71 subsamples were analyzed for a
Entan-drophragma cylindricum (sapele) tree, and 38 and 25 wood subsamples for Erythrophleum suaveolens (tali) and Triplochiton scleroxylon (ayous) trees, respectively, using radiocarbon measurements at the Centre for Isotopic Research on Cultural and Environmental Heritage (CIRCE). All measured modern samples were in agreement with the Southern Hemisphere (SH) 14C
bomb-spike curve. Observed preliminary results indicate a decrease in the growth rate of the sapele tree (~350 yr old) in the industrial period compared to the pre-industrial era. Growth rates for trees of the other 2 species were higher than sapele, with ayous being the fastest-growing species.
INTRODUCTION
The increasing levels of atmospheric CO2 and concerns over future changes in climate have led to attempts to understand the impact of human-induced climatic changes on the C cycle by analyzing the impact of past climate on the pre-industrial C cycle using long-term climatic data sets. The effects, which can be observed from local to global scales, leave imprints on climatic proxies such as tree rings (Fritts 1976; McCarroll and Loader 2004), corals (Druffel 1997; Dunbar and Cole 1999), ocean sediments (Lamoureux and Bradley 1996), pollens, and ice cores (O’Brien et al. 1995). In this study, given their key role of primary productivity in ecosystem structure and function, trees were used to reconstruct the terrestrial ecosystem response to climate change over a period spanning from the pre-industrial to present by comparing growth rate estimates. Tree growth can be defined as an increase in the height, weight, and volume of a species as a result of the formation of new cells (Reimers 1991). The rate of this growth is determined by environmental factors associated with inter- and intra-annual cycles.
For more than a century, tree-ring counting and crossdating have been used in dendrochronology to establish ages of trees and, often, to infer their growth rate. This experimental approach may be lim-ited in environments where regular annual formation of tree rings is suppressed by climatic condi-tions, such as extreme temperature or precipitation regimes with no clearly defined dry season (Worbes 1989). The presence of distinct seasonal changes is the main prerequisite for trees forming growth rings. For this reason, studies in the African tropical equatorial regions providing tree
1Seconda Università di Napoli, Dipartimento di Matematica e Fisica, Caserta, Italy. 2Corresponding author. Email: Joseph.TANDOH@unina2.it.
3INNOVA, Centre for Isotopic Research on Cultural and Environmental Heritage, Caserta, Italy.
4Seconda Università di Napoli, Dipartimento di Scienze e Tecnologie per l’Ambiente la Biologia e la Farmacologia, Caserta,
Italy.
5Seconda Università di Napoli, Dipartimento di Lettere e Beni Culturali, Santa Maria Capua Vetere, Caserta, Italy. 6Università degli Studi del Molise, Dipartimento di Bioscienze e Territorio, Pesche, Isernia, Italy.
J B Tandoh et al.
886
growth rates by means of dendrochronological techniques are scanty (Whitmore 1990). A helpful alternative experimental approach is represented by the determination of radiocarbon content of tree wood, which, when annual growth of rings is not certain, can be used as an independent verification of ring counting (Worbes 1989) or to estimate the synthesis year of the wood.
Recent concentrations of 14C in the atmosphere can be attributed to both natural and anthropogenic activities. On a daily basis, 14C is exchanged between the terrestrial biosphere and the ocean with the atmosphere, making it an active tracer for characterizing fluxes involved in the C cycle. Over differ-ent timescales, the activity of 14C in the atmosphere has been mainly controlled by 4 predominant sources: 1) natural 14C produced by interactions of cosmic rays in the upper atmosphere; 2) 14C introduced into the troposphere due to bomb testing; 3) 14C released by nuclear power plants; and 4) fossil-fuel CO2 emissions (Currie et al. 2006). Since the beginning of nuclear weapons testing in 1955 in the Northern Hemisphere (NH), the 14CO
2 content in the atmosphere has been greatly enriched all over the world from a background level of about 10‰ (14C; Stuiver and Polach 1977) in 1955 to a peak in 1964 (Hua et al. 1999), almost doubling background observed 14C concentra-tions. Since then, bomb 14C spike concentrations have decreased almost exponentially due to terres-trial and oceanic uptake, fossil-fuel dilution, and atmospheric mixing. This behavior provides a high-resolution curve for calibrating modern 14C dates with uncertainty of 1 or 2 yr depending on the measurement year (Hua and Barbetti 2004).
Four bomb 14C data sets have been identified from worldwide measurements for the 1955–1969 periods, identifying 4 characteristic 14C signals for 3 zones of the Northern Hemisphere (NH1, NH2, and NH3) and the Southern Hemisphere zone (SH). These zones are not only influenced by latitudi-nal sources and sinks but also strongly related to atmospheric circulation and seasolatitudi-nal positions of Hadley cell boundaries and the Intertropical Convergence Zone (ITCZ; Hua and Barbetti 2004). One of the consequences of actual climate change on tree growth might be stimulation due to the enrichment of CO2 levels in the atmosphere (CO2 fertilization hypothesis) (LaMarche et al. 1984; Lewis et al. 2004; Cole et al. 2010). LaMarche et al. (1984) reported one of the first pieces of evi-dence of a possible CO2 fertilization effect in tree rings of pines from the southwestern United States. Similarly, Lewis et al. (2004) hypothesized a cause-effect relationship between the increas-ing atmospheric CO2 concentration and the observed increase in growth rates of the Amazon forest over the last few decades. A study on the growth of the aspen trees (Populus sp.) in a forest in Wis-consin (northern US) revealed an average increase of 53% over the past 5 decades in response to a 19.2% rise in ambient CO2 levels (Cole et al. 2010).
Moore et al. (2006) observed a 13–27% increase in the basal area of Pinus taeda growing in Duke Forest, North Carolina (USA), exposed to elevated CO2 for 8 yr. As evidenced by Bortoluzzi (2000), the degree of response of trees to elevated CO2 may vary widely depending on species, growing conditions, nutrient availability, and the duration of the CO2 enrichment, so it is not yet possible to generalize the available observations at a global level.
The effects of rising CO2 concentration on tree growth rates have never been evaluated in the Afri-can continent. To contribute to filling this knowledge gap, the objective of the present study is to test the feasibility of a novel methodology based on 14C measurements and tree-growth model fitting procedures for the estimation of biomass growth rate in trees from the most productive rain forest area in central Africa (in Cameroon). This approach should allow referring growth rates of wood to specific years without the help of ring counting analysis, thereby circumventing the problem of potential false or missing rings, which can be quite common in this geographical area.
MATERIALS AND METHODS Study Site
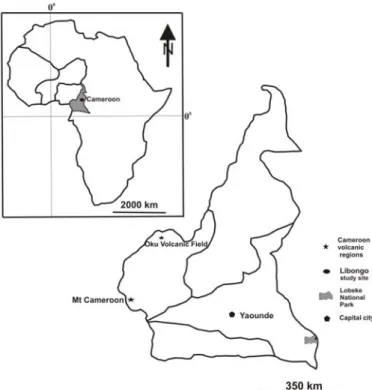
The study site is Libongo (21416N and 16959E), in the eastern part of Lobeke National Park, Cameroon, which shares borders with the Central African Republic and the Republic of the Congo (Figure 1). The park is a semi-evergreen forest covering 2178.54 km2, ranging from 300 to 750 m in altitude above mean sea level and hosting an enormous variety of plants including more than 300 tree species. The park has an annual rainfall averaging 1400 mm, with the dry season occurring from December through February, and an annual average temperature of 24 C (Jell and Machado 2002). In 2010, individual trees of sapele, ayous, and tali were logged and some sections became available for further analyses. Radial subsections were sampled from these sections and used for 14C analysis for growth rate determinations. The total length of each radial subsection from the pith to the cortex was measured to the nearest millimeter, and some samples (see below) were measured for 14C abun-dances (see online Supplementary data).
Wood Sampling Approach
For each radial subsection, slices of about 2 mm in radial thickness were cut for 14C measurements at different distances from the pith. Such sampled radial thickness represents a compromise between the minimum increment obtainable with our sampling instrumentation and the minimum mass of sample guaranteeing good statistics. Our main scope during the wood sampling was the reduction of possible long time periods (i.e. >1 yr) of pooling. Towards the outside of the radius, which was expected to be related to the bomb spike and enriched in modern 14C, the sampling was denser.
J B Tandoh et al.
888
Ayous and tali, respectively, were sampled sequentially from 15.4 to 38.1 cm and 31.9 to 43.8 cm from pith to cortex. Sapele was sequentially sampled from 9.3 to 44.7 cm (Sapele inner series) and 57.5 to 65.4 cm (Sapele outer series) from pith to cortex. Assuming that trees exhibit linear propor-tionality in growth in terms of height and radial increments and that density fluctuations over the tree life can be neglected, the cumulative biomass M(ri) in arbitrary units (a.u.) at a given distance from the pith (ri) is proportional to
(1)
where successive ri represent mean sequential distances from the pith towards the cortex of the sam-ple and ri is the mean radial increment to which mass increments (M(ri)) correspond in the time elapsed (ti) between 2 considered samples. It is worth noting here that even if cumulative biomass is expressed in a.u. its increments exactly match the effective tree increments under the hypothe-sized conditions. In the modeling, we considered measured 14C ages as a function of r
i with the aim to evaluate biomass growth rate (M(ri)/(t)).
Sample Pretreatment and Radiocarbon Measurements
The -cellulose was extracted from wood samples for all tree species using the modified Jayme-Wise method. -cellulose was chosen because of its low mobility in wood, making annual 14C sig-natures possible (Leavitt et al. 1993; Anchukaitis et al. 2008). During the applied procedure, acetic acid, initially used in addition with (NaClO2) to remove lignin (Marzaioli et al. 2005), was replaced by HCl (Capano et al. 2010). The observed cellulose average mass yield of all samples was 39 ± 4.5% (average ± standard error) of the mass of bulk wood sample.
Three to 4 mg of extracted cellulose were oxidized to CO2 via combustion in precleaned quartz tubes with copper oxide in muffle furnace at 920 °C for 6.5 hr. The CO2 was then purified and graph-itized, with Fe catalyst, using Zn and TiH2 reagents in a muffle furnace at 560 °C for 8 hr (Marzaioli et al. 2008). Graphite was pressed into aluminum cathodes for 14C analysis. 14C measurements in this study were performed at the Center for Isotopic Research on the Cultural and Environmental Heritage (CIRCE) using a 3MV tandem accelerator (Terrasi et al. 2008). The 14C/12C isotopic ratio of each sample was corrected for 1) isotopic fractionation using on-line measured 13C/12C, 2) back-ground by means of Aesar zinc-processed fossil graphite, and 3) normalized to the 14C activity of NIST OXII. Control standards (IAEA C3, C5, and C6; Rozanski et al. 1992) were measured to eval-uate the entire procedure (preparation and measurement) accuracy. Measured 14C abundances, for the purposes of this work, will be presented as F14C (Stuiver and Polach 1977) expressed in ‰ units.
Model for Growth Rates Estimation
Figure 2 illustrates the procedure for the estimation of the growth rates of sampled trees. First, 14C measurements of sections of tree cores related to the distance from the pith, via Equation 1, were plotted as a function of the cumulative biomass M(ri) (panel I in Figure 2). F14C values versus bio-mass were attributed to calendar years by means of a sigmoid function (Equation 2) relating the wood biomass to calendar ages (panel II in Figure 2). This sigmoid function with 3 free parameters (, , ) is assumed to reproduce the growth patterns of trees.
(2) M r 2j riri–ri–1 i=1 j
2 riri i=1 j
= M Yr ; e Yr– 2 – 22 ---Yr d – Yr
where determines the maximum estimated biomass potentially fixed by the tree, is the average age of the tree (i.e. the year of fixation of 50% of the asymptotic biomass), is proportional to the slope or growth rate of the tree, and dYr is the time differential.
For any value of the parameters , , and , the (F14C)
meas measured at distance from the pith ri can be related to calendar ages by Equations 1 and 2 ((F14C)
exp) and hence compared to the values in the calibration curve ((F14C)
cal, panel III Figure 2). Then, the function
(with s statistical uncertainty affecting (F14C)
exp) can be minimized by varying , , and , yielding the M(Yr) curve that best fits the experimental data to the calibration curve. This procedure over-comes the problem of multiple solutions in the calibration curve arising from wiggles, the Suess effect, and the bomb spike.
RESULTS AND DISCUSSIONS Radiocarbon Analysis
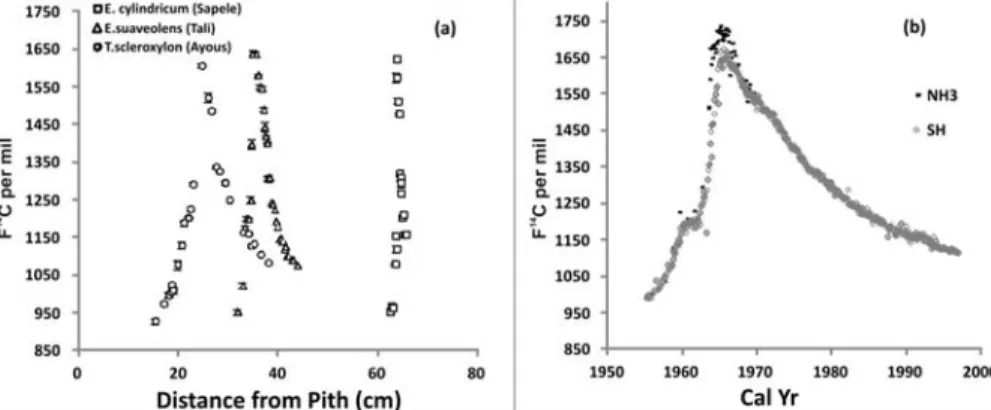
Figure 3a shows the F14C values, in per mil modern carbon, measured for the subsamples from the trees as a function of the distance from the pith, r, in the part most affected by the bomb spike, i.e. close to the cortex. For comparison, Figure 3b shows the SH and NH3 records using the same ver-tical axis scale. In all 3 cases, the maximum experimental value in the bomb-peak region never exceeds 1650‰, contrary to the NH3 curve that exceeds 1650‰ between 1964 and 1967. Even if the horizontal scale in Figure 3a still has to be converted to calendar years (see below), it can be readily seen that our experimental data will be better fitted to the SH record than NH3. For this rea-son, we further considered the SH data set for comparison with our data, assuming that the same
Figure 2 Schematic of the procedure applied for estimation of tree growth rates using 14C
measure-ments and tree growth models. Basically, a) each
14C measurement is plotted versus the cumulative
biomass by means of ri and Equation 1 (panel I);
b) cumulative biomass is related to absolute age by means of a sigmoid function (panel II); c) experimental F14C is compared with the standard
calibration curve and differences minimized by changing sigmoid free parameters (, , and ).
2 F C14 exp–F C14 cal sexp2 ---i=1 n
=J B Tandoh et al.
890
holds also for the pre-bomb period, during which the difference between the 2 records is much smaller (McCormac et al. 2004). The same choice for bomb-spike data on Cameroon trees was done by Worbes et al. (2003), in spite of its geographical position, which according to Hua and Barbetti (2004), should be NH3.
The ITCZ, at site latitudes, migrates north during the NH summer, generating a phase of low precip-itations corresponding to the winter season (end of June to end of September) at the site. ITCZ southern migration instead generates also the SH summer stress (end of December to end of Febru-ary), concentrating most of the photosynthetic activities in the periods corresponding to SH fall (end of March to end of June) and spring (end of September to end of December). Average ITCZ seasonal migration toward northern latitudes makes our site effectively fall under the SH in a period mostly at the end of April to end of October (Waliser 2002).
Given that the sampling of very narrow wood samples in radial sense was aimed mainly to avoid the pooling/averaging of long time periods (see above), the explanation for the agreement of 14C ring data with the SH can be attributed to the fact that the most active period of CO2 fixation by trees is concentrated during the period when the ITCZ migrates toward the NH. The observed data exclude possibilities of mixing between the CO2 ofthe2 hemispheres (NH, SH). This is evident by looking at the bomb-peak values recorded by each individual analyzed. In detail, one should note: 1) mea-sured 14C abundances never exceed the SH bomb-spike peak, as should be in case ofsensitive mix-ing with the NH air; and 2) the NH/SH difference remains sensitive only for few years, compared to examined periods, after 1964 (Figure 3b).
Tree Growth Rates
As explained above, we adjusted the parameters of the biomass vs. year curve for the sapele tree in such a way that the F14C
exp vs. years data fit the SH data set F14Ccal vs. year, in the 13–47 cm and 57.6–65.4 ranges, using the SH pre-bomb (McCormac et al. 2004) and SH bomb spike (Hua and Barbetti 2004), respectively. In particular, the 2 biomass curves were constrained to match the same value at r = 57 cm. This is illustrated in Figure 4, where the experimental data are compared with those expected using the best-fit parameters = 5350, = 1846, and = 104 in the first interval and = 5070, = 1805, and = 187 in the second. The curve labeled fit represents the F14C values of the standard calibration curve obtained from the fit model corresponding to the distances of our measurements. Two anomalous 14C points were observed (circled) in Figure 4. The possibility of these points being outliers was ruled out after a number of repeated measurements yielded the same
Figure 3 a) Radiocarbon F14C values of tree rings as a function of distance from pith in the bomb-spike
results within statistical uncertainties of the measurements. Cameroon is noted for several phases of volcanic activities, which are a source of depleted 14C and can contribute to the presence of these 14C-depleted points. Nevertheless, one cannot confirm with high certainty the probable relation between these points and the phases of volcanic activities in Cameroon; this is a result of the vast distance (>500 km) between our study site and the eruption sites (Figure 1), which is a critical factor that cannot be overlooked in this instance.
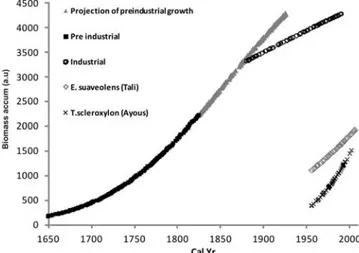
The best-fit biomass vs. cal yr curves are reported in Figure 5. For the sapele species, the slope of the fitted accumulated biomass curve, which represents the growth rate in the first and the second time intervals, is lower for the industrial period compared to the pre-industrial periods. This can be
Figure 4 F14C pre- and post-bomb experimental data for the sapele
cross-section compared with those expected using the best-fit model.
Figure 5 Best fits of growth patterns (in arbitrary units) of the sapele tree in the pre-industrial (squares) and industrial (circles) eras. Also shown are the extrapolation to the industrial era of the pre-industrial growth pattern (trian-gles) and industrial growth patterns for tali (diamonds) and ayous (crosses).
J B Tandoh et al.
892
curve with the post-industrial one fitting the bomb-spike period. It should be stressed here that one might expect slow growth in a young sapling, which tends to increase when it reaches canopy height, and slower growth in maturity. In our modeling, the pre-industrial curve and its projection take into account this effect, so experimental growth rates (referring to the industrial curve) seem to exacerbate the effect of slower growth rates within the tree maturity period. On the other hand, con-sidering the CO2 fertilization effects as argued by many reviews, a faster growth was to be expected in the industrial part of the curve. Nevertheless, no conclusion can be made from these data concern-ing possible CO2 fertilization due to the fundamental absence of significant population sampling. It must be noted that the results presented in this study do not include natural site variability being developed on single specimen analysis. For this reason, in order to draw a significant conclusion about the effect of CO2 on the growth rate one should compare the growth rates estimated on more than 1 individual of the same species and the same age in the 2 different CO2 environments (pre-industrial and industrial) to eliminate any aging effect that would retard the growth rate of trees at maturity. Indi-cated on the same plot are, for comparison, the growth patterns of the other 2 species, tali and ayous, estimated using the model. The mass increment per year in the 2 cases was, in the same arbitrary units employed for the sapele, 16 and 28 yr1, respectively, with sapele showing a value of 8 yr1 for the post-industrial period. This difference could be attributed to a species-dependent growth rate as well as to an age effect, being the tali and ayous trees much younger than the sapele, even if a natural vari-ability effect cannot be excluded. If, on the other hand, we consider the growth rate of the latter in the first phase of growth (7 yr1), this is in any case much lower than the other two. Nevertheless, no definite conclusion can be drawn about the eventual CO2 fertilization effect, which would require analysis of a young sapele tree grown in the industrial era and a number of replicates.
CONCLUSIONS
Aiming to quantify the responses of the African rainforest to the ongoing climate change, trees from Cameroon were analyzed using a methodology that avoids any effects of the presence of false rings. Wood samples from 3 tree species from Cameroon were analyzed using 14C measurements (AMS) at CIRCE from a total of 71 growth rings for Entandrophragma cylindricum (sapele), and 38 and 25 for Erythrophleum suaveolens (tali) and T. scleroxylon (ayous), respectively. A procedure was estab-lished and utilized for estimating the growth patterns of trees (purported not to have discernible annual rings) in the pre-industrial and industrial era. An old Entandrophragma cylindricum (sapele) specimen that dates from the pre-industrial to the industrial era was tested using this procedure. A decrease in the growth rates in the industrial era was observed compared to the pre-industrial era. Although this study has established that the procedure for estimating the effects of CO2 on the growth patterns of trees in the pre-industrial and the industrial era in Cameroon is utilizable and fea-sible, the influence of atmospheric CO2 levels on the growth patterns of the sapele tree species could not be conclusively determined. This is due to the possible effects introduced in the growth of trees by aging factor. Of course, this hypothesis should be verified on a significant sample of the popula-tions of the tree. The authors believe that a comparison between pre- and post-industrial growth rates will require younger and older trees of the same species growing in the environment exposed to different CO2 levels. This will eliminate any rate of growth introduced by the age of tree.
ACKNOWLEDGMENTS
This work was supported by European Research Council (ERC) grant 247349 Africa GHG. The authors are very grateful to Dr Simona Altieri for her enormous help during the sampling and prep-aration of wood samples, and to the referees whose suggestions helped improve the text.
REFERENCES
Anchukaitis KJ, Evans MN, Wheelwright NT, Schrag DP. 2008. Isotope chronology and climate signal cali-bration in neotropical cloud forest trees. Journal of Geophysical Research 113: G03030, doi:10.1029/ 2007JG000613.
Bortoluzzi B. 2000. Review of recent forest research projects on climate change and CO2 concentration in
Europe. European Forest Institute, Internal Report 1. Cole CT, Anderson JE, Lindroth RL, Waller DM. 2010.
Rising concentrations of atmospheric CO2 have
in-creased growth in natural stands of quaking aspen (Populus tremuloides). Global Change Biology 16(8): 2186–97.
Capano M, Marzaioli F, Sirignano C, Altieri S, Lubritto C, D’Onofrio C, Terrasi F. 2010. 14C AMS
measure-ments in tree rings to estimate local fossil CO2 in
Bosco Fontana forest (Mantova, Italy). Nuclear In-struments and Methods in Physics Research B 268(7– 8):1113–6.
Currie K, Brailsford G, Nichol S, Gomez A, Riedel K, Sparks R, Lassey K. 2006. 14CO
2 in the Southern
Hemisphere atmosphere – the rise and the fall. Chem-istry in New Zealand 70(1):20–2.
Dunbar RB, Cole JE. 1999. Annual Records of Tropical Systems (ARTS), recommendations for research: Summary of scientific priorities and implementation strategies. Bern, Switzerland. PAGES workshop re-port 1999–1. 72 p.
Druffel ERM. 1997. Geochemistry of corals: proxies of past ocean chemistry, ocean circulation, and climate. Proceedings of the National Academy of Sciences of the USA 94(16):8354–61.
Fritts HC. 1976. Tree Rings and Climate. New York: Ac-ademic Press.
Hua Q, Barbetti M. 2004. Review of tropospheric bomb
14C data for carbon cycle modeling and age calibration
purposes. Radiocarbon 46(3):1273–98.
Hua Q, Barbetti M, Worbes M, Head J, Levchenko VA. 1999. Review of radiocarbon data from atmospheric and tree ring samples for the period 1950–1977. IAWA Journal 20(3):261–84.
Jell B, Machado JS. 2002. Collaborative management in the region of Lobeke, Cameroon: the potentials and constraints in involving the local population in pro-tected area management. Nomadic Peoples 6:180–203. LaMarche VC, Graybill DA, Fritts HC, Rose MR. 1984. Increasing atmospheric carbon dioxide: tree ring evi-dence for growth enhancement in natural vegetation. Science 225(4666):1019–21.
Lamoureux SF, Bradley RS. 1996. A 3300-year varved sediment record of environmental change from north-ern Ellesmere Island, Canada. Journal of Paleolimnol-ogy 16:239–55.
Leavitt SW. 1993. Seasonal 13C/12C changes in tree rings:
species and site coherence, and a possible drought
in-210–8.
Lewis SL, Phillips OL, Baker TR, Lloyd J, Malhi Y, Almeida S, et al. 2004. Concerted changes in tropical forest structure and dynamics: evidence from 50 South American long-term plots. Philosophical Transactions of the Royal Society B 359:421–6. Marzaioli F, Lubritto C, Battipaglia G, Passariello I,
Rubi-no M, Rogalla D. 2005. Reconstruction of past CO2
concentration at a natural CO2 vent site using
radiocar-bon dating of tree rings. Radiocarradiocar-bon 47(2):257–63. Marzaioli F, Borriello G, Passariello I, Lubritto C, De
Ce-sare N, D’Onofrio A, Terrasi F. 2008. Zinc reduction as an alternative method for AMS radiocarbon dating: process optimization at CIRCE. Radiocarbon 50(1): 139–49.
McCormac FG, Hogg AG, Blackwell PG, Buck CE, Higham TFG, Reimer PJ. 2004. SHCal04 Southern Hemisphere calibration, 011.0 cal kyr BP. Radiocar-bon 46(3):1087–92.
McCarroll D, Loader NJ. 2004. Stable isotopes in tree rings. Quaternary Science Reviews 23(7–8):771–801. Moore DJP, Aref S, Ho RM, Pippen JS, Hamilton JG, De Lucia EH. 2006. Annual basal area increment and growth duration of Pinus taeda in response to eight years of free-air carbon dioxide enrichment. Global Change Biology 12(8):1367–77.
O’Brien SR, Mayewski PA, Meeker LD, Meese DA, Twickler MS, Whitlow SI. 1995. Complexity of Ho-locene climate as reconstructed from a Greenland ice core. Science 270(5244):1962–4.
Reimers NF. 1991. The Popular Biological Dictionary. Moscow: Nauka. 544 p. In Russian.
Rozanski K, Stichler W, Gonfiantini R, Scott EM, Beu-kens RP, Kromer B, van der Plicht J. 1992. The IAEA
14C Intercomparison exercise 1990. Radiocarbon
34(3):506–19.
Stuiver M, Polach HA. 1977. Discussion: reporting of
14C data. Radiocarbon 19(3):355–63.
Terrasi F, De Cesare N, D’Onofrio A, Lubritto C, Marza-ioli F, Passariello I, Rogalla D, Sabbarese C, Borriello G, Casa C, Palmieri A. 2008. High precision 14C AMS
at CIRCE. Nuclear Instruments and Methods in Phys-ics Research B 266(10):2221–4.
Waliser DE. 2002. Tropical meteorology: Intertropical convergence zones (ITCZ). In: Holdon J, Pyle J, Curry J, editors. Encyclopedia of Atmospheric Sciences. New York: Academic Press.
Whitmore TC. 1990. An Introduction to Tropical Rain Forests. Oxford: Clarendon Press.
Worbes M. 1989. Growth rings, increment and age of trees in inundation forests, savannas and a mountain forest in the Neotropics. IAWA Bulletin 10:109–22. Worbes M, Staschel R, Roloff A, Junk WJ. 2003. Tree
ring analysis reveals age structure, dynamics and wood production of a natural forest stand in