HAL Id: hal-00317135
https://hal.archives-ouvertes.fr/hal-00317135
Submitted on 1 Jan 2003
HAL is a multi-disciplinary open access
archive for the deposit and dissemination of
sci-entific research documents, whether they are
pub-lished or not. The documents may come from
teaching and research institutions in France or
abroad, or from public or private research centers.
L’archive ouverte pluridisciplinaire HAL, est
destinée au dépôt et à la diffusion de documents
scientifiques de niveau recherche, publiés ou non,
émanant des établissements d’enseignement et de
recherche français ou étrangers, des laboratoires
publics ou privés.
Low- and high-frequency spectral behavior of cosmic-ray
intensity for the period 1953?1996
H. Mavromichalaki, P. Preka-Papadema, B. Petropoulos, I. Tsagouri, S.
Georgakopoulos, J. Polygiannakis
To cite this version:
H. Mavromichalaki, P. Preka-Papadema, B. Petropoulos, I. Tsagouri, S. Georgakopoulos, et al..
Low-and high-frequency spectral behavior of cosmic-ray intensity for the period 1953?1996. Annales
Geo-physicae, European Geosciences Union, 2003, 21 (8), pp.1681-1689. �hal-00317135�
Annales Geophysicae (2003) 21: 1681–1689 c European Geosciences Union 2003
Annales
Geophysicae
Low- and high-frequency spectral behavior of cosmic-ray intensity
for the period 1953–1996
H. Mavromichalaki1, P. Preka-Papadema2, B. Petropoulos3, I. Tsagouri1, S. Georgakopoulos1, and J. Polygiannakis2
1Nuclear and Particle Physics Sect., Physics Dept., University of Athens, Panepistimiopolis Zografos, 15783 Athens, Greece 2Section of Astrophysics, Astronomy and Mechanics, Physics Dept., University of Athens, Panepistimiopolis Zografos,
15783 Athens, Greece
3Research Center for Astronomy and Applied Mathematics, Academy of Athens, 14 Anagnostopoulou str., 10673 Athens,
Greece
Received: 27 August 2002 – Revised: 23 January 2003 – Accepted: 16 February 2003
Abstract. A study of the cosmic-ray intensity power
spec-trum using the Climax Neutron Monitor data in the frequency range from 10−9Hz to 10−7Hz (which corresponds to peri-odicities from 11 years to a few months) during the period 1953–1996, was carried out by means of the successive ap-proximations method of analysis and was compared against the power spectrum and the maximum entropy methods. The contributions of the time evolution of several peaks to the global one were obtained. Except for the well-known 11-year and the 1-year variations, peaks at 7.7, 5.5, 2 and 1.7 years are found. Several peaks with periods less than 10 months have appeared in our analysis, while the occurrence of 5.1 months is obtained in all the examined solar cycles with a strong signature in cycle 21. Transitions of these quasi-periodicities are seen in power spectra plots. Some of them can be attributed to the modulation of the cosmic ray inten-sity by solar activity. Others are sporadic and have been pre-viously attributed to the interplanetary magnetic field. The results obtained support once again the argument regarding the difference in the solar activity between odd and even so-lar cycles.
Key words. Interplanetary physics (Cosmic rays,
Interplan-etary magnetic fields)
1 Introduction
The transport of cosmic rays (CR) from the edges of the heliosphere to the vicinity of the Earth is greatly influ-enced by the interplanetary magnetic field (IMF) structure. On the other hand, the IMF status is determined by the different solar activity manifestations. Thus, the study of cosmic-ray variations provides an opportunity to derive the three-dimensional configuration of the interplanetary mag-netic field in the heliosphere in connection with the contribu-tion of the off-ecliptic in situ measurements (Exarchos and
Correspondence to: H. Mavromichalaki
(emavromi@cc.uoa.gr)
Moussas, 1999; Heber and Marsden, 2001, etc.). Hence, a detailed analysis of the time series of cosmic-ray intensity observations at the Earth and particularly their spectral char-acteristics in various frequency domains is important for de-termining both the large- and small-scale behavior of mag-netic fields in the heliosphere.
At the low frequency end of the spectrum the dominant quasi-periodic variations in cosmic-ray intensity observed in the time scales of 11 and 22 years (Venkatesan and Badrud-din, 1990; Mavromichalaki et al., 1998) have been attributed to solar activity and magnetic polarity reversal cycles, re-spectively. At higher frequencies the diurnal variation (T = 1 day) is dominant and is caused by corotation of cosmic-ray particles in the interplanetary magnetic field (Axford, 1965; Mavromichalaki, 1989). Within these two extreme frequency ranges a wide range of frequencies of cosmic-ray intensity variations exists, although a clear, stable and selective peri-odicity has not been established so far.
Several authors have studied the frequency distribution of the cosmic-ray intensity fluctuations. The power spectral density (PSD) analysis of the cosmic-ray intensity recorded at ground level by polar and non-polar stations has indicated in the frequency range 10−6−10−4Hz (1 cycle/4 months –1 cycle/3 hours) a predominant component of the type f2, with indications of a change below 5 × 10⁻⁷Hz. Kudela et al. (1991) noted that there are two distinct regions of cosmic-ray periods with respect to the underlying physical mechanisms, and that the barrier between them is located around 20 months. The large-scale variations are caused by the solar dynamics, whereas transient effects in the in-terplanetary space cause the short-scale variations. The last ones are consistent with the fact that the short time periods have a different probability of occurrence in different epochs (Xanthakis et al., 1989). Valdes-Galicia, Perez-Enriquez and Otaola (1996) and Valdes-Galicia and Mendoza (1998) have reported on a short-time variation of 1.68 year in the cosmic-ray intensity observed at the Earth at neutron monitor ener-gies (several GeV). They proposed that this cosmic-ray vari-ation might appear as a consequence of phenomena rooted in
1682 H. Mavromichalaki et al.: Low- and high-frequency spectral behavior of cosmic-ray intensity the solar interior and could help in understanding the origin
of the solar magnetic cycle. Recently, Kudela et al. (2002) presented wavelet transform results from daily averages of the nucleonic intensity recorded by Neutron Monitors at four different cut off rigidities over a period up to four solar cy-cles and described the power spectral density temporal evo-lution at three periodicities, namely 150–160 days, 1.3 year and 1.7 year.
It is interesting to note that the established 1.7-year vari-ation of cosmic-rays has also appeared at the top of flare-producing regions for the period 1972–1989 (McIntosh, 1992), as well as in the long duration event (LDE)-type of flares which precede the formation of coronal holes during the 20th and 21st cycles (Antalov`a, 1994; Mavromichalaki et al., 2000).
In this work, a study of the cosmic-ray power spectral den-sity in the frequency range from 10−9 to 10−7Hz (1 cy-cle/30 years – 1 cycle/4 months) is presented. The cosmic-ray intensity data were obtained from Climax Neutron Mon-itor station for the period 1953–1996, i.e. four solar cycles (19–22). Three independent spectral methods have been em-ployed in the analysis of this time series in order to detect pe-riodicities. The behavior of spectral characteristics in differ-ent ranges of periodicities, covering months to several years and the possible solar origin of the presented peaks in the calculated spectra are discussed.
2 Data analysis
The pressure-corrected monthly averages of the cosmic-ray intensity recorded by the Climax Neutron Monitor Station (cut off rigidity 2.96 GV) for the time interval 1953–1996 are used. The advantage is that this data set is obtained from the same station and so there is not a different rigidity response to the cosmic-ray flux. So, the cosmic ray intensity variations will be always the same quantitatively (Moraal, 1976).
The integrated cosmic ray intensity over the period 1953– 1996 is shown in the upper panel of Fig. 1. The values are normalized with respect to the maximum intensity level reached in May 1965 corresponding to zero and with respect to the minimum intensity level reached in June 1991 taken to be equal to 1.00. Using this technique the cosmic ray in-tensity data are inverted without consequences for our analy-sis. This is a common normalization scheme for cosmic ray time series, in order to have a direct agreement with the solar activity cycles, since the cosmic-ray intensity variations are anti-corrrelated with solar activity (Forbush, 1958).
In order to investigate variations in the constructed time series we have used the following spectral techniques:
(a) Method of successive approximations (SA) – time-phase domain;
(b) Power spectral analysis (PSA) according to the Black-man and Tuckey approximation frequency domain and, (c) Maximum entropy method (MEM) of analysis.
Fig. 1. Monthly normalized cosmic-ray intensity values obtained
from the Climax Neutron Monitor Station over the period 1953-1996 are presented in the upper panel. By applying the SA method on this time-series the quasi-periods of about 11, 5.5, 2, 1.7, 1-years and 8, 6, 4 and 3 months are obtained. The start-end sine segments of each quasi-sine wave are presented in the lower panel. The spec-trum obtained from the SA application to these data, analogous to the wavelet transform method, is given in the middle panel. The
gray scale corresponds to the amplitude (ai) distribution varying
from −0.7 (white color) to 1.0 (black color).
2.1 Successive approximations method
By applying the technique of de-trending time series by trigonometric series we have investigated the cosmic-ray in-tensity variations in a wide range of periodicities from three months to eleven years. According to this technique of suc-cessive approximations (SA) the amplitude and the position of each variation are computed, expressing them analytically. This method was introduced by Xanthakis et al. (1989), in order to study cosmic-ray time series from various Neutron Monitor stations. Several periodical sinusoidal waves are ap-plied on the observed time series to reproduce them. The am-plitude and phase of these waves are obtained by successive fittings on the data set. It can also be used for non-continuous functions. The software for the application of this method to the time series has been developed by Liritzis et al. (1999) and was used in the present study. If ϕi and ϕi+1denote the
start and the end time of each sinusoidal wave to be fitted, in each step of the procedure, the calculated values of the cosmic-ray intensity (Ical) is given by the equation:
Ical=ao+
X
H. Mavromichalaki et al.: Low- and high-frequency spectral behavior of cosmic-ray intensity 1683
Table 1. Synoptic results of the cosmic-ray intensity spectral analysis for the time interval 1953–1996
Cosmic Ray Periodicities (1953–1996)
Power spectrum Successive Xanthakis’s
analysis Approximations Method Maximum Entropy
(Blackman-Tuckey) (91%) (1964–1985) Analysis (99.5%) (99%) F =250 11.25 y 10.80 y 10.50 y 10.41 y 10.40 y 9.20 y 7.20 y 8.41 y 7.70 y 5.40 y 5.80 y 5.50 y 5.34 y 4.20 y 3.97 y 1.90 y 2.00 y 1.90 y 1.70 y 1.70 y 1.70 y 1.00 y 1.00 y 1.00 y 1.00 y 10.00 m 8.70 m 9.10 m 8.00 m 8.00 m 8.40 m 6.60 m 6.00 m 6.00 m 7.10 m 5.10 m 5.20 m 4.00 m 4.50 m 4.00 m 2.80 m 3.00 m 3.00 m where ϕi < t < ϕi+1
a0is the constant shift of the curve,
ai is the amplitude of the i-sinusoidal curve and,
Tiis the it hperiodicity.
Successive results of this technique applied on the cosmic-ray time series for the time interval 1953–1996 are illustrated in the Fig. 2. The computed values are subtracted from the observed ones and the time series of residuals has been fit-ted by a similar relation, in order to identify medium quasi-periods and produce new residuals. The last one has been fitted by an analogous relation to identify the smaller quasi-periods and the final residuals. The last calculated time se-ries (Ical) summarizes all the previous results. The standard
deviation, as well as the accuracy of our computations, is checked step-by-step, insuring the validity of our results, and the degrees of freedom suggest that the parameters used in these expressions would be less than the half of the num-ber of measurements. From our analysis the quasi-periods about 11, 5–4, 2, 1.7, 1 years and 8, 6, 4 and 3 months are obtained (Table 1). The standard deviation is equal to 0.27 and the corresponding accuracy between observed and calcu-lated values is 91% with 126 degrees of freedom. The start-end sine segments of each quasi-sine wave fitting, as derived from the successive approximations method (see Eq. 1) is presented in the lower panel of Fig. 1. The amplitudes ai, for
the corresponding fitting components are additionally given
in a gray scale in the middle panel of the same figure. This technique of analysis is a power spectrum analogous to that one of the wavelet transform method. Long- and short-term quasi-periodicities shown in the lower panel of Fig. 1 are sep-arated by a limit of about 1.7 years (Xanthakis et al., 1989; Kudela et al., 1991). It is clear that the long-term period-icities have appeared with higher amplitude than that of the short-term ones (see middle panel of Fig. 1).
The same technique of analysis during each solar cycle separately gives some more interesting results shown in Ta-ble 2. Short-term periodicities (< 2 years) appear sporadi-cally and with small amplitude during the four cycles. Xan-thakis et al. (1989) has noted that these are periods with a different probability of appearance in different epochs. How-ever there are two distinct time intervals in the declining phase of the cycles 19 and 22, where the periods of 3, 4, 6, 8 months and 1 year are not appearing (lower panel of Fig. 1). Obtained results seem to be related to the even and odd cycles activity (Mavromichalaki et al., 1997; Mendoza et al., 1999), The 11-year periodicity appears as a peak at 10.5 years for cycles 19 and 21, as 11.25 years for cycle 20 and 9.20 years for cycle 22. The periodicity of 5.8 years is obtained in cycles 19 and 21, with 4.2 years in cycles 20 and 22. Possibly these results are connected with the 22-year so-lar cycle and the magnetic poso-larity of the Sun. The periods of 4 m and 6 m correspond to the well-known periodicity of 154 d, indicated in many solar parameters (Rieger et al., 1984).
1684 H. Mavromichalaki et al.: Low- and high-frequency spectral behavior of cosmic-ray intensity ig. 2 Fig. 2 0 0.2 0.4 0.6 0.8 1 1.2 1 121 241 361 481 Ye ars C o sm ic R ay I n te n sit y ( % ) Climax NM 64 1s t approx. 1953 1963 1973 1983 1993 (a) 0 0.2 0.4 0.6 0.8 1 1.2 1 121 241 361 481 Ye ars Cos m ic Ra y I n te n si ty ( % ) Climax NM 64 final approx. 1953 1963 1973 1983 1993 (b) -0.4 -0.2 0 0.2 0.4 0 120 240 360 480 Ye ars R e si dua ls 1953 1963 1973 1983 1993 (c)
Fig. 2. Time evolution of the cosmic-ray intensity according to the
Successive Approximations technique. In the upper two panels the time-series produced by the analytical expressions given from the Eq. (1) compared with the observed ones (continuous line) are pre-sented for the first and final approximation, respectively). The final residuals between observed and calculated cosmic-ray values are given in the lower panel with an accuracy 91%.
As it is obvious from Fig. 1 (lower panel) the 1-year period-icity caused by the Earth’s rotation is obtained in cycles 20 and 21 and sporadically in cycles 19 and 22. Moreover the period of 1.7 years (20 m) has appeared in cycles 19 (except of the maximum phase) and 22, as well as in the declining mode of cycle 21 and only around the maximum of cycle 20. It is extended to 2 years in the ascending mode of cycle 19. It is noted that the quasi-periods of 4 m, 6 m and 1.7 years are the most predominant peaks in all the cycles. This last point is in agreement with the recent results of Kudela et al. (2002), using the wavelet transform technique of analysis.
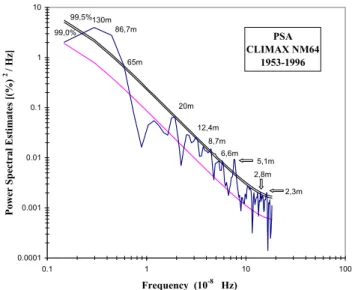
Fig.3 PSA CLIMAX NM64 1953-1996 0.0001 0.001 0.01 0.1 1 10 0.1 1 10 100 Frequency (10-8 Hz) Power S p ectral E sti mates [(%) 2 / Hz ] 99,5% 99,0% 130m 86,7m 65m 20m 12,4m 8,7m 6,6m 5,1m 2,8m 2,3m
Fig. 3. Power density distribution derived from the monthly mean of
the cosmic-ray intensity as a function of frequency 10−9–10−6Hz
is presented for the interval 1953–1996. The power density is
ex-pressed in percent2/Hz. Peaks with a significant level greater than
99.5% are indicated.
2.2 Power spectrum
In order to confirm possible systematic quasi-periodic vari-ations obtained by the method of Successive Approxima-tions, a Blackman and Tuckey (1959) power spectrum anal-ysis (PSA) was carried out. The obtained power (variance) spectrum was derived from Fourrier transforming the auto-correlation functions of the time series, which were truncated in various lags. If the spectrum represents a random sample from a normal population, the sample spectrum estimates at a given frequency are distributed about the corresponding pop-ulation, divided by the equivalent degrees of freedom. The maximum lag may not be over the number of values divided by the number 3 (Blackman and Tuckey, 1959).
The power spectrum method is based on the estimation of the significant periods over several confidence levels ac-cording to an x2 distribution. For this purpose the spectral estimates and the red noise curve, corresponding to the back-ground level, is computed for every frequency. The confi-dence levels are computed by multiplying the red noise curve values by the confidence coefficients which denote that a nor-mally distributed statistic can be found between the limits
±1.96σ , ±2.58σ , etc., (σ is the standard deviation) for the confidence levels of 95%, 99%, etc., respectively. If one peak (i.e. spectral estimates value) is larger than the correspond-ing confidence level value, it is considered as a significant peak and gives a significant frequency or period for this con-fidence level.
This method applied to the monthly mean averages of cosmic-ray intensity over the interval 1953–1996 is pre-sented in Fig. 3. Peaks with a confidence level greater than or equal to 99.5% are present at 130, 86.7, 65, 20, 12.4, 8.7, 6.6, 5.1 and 2.8 months. A network of periodicities
rang-H. Mavromichalaki et al.: Low- and high-frequency spectral behavior of cosmic-ray intensity 1685 ing from 130 to 65 months with a significance level >99.5%
has appeared in which the periodicities of 130 and 86.7 m are more distinguished, while the peak of 65 m is not easily well-recognized. It is noticeable that there is a change in the spectrum slope below the period of 20 months, which is also reported by Kudela et al. (1991).
One of the main features of this spectrum is a 5.1 m vari-ation that seems to be the most remarkable peak after that of the 130 months (11 years). The contribution of the time evo-lution of the quasi-periodic cosmic-ray signal of 5.1m (154d) to the cosmic-ray intensity profile has also been noted by Kudela et al. (2002). The Earth’s rotation period (1 year) causes a seasonal cosmic-ray variation (Forbush, 1958).
Going a step further we calculated the PSD of cosmic ray intensity during each solar cycle separately. The period of 20 months has appeared in all the cycles with a significant level >95%, except for cycle 19. This peak is obtained with a significant level of 99% in cycle 22 (Fig. 4). The peak of 5.1 months is present in all cycles with a strong appearance in cycle 21. Valdes-Galicia et al. (1996) and Mavromicha-laki et al. (2002) have already reported that the cosmic ray fluctuation of 5.1 m has appeared in cosmic-ray intensity at the maximum phase only of cycle 21 and not of cycle 20, while for earlier (and later) cycles and periods the evidence is contradictory. The evidence for this periodicity (154 days) in flare-related data is convincing for the interval 1978–1983 of the cycle 21. It seems that this fluctuation observed in cycle 21 is a deep-seated characteristic of solar activity and not a random transient effect and its amplitude varies greatly from cycle to cycle. El-Borie and Al-Thoyaid (2002) noticed that the cosmic-ray power spectra of solar maxima for the cycles 20 and 22 are much harder than the ones of cycle 21 in the frequency range 10−8–10−6Hz. At lower frequencies
they remarked that the cosmic-ray intensity power spectra exhibited a complex structure for different epochs. Kudela et al. (1991) showed that the power spectrum at periodici-ties corresponding to several months (3–6 months) appear to exhibit a dependence on the 22-year periodicity caused by the recurrence of reversal of solar magnetic fields. A narrow peak at 2.1 m is also found in all cycles (Fig. 4), but it is not accepted as the data resolution is of one month only. Valdes-Galicia et al. (1999) have also reported this variation around 60 to 66 days for the period 1992–1998.
2.3 Maximum entropy
Given our primary interest in investigating periodicities in the constructed time series, especially in the range of 1–2 years and the search for its possible solar origins, an ad-ditional technique of time series analysis called the maxi-mum entropy method (MEM) has been used to calculate the PSD of our data presented in the upper panel of Fig. 1. This method is better than other spectral techniques to resolve dif-ferent frequency peaks (Ulryich and Bishop, 1975; Kudela et al., 1991; Valdes-Galicia et al., 1996). Algorithms for per-forming the MEM analysis were based on the algorithm de-veloped by Burg (1967). The duality between the maximum
Fig. 4
Fig. 4
Fig. 4
Fig. 4
PSA CLIM AX 19th SOLAR CYCLE 0 1 2 0 6 12 18 P o w e r s p ec tr al d e n si ty (( % ) 2 /H z ) 99% 100m 7.7m 5.1m 3.1m 2.4m 95% 12.5m 3.8m PSA CLIM AX 20th SOLAR CYCLE 0 1 0 6 12 18 P o w e r s p ec tr al d e n si ty ((% ) 2 /H z ) 99% 2.1m 95% 5.5m 7.7m 100m 20m 4.3m 2.9m 3.1m 12.5m PSA CLIM AX 21s t SOLAR CYCLE 0 1 0 6 12 18 P o w e r s p ec tr al d e n si ty (( % ) 2 /H z ) 95% 12.5m 5m 3.1m 2.6m 2.1m 99% 100m 20m 7.1m PSA CLIM AX 22nd SOLAR CYCLE 0 1 2 3 4 5 0 6 12 18 Frequency (10-8 Hz) P o w e r sp ect ra l de ns it y ( (% ) 2 /H z ) 99% 20m 5m 3.4m 2.7m 2.2m 95% 10m 7.1mFig. 4. The cosmic-ray power spectrum according to Blackman and
Tuckey (1959) method for each solar cycle (19–22) is presented.
The power density is expressed in percent2/Hz. Peaks with a
signif-icant level greater than 95% are indicated.
entropy method and the autoregressive representation of the data allows for the application of autoregressive (AR) analy-sis to obviate some shortcomings of the MEM method. The method exhibits higher spectral resolution than other spectral estimators, yet the issue is to define the best filter length in order to avoid oversampling (too long filter) and undersam-pling (too short filter) the underlying spectrum of the data. The expansion coefficients for the maximum entropy
spec-1686 H. Mavromichalaki et al.: Low- and high-frequency spectral behavior of cosmic-ray intensity Fig. 5 MEM Climax 1953-1996 0.0001 0.001 0.01 0.1 0.25 0.55 0.85 1.15 1.45 1.75 2.05 2.35 Frequency (10-8Hz) Spectral Density [(%) 2 /Hz] 20,3 m 16,6 125 m 92,6 64,1 m 47,6 37,7 32,5 m 26,8 m 22,8 m
Fig. 5. Maximum entropy analysis of the Climax Neutron Monitor
station time series for the interval 1953–1996. The frequency range
(0.25–2.35) 10−8Hz is presented.
tral estimator are calculated by minimizing, in the statistical mean square sense, the discrepancy between the data and the reconstructed AR model of the data. Our assumption is that this procedure guarantees that the observed spectral peaks are truly representative of the process and do not represent noisy peaks introduced by the estimating procedure. This assumption is verified by the overall agreement between the different spectral estimators used for this work. The optimum selection of the length of the prediction error filter remains an open issue. Objective methods of filter choice do exist, but the lack of agreement on which is the best shows how much one’s choice is dependent on the data analysed. Here, we make use of three suggestions about the best choice of F . In our experience, the best order F is between Berryman’s criterion F = 2N/ ln 2N and N/2, where N is the number of data (Berryman, 1978; Liritzis et al., 1999). However, various filter lengths were applied and the records were anal-ysed in subsets, as well. This is also a test of stationarity, i.e. a study for possible time variation of the spectral content in the analyzed time series as a function of the filter length. This test was further graphically reinforced by the successive approximations method.
For a chosen filter length F = 250, peaks at 10.40, 7.70, 5.34–3.97, 1.90–1.70, 1.00 years and 10.00, 9.10, 8.40 months and some other smaller periods are present in this analysis (Table 1). It is noteworthy the change in the slope of PSD of the cosmic-ray intensity at levels around 22.8 months, which corresponds to the 1.9-year peak found by other authors (Kudela et al., 2002). It is well illustrated in Fig. 5 the peaks only in the frequency range (0.25–2.35) 10−8Hz.
Synoptic results of the simultaneous application of these three different spectral methods of analysis for the time in-terval 1953–1996 are given in Table 1, together with
previ-Table 2. Quasi-periodic terms of cosmic-ray intensity for the solar
cycles 19–22 computed by Successive Approximations (SA) and Power spectral (PSA) methods of analysis
Cosmic Ray Periodicities per Solar Cycle
PSA (95%)(in months) SA (in months)
19th 100, 50, 126, 69, 23, 20, 12.5, 7.7, 5.1, 3.8, 3.1, 2.4 12, 8, 6, 4, 3 20th 100, 20, 135, 50, 20, 12.5, 7.7, 5.5, 4.3, 3.1, 2.9 12, 8, 6, 4, 3 21st 100, 20, 126, 71, 20, 12.5, 7.1, 5, 3.1, 2.6 12, 8, 6, 4, 3 22nd 20, 110, 52, 23, 20, 10, 7.1, 5, 3.4, 2.7 12, 8, 6, 4, 3
ous results of Xanthakis et al. (1989) for the time interval 1964–1985, using the method of successive approximations graphically. It is interesting to note the agreement of all re-sults obtained by different methods inside the error limits. The error in Xanthakis’s method (1989) using semiannual cosmic-ray values is ± 6 months.
Moreover, we can see from Table 2 that short-term period-icities < 20 months are present in all solar cycles examined here using both PSA and SA methods. The known period of 20 months is also visable in all cycles. An exception is cycle 19 in PSA method. The 11-year period seems to be stable as 10.5 years in odd cycles 19 and 21, while it is varying in the other two even cycles (11.25 and 9.20 years, respec-tively). The second harmonic of this variation is appearing with larger amplitude in odd cycles (69 and 71 m) than in the even cycles (50 and 52 m). In the PSA method the first two periods of 100 and 50 m, although they are given as signif-icant, they cannot be accepted due to the limitations of the specific technique.
3 Discussion
From the above analysis it is evident that, in the cosmic-ray intensity time series at the Neutron Monitor energies over four solar cycles, two groups of fluctuations are appearing: the long-term peaks and the short-term peaks with a limit of the period of 20 months (1.70 year) between them. This transit limit was also reported by Kudela et al. (1991), in an analysis of cosmic-ray time series from Calgary and Deep River stations for the time span 1965–1984. This fact in-dicates that the large-scale cosmic-ray variations are caused from different physical mechanisms from those of short-scale ones. The first ones are caused from possible oscillations of the heliospheric cavity to the heliospheric limit with a period of about 2 years. On the other hand, the peaks in the spectra with periods smaller than two years are attributed to transient variations during different epochs.
H. Mavromichalaki et al.: Low- and high-frequency spectral behavior of cosmic-ray intensity 1687 The large-scale variations are distinguished into three
groups of peaks at 10.5, 7.5 and 5.5 years. The first one is the well-known 11-year variation, known as the sunspot vari-ation. It is suggested that the solar cycle length is 11.8 years, but it is triggered every 10.45 years. Attolini et al. (1987) reported that the coherency between the cosmic rays and the sunspot numbers has appeared to be higher for the peaks of the higher harmonics of the fundamental periodicity of 10.67 years. It is very important to distinguish cosmic-ray vari-ations that are strictly related to the sunspot activity from cosmic-ray variations that are related to other manifestations of solar activity, since in the latter case the 11-year period might have appeared with a different spectrum in the higher harmonics.
The period of 7.5 years seems to be related with the 22-year cycle and consequently, with the polarity of the solar magnetic field, whereas the period of 5.5 years is correlated with the 11-year cycle. Significant fluctuations at around 5.5 years presented in most of our PSD estimates were also re-ported in studies of other solar phenomena. Although these peaks may be harmonics of the fundamental sunspot cycle, they deserve attention since their statistical significance and their correlation with other solar and interplanetary phenom-ena provide means to envisage the physical processes by which the Sun influences the heliosphere. The existence of the 5.5-year periodicity in sunspot number shows that al-though it is rather a real periodicity, it is indeed due to the enhanced power of the second harmonic which arises from the asymmetric form of the solar cycle (Mursula and Zieger, 2000).
The 2-year variation was identified along with the annual and other variations in the neutron monitor data a long time ago (Kolomeets et al., 1973). Later on, such variations at-tracted the attention of many researchers who investigated the effect in the stratospheric sounding data and showed iso-topic character (Charakhchyan et al., 1979). More recently the biennial variations have been found in the low-energy cosmic ray intensity in space (Charakhchyan, 1986). The nature of the highly correlated solar and geomagnetic oscil-lations is not yet understood; there is the possibility that the 2-year variations in the cosmic-ray intensity are connected to the 2-year variation in solar activity via geomagnetic effect. This last point can be confirmed by the fact that the variation seems to change with the asymptotic longitude, as reported by Charakhchyan et al. (1979). In this case the dependence of the polarity of the interplanetary medium with respect to the geomagnetic field can also play an important role. This variation in cosmic rays is observed to be variable both in amplitude and phase, and not correlated with sunspot cyclic variations, but it seems to depend on the magnetic polarity of the interplanetary medium.
Of particular importance is the peak at around 1.7– 1.9 years, recently found in cosmic-ray intensity fluctuations, and the peak at around 1 year, also identified in coronal hole magnetic flux variations (Maravilla et al., 2001; Kudela et al., 2002). This ∼1.7-year periodicity was also found in cosmic rays by Valdes-Galicia, Perez-Enriquez and Otaola (1996).
It was examined in connection with large-scale photospheric motions and identified in the occurrence of the sudden storm enhancements (Valdes-Galicia and Mendoza, 1998). Earlier, this periodicity was reported for the coronal-hole areas in cy-cle 21 (McIntosh et al., 1992). Since the solar modulation is governed by the solar wind structures with the frozen-in IMF, similarities between the cosmic-ray behavior and the time evolution of solar wind structures are expected. So, the peak of 1.7 years observed in cosmic-ray data, as well as in coronal-hole area and not in sunspot number, seems to be of solar origin, as was shown by Maravilla et al. (2001).
The quasi-periodicity of 5.1 m (∼154 days) checked here with NM data is not stable, appearing usually after the so-lar maxima. From our analysis it is evident that it is most prominent in the 21st solar cycle, which was characterized by strong flare activity (Fig. 4). This variation has been re-ported in flare-related data by many authors in different time intervals (Rieger et al., 1984; Bai and Cliver, 1990; Verma et al., 1992, etc.). Wolff (1992) attributed this periodic behav-ior to periodic sources located in the solar interbehav-ior caused by global oscillation modes. Bai and Cliver (1990) underlined that there are cases where a periodicity is seen to disappear for a long interval and then to appear at the same phase or 180◦out of phase. An example of this effect is the 155-day periodicity. Recently, Kudela et al. (2002) presented wavelet analysis results from the time series of the nucleonic inten-sity recorded by Neutron Monitors at four different cut off rigidities and described the PSD temporal evolution at the periodicities of 150–160 days, ∼1.3 years and ∼1.7 years. They indicated that the quasi-periodicity of about 150 days is not stable and it ranges from 140 days to more than 200 days, appearing usually just after the solar maxima. Rybak et al. (2000), as well as Antalov`a et al. (2000), discussed the intermittent character of the 150-day solar periodicity in the 20, 21 and 22 cycles for solar soft X-ray parameters, while the power of the 155-day periodicity of solar SXR data is remarkably better during the 21st than the 20th cy-cle. Cane, Richarchon and Rosenninge (1998) found that the IMF power average during the years 1978–1982 was larger than that in 1968–1972 for the 150-day long periodicity.
Short-term periodicities have been related to enhanced flare activity in certain longitude bands by Bai and Sturrock (1991). Pap, Tobiska and Bouwer et al. (1990) also reported that 51-day and 150–157 day periods are more pronounced in those solar data which are related to a strong magnetic field. Joshi (1999) reported that the 170-day periodicity of cosmic rays was interpreted in the base of six solar rotations (152 = 28.3 day periodicity of 10.7 cm solar radio flux) and may be connected to the instability of the solar core. Mavromicha-laki and Petropoulos (1997) in a study of the cosmic ray dif-fusion coefficient gave evidence that the short-term cosmic-ray variations could be caused by transient effects in the in-terplanetary space.
It is noticeable that obtained results support the claimed difference in the solar activity evolution during odd and even solar cycles. For example, the 11-year variation is 10.5 years in the odd cycles, while it is longer in the even cycle 20 and
1688 H. Mavromichalaki et al.: Low- and high-frequency spectral behavior of cosmic-ray intensity shorter in cycle 22. The periodicity of 5.8 years is obtained in
cycles 19 and 21, with 4.2 years in cycles 20 and 22. More-over, the contribution of 5.1 m is very strong in cycle 21, while the peak of 20 m is stronger in cycle 22 than in the others solar cycles. Recently, Mavromichalaki et al. (2002) reported that this last periodicity is present in the maximum years of the odd cycle 21 and not in cycle 22 of cosmic-ray intensity and flare index time series. This is in agree-ment with the results of Valdes-Galicia and Mendoza (1998), where they reported that the 1.68-year variation seems to be stronger in the odd cycles when the cosmic rays are guided to penetrate the heliosphere through the current sheet by the drift caused by the interplanetary magnetic field. After the magnetic field reversal of the Sun, the cosmic rays penetrate through the current sheet into the heliosphere during the even cycle when their predominant drift via polar latitudes is sug-gested (e.g. Jokipii, 1998). El-Borie and Al-Thoyaibd (2002) showed that there are significant differences in the individual spectra of solar maxima for different cycles. The spectrum for even solar maximum years is higher and much harder than for the odd cycles. All these results, together, may be an indication that different spectral cosmic ray variations in successive solar cycles reveal another fundamental difference between even and odd solar activity cycles.
4 Conclusions
Investigation of high- and low-frequency periodicities in cosmic-ray intensity as recorded by the Climax Neutron Monitor station was performed, including their time evolu-tion. The integral PSD for the interval 1953–1996 gave a power law behavior in frequency with the exponent 1.82 ± 0.01, in agreement with previous findings. This slope seems to change below the limit of 5 × 10⁻⁷Hz, in agreement with the results of Kudela et al. (1991). The method of successive approximations applied to this time series indicate, that there are stable periodicities in cosmic-ray intensity in the whole range between three months and 11 years, as examined here. Occurrence of different peaks at 11, 7.5, 5.5, 2, 1.7 and 1 years, as well as at 8, 6, 4 and 3 months (Table 1), were obtained during the time interval 1953–1996. The quasi-periodicities that are most clearly in the integral power spec-tra over all these years are those of 1.7 year and 5.1 m. The contribution of 5.1 m is stronger during solar cycle 21. If al-ternating periodicities are a systematic feature of the consec-utive cycles, it implies the relevance of the identified differ-ences between even and odd solar activity cycles (Storini et al., 1995; Mavromichalaki et al., 1998; Bazilevskaya et al., 2000, etc.). However, more work is needed on this subject relating cosmic ray variability directly to the solar period-icities, taking into account the polarity reversal of the polar magnetic field. Our analysis indicates that the measurements of CR power spectra as a means of studying the interplane-tary medium and the CR transport mechanisms is very pow-erful.
Finally, to clarify the casual relations between solar mod-ulation effects and cosmic-ray flux on a long-term basis, it could be useful to investigate the temporal variability of high-energy particles near the Earth, as well as available sets of cosmic ray records at a larger distance simultaneously, to-gether with the solar wind and IMF data sets at different points within the heliosphere, using the same methods. The cosmic-ray intensity variations measured by neutron moni-tors is a mirror image of the magnitude of the IMF, as Cane et al. (1999) and Wang et al. (2000) have showed recently. One method to be applied, except for the wavelet transform method, should be that of the successive approximations used here for the Neutron Monitor time series. This gives the op-portunity to define the amplitude and the phase of the ob-served fluctuations, as well as the analytical expression that reproduces the observed time series.
Acknowledgements. Thanks are due to the Cosmic ray group of
Climax Neutron Monitor Station for kindly providing the cosmic ray data. We are also grateful to the Special Research Account of Athens University for supporting Cosmic Ray Research. Thanks are due to the anonymous referees for useful comments on this manuscript.
Topical Editor R. Forsyth thanks two referees for their help in evaluationg this paper.
References
Antalov`a, A.: Periodicities of the LDE type flure occurence (1969– 1992), Adv. Space Res., 14, 721–724, 1994.
Antalov`a, A., Kudela, K., and Rybak, J.: The solar and cosmic-ray synodic periodicity (1969–1998), 2000 ESA SP-463, Space Sci Rev., 97, 355–358, 2000.
Attolini, M. R., Cecchini, S., and Galli, M.: A search of cosmic-ray variations generated by pulsations of the heliosphere, Astrophys. Space Sci., 134, 103–114, 1987.
Axford, W. I.: The modulation of galactic cosmic-rays in the inter-planetary medium, Plan. Space Sci., 13, 115–130, 1965. Bai, T. and Cliver, E. W.: A 154 day periodicity in the occurrence
rate of proton flares, 1991, Astrophys. J., 363, 299–309, 1990. Bai, T. and Sturrock, P. A.: Search for Evidence for an Oblique
Rotator within the Sun, Bull. Am. Astron. Soc., 23, 10 287, 1991. Bazilevskaya, G. A., Krainev, M. B., Makhmutov, V. S., Fl¨uckiger, E. O., Sladkova, A. I., and Storini, M.: Distribution of solar ener-getic particle events over an 11-year solar cycle, Solar Phys. 197, 157–174, 2000.
Berryman, J. G.: Choice of operator length for maximum entropy spectral analysis, Geophysics, 43, 1383, 1978.
Blackman R. G. and Tuckey J. W.: The measurement of power spec-tra from the point of view of communications engineering Dover, New York, 1959.
Burg, J. P.: Maximum Entropy Spectral Analysis, 37th Annual In-ternational SEG Meeting, Oklahoma City, 1967.
Cane, H. V., Richardson, I.G., and von Rosenvinge, T. T.: Interplan-etary magnetic field periodicity of ∼153 days, J. Geophys. Res., 25, 4437, 1998.
Charakhchyan, T. N.: Dynamics of the size of the region of the 11-year modulation of galactic cosmic-rays, Geomagnetism I Aeronomiya, 26, 8, 191–196, 1986.
H. Mavromichalaki et al.: Low- and high-frequency spectral behavior of cosmic-ray intensity 1689 Charakhchyan, T. N., Oklopkov, V. P., and Oklopkova, L. S.: 16th
ICRC Kyoto Conf. Papers, 3, 308, 1979.
El-Borie, M. A. and Al-Thoyaibd, S. S.: Power spectrum of cosmic-ray fluctuations during consecutive, Solar Phys., 209, 397–407, 2002.
Forbush, S. E.: Cosmic-ray Intensity Variation during Two Solar Cycles, J. Geophys. Res., 63, 651, 1958.
Exarchos, G. and Moussas, R. G.: Time variations of the Magnetic Field at the Heliospheric Termination Schock-Galactic Cosmic-Ray modulation, Solar Phys., 187, 157–175, 1999.
Heber, B. and Marsden, R. G.: Cosmic Ray Modulation over Poles at Solar Maximum: Observations, Space Sci. Rev., 97, 309–319, 2001.
Jokipii, J. R.: in: From the Sun: Auroras, Magnetic storms, Solar flares, Cosmic Rays, edited by Suess, S. T., and Tsurutani B. T., American Geophysical Union, Washigton, 123, 1998.
Joshi, A.: Cosmic-ray periodicity at 170 days, Solar Phys., 185, 397–403, 1999.
Kolomeets, E. V., Mukanov, J. and Shvartsman, J. E.: Long-Term variations in Cosmic Rays and Solar Activity, Proc. 13th ICRC (Denver), 23, 1207, 1973.
Kudela, K., Ananth, A. G., and Venkatesan, D.: The low-frequency spectral behavior of cosmic-ray intensity, J. Geophys. Res., 96, 15 871–15 875, 1991.
Kudela, K., Rybak, J., Antalov`a, A., and Storini, M.: Time Evo-lution of Low-Frequency periodicities in Cosmic ray Intensity, Solar Phys., 205, 165-175, 2002
Liritzis, I., Preka-Papadema, P., Petropoulos, B., Banos, C., and Kostopoulos, T.: Spectrum analysis of Jupiters great read spot parameters: area, rotation, latitude and longitude (1963-67), Plan. Space Sci., 47, 469–462, 1999.
Maravilla, D., Lara, A., Valdes-Galicia, J. F., and Mendoza, B.: An analysis of Polar Coronal Hole Evolution: Relations to Other Solar Phenomena and Heliospheric Consequences, Solar Phys., 203, 27–38, 2001.
Mavromichalaki, H.: Application of diffusion-convection model to diurnal anisotropy data, Earth, Moon and Planets, 47, 161–72, 1989.
Mavromichalaki, H., Belehaki, A. and Rafios, X.: Simulated effects at neutron monitor energies: evidence for a 22-year cosmic-ray variation, 1998 Astron. Astrophys., 330, 764–772, 1998. Mavromichalaki, H., Belehaki, A., Rafios, X., and Tsagouri, I.:
Hale-cycle effects in cosmic-ray intensity during the last four cy-cles, Astrophys. Space Sci., 246, 7–14, 1997.
Mavromichalaki, H. and Petropoulos, B.: Periodic variations or the cosmic-ray diffusion coefficient related to interplanetary and so-lar phenomena, Proc. 25th ICRC, 7, 313–316, 1997.
Mavromichalaki, H., Preka-Papadema, P., Petropoulos, B., Liritzis, I., and Kurt, V.: Possible influence of solar flares with hard X-ray emission on cosmic-X-ray modulation, Proc. 4th Astron. Conf. (Samos), 273, 2000.
Mavromichalaki, H., Preka-Papadema, P., Petropoulos B.,
Vassi-laki, A., and Tsagouri, I.: Time evolution of cosmic-ray intensity and solar flare index at the maximum phase of cycles 21 and 22, JASTP (in press), 2002.
McIntosh, P. S.: Solar Interior Processes Suggested by Large-Scale Surface Patterns, in: The Solar cycle, edited by Harvey, K. L., ASP Conf. Proc., 27, 14, 1992.
McIntosh, P. S., Thompson, R. J., and Willock, E. C.: A 600-day periodicity in solar coronal holes, Nature, 360, 322–324, 1992. Mendoza, B., Lara, A., Maravilla, D., and Valdes-Galicia, J. F.:
Magnetic flux emergence and geomagnetic activity, a close cor-relation, Solar Phys., 185, 405–416, 1999.
Moraal, H.: Observation of the eleven-year cosmic-ray modulation cycle, Space Sci. Rev., 19, 845–920, 1976.
Mursula, K. and Zieger, B.: The 1.3-Year Variation in Solar Wind Speed and Geomagnetic Activity, Adv. Space Res., 25, 9, 1939– 1942, 2000.
Pap, J., Bouwer, S. D., Tobiska, W. K., and Bouwer, S. D.: Period-icities of solar irradiance and solar activity indices, Solar Phys., 129, 165–189, 1990.
Rieger, E. Share, G. H., Forrest, D. J., Kanbach, G., Reppin, C., and Chupp, E. L: A 154-day periodicity in the occurrence of hard solar flares, Nature, 312, 623–625, 1984.
Rybak, J., Antalov`a, A., and Storini, M.: ESA SP-463, 419, 2000. Storini, M., Borello-Filisetti, O., Mussino, V., Parisi, M. and
S´ykora, J.: Aspects of the long-term cosmic-ray modulation 1: Solar-cycle ascending phases and associated green corona fea-turs, Solar Phys., 157, 375–387, 1995.
Ulrych, T. T. and Bishop, T. N.: Maximum Entropy Spectral Anal-ysis and Autoregressive Decomposition, Rev. Geophys. Space Phys., 13, 183–200, 1975.
Valdes-Galicia, J. F. and Mendoza, B.: On the role of large-scale solar photospheric motions in the cosmic-ray 1.68-year intensity variation, Solar Phys., 178, 183–191, 1998.
Valdes-Galicia, J. F., Perez-Enriquez, R., and Otaola, J. A.: The cosmic-ray 1.68-Year variation: A clue to understand the nature of the Solar-cycle, Solar Phys., 167, 409–417, 1996.
Valdes-Galicia, J. F., Caballero, R., and Hurtado, A.: Solar cycle cosmic-ray intensity variations in the Mexico City Neutron Mon-itor, Proc. 26th Int. Cosmic Ray Conf., Utah, 7, 119–122, 1999. Venkatesan, D. and Badruddin: Cosmic-ray intensity variations in
the 3-dimensional heliosphere, Space Sci. Rev., 52, 121–194, 1990.
Verma, V. K., Joshi, G. C., and Paliwal, D. C.: On the periodicity of high-speed solar wind streams, Solar Phys., 138, 205, 1992. Wang, V-M., Lean, J., and Sheeley, Jr.: The Long-term variation of
the Sun’s open magnetic flux, Geophys. Res. Lett., 27, 505–508, 2000.
Wolff, C. L.: Intermittent solar periodicities, Solar Phys., 142, 187– 195, 1992.
Xanthakis, J., Mavromichalaki, H., and Petropoulos, B.: Time evo-lution of cosmic ray intensity modulation, Solar Phys., 122, 345– 363, 1989.