HAL Id: hal-01602666
https://hal.archives-ouvertes.fr/hal-01602666
Submitted on 26 May 2020
HAL is a multi-disciplinary open access archive for the deposit and dissemination of sci-entific research documents, whether they are pub-lished or not. The documents may come from teaching and research institutions in France or abroad, or from public or private research centers.
L’archive ouverte pluridisciplinaire HAL, est destinée au dépôt et à la diffusion de documents scientifiques de niveau recherche, publiés ou non, émanant des établissements d’enseignement et de recherche français ou étrangers, des laboratoires publics ou privés.
Distributed under a Creative Commons Attribution| 4.0 International License
Assessment of genetic diversity among cultivated Pearl
millet (Pennisetum glaucum, Poaceae) accessions from
Benin, West Africa
Kifouli Adeoti, Gustave Djedatin, Ebenezer Ewedje, Thierry Beulé, Sylvain
Santoni, Alain Rival, Estelle Jaligot
To cite this version:
Kifouli Adeoti, Gustave Djedatin, Ebenezer Ewedje, Thierry Beulé, Sylvain Santoni, et al.. Assessment of genetic diversity among cultivated Pearl millet (Pennisetum glaucum, Poaceae) accessions from Benin, West Africa. African Journal of Biotechnology, Academic Journals, 2017, 16 (15), pp.782-790. �10.5897/ajb2017.15898�. �hal-01602666�
DOI: 10.5897/AJB2017.15898 Article Number: 76FD90A63681 ISSN 1684-5315
Copyright © 2017
Author(s) retain the copyright of this article http://www.academicjournals.org/AJB
African Journal of Biotechnology
Full Length Research Paper
Assessment of genetic diversity among cultivated Pearl
millet (Pennisetum glaucum, Poaceae) accessions from
Benin, West Africa
Kifouli ADEOTI
1*, Gustave DJEDATIN
2, Ebenezer EWEDJE
2, Thierry BEULE
3, Sylvain
SANTONI
4, Alain RIVAL
5and Estelle JALIGOT
31Département de Biologie Végétale, Faculté des Sciences et Techniques, Université d’Abomey-Calavi, LAMITA, Bénin. 2Faculté des Sciences et Techniques de Dassa Zoumè, Université Polytechnique d’Abomey, Bénin.
3
CIRAD, UMR DIADE (IRD, UM), Montpellier, France. 4
INRA, UMR AGAP (CIRAD, INRA), Montpellier, France. 5
CIRAD, DGDRS, Jakarta, Indonesia. Received 17 January, 2017; Accepted 21 March, 2017
Simple sequence repeat (SSR) molecular markers were used for genetic diversity analysis and population structure of the cultivated Pearl millet in Benin, West Africa. In order to assess the level of genetic diversity, 14 polymorphic SSR markers were used to screen 114 accessions from different agro-ecological zones in Benin. SSR markers were found to reveal a total of 57 alleles with an average of 4.071 allele per locus. Genetic diversity index varied from 0.099 to 0.633 with an average of 0.405. The average observed heterozygosity was found to reach 0.425. The analysis of molecular variance showed no real differentiation between regions. Only 5% of genetic variation was observed between samples collected from north-eastern and north-western region. A high level of variation (95%) was observed among accessions. Moreover, both principal component analysis (PCA) and the dendrogram obtained from the genetic distance among accessions revealed the absence of any specific structuration of accessions from each region under study. Our results confirmed diversity among cultivated Pearl millet in Benin and such diversity is not clustering according to geographical patterns.
Key words: Cereal, simple sequence repeat (SSR) markers, genetic variability.
INTRODUCTION
Pearl millet (Pennisetum glaucum (L.) R. Br., 2n = 2x = 14) is one of the most important food crops widely cultivated in the arid and semi-arid area. It is an important cereal food grain in sub-Saharan Africa and India, where
it is mostly used for human consumption (Loumerem et al., 2008). Because of its good performances in low-fertility soils such as semi-arid regions of Africa and Southeast Asia, it is an important staple cereal cultivated
*Corresponding author. E-mail: zoulade@yahoo.fr.
Author(s) agree that this article remains permanently open access under the terms of the Creative Commons Attribution License 4.0 International License
in regions severely affected by malnutrition. It has a high nutritional value compared to other cereals and presents therefore a high potential in contributing to food and nutrition security (Vanisha et al., 2011). In Benin, national production (27000 tonnes in 2013, USDA, 2013) ranks fourth among cereals after rice, maize and sorghum, although it ranks second in the northern part of the country. Being a drought-tolerant crop, pearl millet is cultivated in dry northern regions of Benin under increasingly short and marginal raining seasons. It is used in various local food preparations like local porridge, cakes and traditional beverage. Despite its importance in the daily food supply of the northern populations of the country, pearl millet is considered as a neglected and underutilized species (NUS) (Dansi, 2010). The combined effects of the decrease in cultivated areas dedicated to pearl millet versus other cereals in this part of the country and the reduction of the rainy season as a result of climate change (MAEP, 2007), may lead to either decrease or loss of genetic diversity on the long term. An international initiative aiming at securing plant genetic resources has recently been launched (FAO, 2010), in order to help farmers to respond to climate change and to mitigate the losses due to genetic erosion. This endeavour needs to be further supported through the implementation of adequate preservation measures at the local scale, starting with an inventory of the existing diversity.
At this time, there is no national collection of pearl millet landraces from Benin and moreover, very little information is available on the diversity of cultivated pearl millet accessions in the northern part of the country. Overall, 22 Beninese pearl millet accessions have been sampled as part of larger studies targeting landraces spanning Western and Central Africa (Haussmann et al., 2006; Stich et al., 2010), and stored in the international genebank. However, these population is insufficient to provide information of their genetic diversity. It therefore appears necessary to conduct a new sampling campaign in this region in order to close the gaps in the previous datasets and to prevent the loss of existing local pearl millet diversity. Pear millet has an anemophilous pollination, which contributes to the maintenance of genetic variability through gene flow among wild and cultivated population (Pesson, 1984; Tostain, 1993). The use of agromorphological parameters for the characterization of diversity is not sufficient and will not provide an accurate classification of the accessions, since morphological criteria are strongly influenced by the environment (Bahram et al., 2014). On the contrary, the molecular markers have been proven to be a powerful tool to assess the genetic varaition and to point up any relationship among accessions in various crop species such as Gossypium and Broomcorn millet (Wu et al., 2007; Hu et al., 2009).
Several molecular genetic tools based on either dominant or codominant markers can be used in the
Adeoti et al. 783
molecular characterization of genetic diversity in plants. Among these, Single Sequence Repeat (SSR) or microsatellite markers, which target tandem repeats of di- tri- or tetra-nucleotide DNA motifs, are both highly polymorphic within populations and randomly distributed throughout the genome in both transcribed and non-transcribed sequences (Saghai-Maroof et al., 1994; Manzelli et al., 2007). SSR markers have been successfully used to evaluate genetic diversity in several crop species such as wheat (Fufa et al., 2005),
Pennisetum purpureum (Azevedo et al., 2012), Capsicum
(Nicolai et al., 2013), Sorghum (Cuevas et al., 2014), barley (Shakhatreh et al., 2015), Vigna subterranea (Molosiwa et al., 2015), maize (Salami et al., 2016) and some underutilized species such as buckwheat and wild melon (Roy et al., 2012; Zhang and Zao, 2013). For pearl millet characterization, several SSR markers were developed (Mariac et al., 2006; Stich et al., 2010; Nepolean et al., 2012) and used to evaluate its genetic diversity at the regional scale in west Africa. In the Stich et al. (2010) study, it has been proposed that Western and Central Africa (WCA) are the primary center of origin and genetic diversity of pearl millet. Moreover, with respect to Beninese accessions, few of them (22 accessions) were included in the 2010 study since the country is regarded as a secondary centre for pearl millet production.
A more in-depth knowledge of genetic diversity is the key for both crop breeding programme and the development of in situ conservation strategies. The main objectives of the present study were: (1) to evaluate the level of genetic diversity of cultivated millet in Benin and (2) to evaluate genetic diversity structure in the cultivated areas, and to explore relationship between such structure and the local usages of the accessions.
MATERIALS AND METHODS Plant collection and DNA extraction
Pearl millet accessions were collected in December 2013 to January 2014 from the northern part of Benin, which is divided between the northeast and the northwest covered by the Departments of Borgou-Alibori and Atacora-Donga, respectively. The northern region is located in arid and semi-arid agro-ecological zones characterized by unpredictable and irregular rainfall oscillating between 800 and 950 mm/year. The overall climate is Sudanian with alternating dry (November to April) and rainy (May to October) seasons (Jalloh et al., 2013). Additionally, the northwest region is characterized by a particular climate called Atacorian climate. The annual mean temperatures range from 26 to 28°C and may exceptionally reach 35 to 40°C in the far northern localities (Adomou, 2005; Akoegninou et al., 2006). Figure 1 presents distibution of the prospected villages across the northern part of the country. During these surveys, samples were collected from farmers providing panicles or seeds, whenever panicles were not available.
For genomic DNA extractions, five seeds from each accession were germinated in a polyethylene bag and leaves from 4 week-old plantlets were harvested. DNA was extracted through the grinding
Figure 1. Geographical distribution of villages across study areas.
of 100 mg of leaf tissues sampled from 4 week-old plantlets in 750 µl of extraction buffer (100 mM Tris-HCl, 1.4 M NaCl, 20 mM EDTA, 2% MATAB, 1% PEG 6000, 0.5% sodium sulphite, and pH 8) pre-heated at 65°C. The lysate was then decanted into a 2 ml Eppendorf tube and incubated at 65°C for 20 min. DNA was purified through two successive steps of phase separation with chloroform-isoamyl alcohol (24:1, v/v) and precipitation from the supernatant with one volume of cold isopropyl alcohol, respectively, followed each by a centrifugation at 13,000 rpm for 10 min at 4°C temperature. The DNA pellet was then washed twice in 70% ethanol and dried at 40°C for 1 h, before re-suspension in 150 µl of TE 1X. RNAs were eliminated through incubation for 1 h at 37°C with 6 µl of RNase A (SIGMA). The integrity of the DNA extracts was assessed through agarose gel electrophoresis and their concentration was determined through fluorimetric quantitation using the Hoechst 33258 dye with a GENios Plus fluorimeter (Tecan Scientific Instruments).
DNA amplification and SSR markers analysis
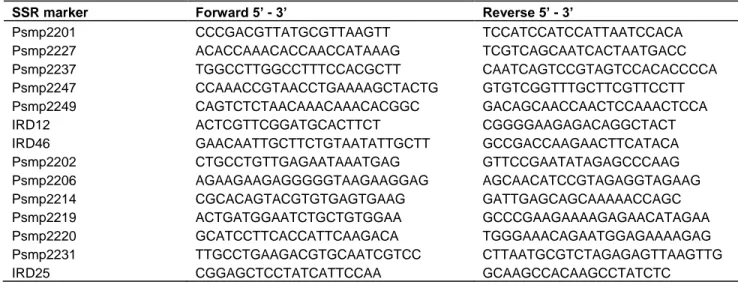
A total of 14 SSR primers pairs, selected from previous analyses of pearl millet genetic diversity (Mariac et al., 2006; Azevedo et al., 2012), were used in the present study (Table 1). For each pair, the 5' end of the forward primer was labeled with a fluorescent dye
(yellow, blue, green or red). The amplification was performed on 25 ng of genomic DNA as two multiplex groups consisting of 7 primer pairs each, in a reaction mix including 2.5 mM dNTPs, 20 µM of each primer pair, Taq Hot start Q 5U/µl (QIAGEN), SolQ 5X in a final volume of 10 µl. The amplification procedure consisted of an initial denaturation step at 95°C for 15 min followed by 35 cycles of 94°C for 30 s, 55°C for 1.5 min and 72°C for 1 min, followed by a final extension cycle of 72°C for 30 min. Amplification products were then diluted and mixed with GS 500Liz (Applied Biosystems Inc.) internal size standard and denaturated through heating at 95°C for 5 min prior to capillary electrophoresis in an ABI Prism 3500 Genetic Analyzer sequencer (Applied Biosystems). Fragment analysis and allele scoring were performed using the GeneMapper Software version 4.1 and double-checked manually.
Data analysis
GenAIEx software version 6.502 (Peakall and Smouse, 2012) was used to perform the genetic data analysis. Total number of alleles, allele frequencies, number of alleles per locus for each locus and population, observed heterozygosity and gene diversity (He) (Nei, 1973) were calculated. In order to graphically represent the relationships between accessions, genetic similarity indices between genotypes were calculated using the DARwin 6 software
Adeoti et al. 785
Table 1. List of microsatellites markers used for diversity study.
SSR marker Forward 5’ - 3’ Reverse 5’ - 3’
Psmp2201 CCCGACGTTATGCGTTAAGTT TCCATCCATCCATTAATCCACA
Psmp2227 ACACCAAACACCAACCATAAAG TCGTCAGCAATCACTAATGACC
Psmp2237 TGGCCTTGGCCTTTCCACGCTT CAATCAGTCCGTAGTCCACACCCCA
Psmp2247 CCAAACCGTAACCTGAAAAGCTACTG GTGTCGGTTTGCTTCGTTCCTT Psmp2249 CAGTCTCTAACAAACAAACACGGC GACAGCAACCAACTCCAAACTCCA
IRD12 ACTCGTTCGGATGCACTTCT CGGGGAAGAGACAGGCTACT
IRD46 GAACAATTGCTTCTGTAATATTGCTT GCCGACCAAGAACTTCATACA
Psmp2202 CTGCCTGTTGAGAATAAATGAG GTTCCGAATATAGAGCCCAAG Psmp2206 AGAAGAAGAGGGGGTAAGAAGGAG AGCAACATCCGTAGAGGTAGAAG Psmp2214 CGCACAGTACGTGTGAGTGAAG GATTGAGCAGCAAAAACCAGC Psmp2219 ACTGATGGAATCTGCTGTGGAA GCCCGAAGAAAAGAGAACATAGAA Psmp2220 GCATCCTTCACCATTCAAGACA TGGGAAACAGAATGGAGAAAAGAG Psmp2231 TTGCCTGAAGACGTGCAATCGTCC CTTAATGCGTCTAGAGAGTTAAGTTG
IRD25 CGGAGCTCCTATCATTCCAA GCAAGCCACAAGCCTATCTC
(Perrier and Jacquemoud-Collet, 2006). The neighbor-joining method was used to construct the dendrogram. A principal component analysis (PCA) was also performed in order to visualize the distribution of the accessions according to their microsatellite diversity. Finally, an Analysis of Molecular Variance (AMOVA) was also performed using the GenAIEx software in order to estimate the total molecular variance between and within populations.
RESULTS
Diversity of species and vernacular names among area of study
During these surveys, a total of 114 accessions corresponding to 27 different popular names were collected through villages. The number of varieties varied from one area to another and across ethnic groups. Venacular names recorded were related to local usages such as quality and quantity of flour obtained from seeds, development cycle of variety (late or early). In the east-northern part of the country, pearl millet were used mainly to prepare meal and porridge for children. Nevertheless in the west-northern, the second use of P. glaucum is related to the preparation of traditional beverage. These results point out the diversity of use of pearl millet in the Northern Benin. Indeed, traditional beverage were consumed daily by people and represents a part of identity of most of ethnic group live in the west-northern of the country and could justify the difference observed for local usages in east-northern and west-northern parts.
Microsatellite marker polymorphism and global diversity among population
With the fourteen SSR primer pair used, 57 alleles were detected among the 114 pearl millet accessions with an
average of 4.071 alleles per locus. Table 2 shows a summary of genetic values obtained for each locus. The number of alleles per locus varied from 2 to 8. The lowest and the highest values were obtained respectively for the loci Psmp2202 and Psmp2231 (Table 2). The number of private allele varied from 1 (Psmp2201, Psmp2220, Psmp2237, Psmp2247, IRD46) to 4 (Psmp2231). Genetic diversity ranged from 0.099 to 0.633 with an average of 0.405. For the observed heterozygosity, the obtained values varied from 0.105 to 0.771 with an average of 0.425. These values were obtained for the loci Psmp2247 (for the lowest) and Psmp2220 (for the highest). Most of the loci presented an excess of heterozygosis. The fixation index obtained for all loci varied from 0.303 to 0.147 with an average of 0.050.
Genetic relationship among and within population
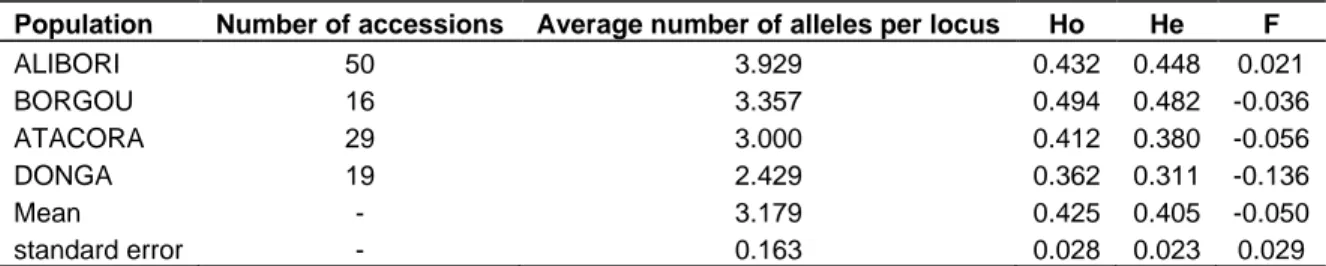
The genetic diversity information among geographic regions of Northern Benin was presented in the Table 3. The observed allelic diversity differed from one region to another. The average number of alleles ranged from 2.429 to 3.929. The department of Donga was found to show the lowest average number of alleles while the highest value was obtained for the Alibori. On the other hand, the genetic diversity varied from 0.311 for the Donga to 0.482 for Borgou Department.
The fixation index values F varied from 0.132 to 0.021 with an average of 0.050 corresponding to a deficiency of heterozygosis within the whole population. However, the values obtained for each department showed in their majority an excess of heterozygosis for regions Borgou, Atacora, and Donga. Only the region of Alibori presented a deficiency of heterozygosis.
The Fst data translate the existing differentiation among populations (Table 4). The values obtained for the
Table 2. Genetic diversity parameters of microsatellites loci used to evaluate the diversity of pearl millet (Pennisetum glaucum,
Poaceae).
SSR marker Number of different alleles Mean of different alleles Na/locus Ne I Ho He F
Psmp2201 3.000 2.500 1.450 0.501 0.284 0.287 0.022 Psmp2227 4.000 3.750 1.691 0.762 0.467 0.401 -0.157 Psmp2237 4.000 3.250 1.850 0.762 0.404 0.447 0.123 Psmp2247 3.000 2.250 1.114 0.211 0.105 0.099 -0.051 Psmp2249 3.000 3.000 1.909 0.789 0.391 0.465 0.140 IRD12 5.000 3.500 2.205 0.881 0.568 0.533 -0.093 IRD46 3.000 2.500 1.845 0.665 0.409 0.445 0.046 Psmp2202 2.000 2.000 1.872 0.655 0.607 0.463 -0.303 Psmp2206 5.000 3.500 1.868 0.740 0.402 0.411 -0.025 Psmp2214 5.000 3.000 1.288 0.406 0.201 0.209 0.010 Psmp2219 3.000 2.750 2.106 0.815 0.624 0.523 -0.202 Psmp2220 6.000 4.750 2.757 1.188 0.771 0.633 -0.218 Psmp2231 8.000 5.250 2.175 1.071 0.453 0.531 0.147 IRD25 3.000 2.500 1.335 0.414 0.266 0.224 -0.173 Mean 4.071 3.179 1.819 0.704 0.425 0.405 -0.050 SE 0.425 0.163 0.068 0.041 0.028 0.023 0.029
Ne: Number of effective alleles, I: Shannon’ information index, Ho: observed heterozygousity, He: gene diversity, F: fixation index.
Table 3. Genetic diversity parameters among geographical group of Pearl millet (Pennisetum glaucum, Poaceae).
Population Number of accessions Average number of alleles per locus Ho He F
ALIBORI 50 3.929 0.432 0.448 0.021 BORGOU 16 3.357 0.494 0.482 -0.036 ATACORA 29 3.000 0.412 0.380 -0.056 DONGA 19 2.429 0.362 0.311 -0.136 Mean - 3.179 0.425 0.405 -0.050 standard error - 0.163 0.028 0.023 0.029
Ho: Observed heterozygousity, He: gene diversity, F: fixation index.
Table 4. Estimates of Pairwise Fst values (below diagonal)
among the different collection regions.
Region Alibori Borgou Atacora Donga
ALIBORI 0.000
BORGOU 0.000 0.000
ATACORA 0.035 0.043 0.000
DONGA 0.060 0.079 0.008 0.000
index of differentiation Fst among pairs of geographical groups varied from 0 (between Borgou and Alibori) to 0.079 (between Borgou and Donga). The obtained values showed a very low level of differentiation among the various geographical groups. No differentiation could be observed between Borgou and Alibori on one hand and a very low level between Atacora and Donga on the other hand. This result could be justified by the close
geographical proximity of such regions. Indeed, Borgou and Alibori represent the north eastern part of Benin, while Atacora and Donga represent the north western one. It is then understandable that seeds exchange could have happened between Borgou and Alibori on one hand and between Atacora and Donga on the other hand. The only and moderate differentiation observed was found to occur between Alibori and Donga and Borgou and Donga. This situation could be probably explained by the relative geographical isolation of these regions.
An AMOVA was also performed among regions, populations, accessions and within accessions (Table 5). The results of AMOVA showed that variations could be observed at two levels: firstly within accessions and then among regions. This analysis revealed that the widest variation (95%) was observed within accessions and not between accessions. No variation was captured among populations and among accessions. However, little variation (5%) was observed between geographical
Adeoti et al. 787
Table 5. Results from analysis of molecular variance (AMOVA) using two regions and 4 groups of populations.
Parameter df SS MS Estimated variance Variation (%)
Among regions 1 19.509 19.509 0.150 5
Among populations 2 5.687 2.844 0.000 0
Among accessions 110 321.366 2.922 0.000 0
Within accessions 114 338.623 2.970 2.970 95
Total 227 685.185 - 3.121 100
df: Degrees of freedom; SS: sum of squares; MS: mean square.
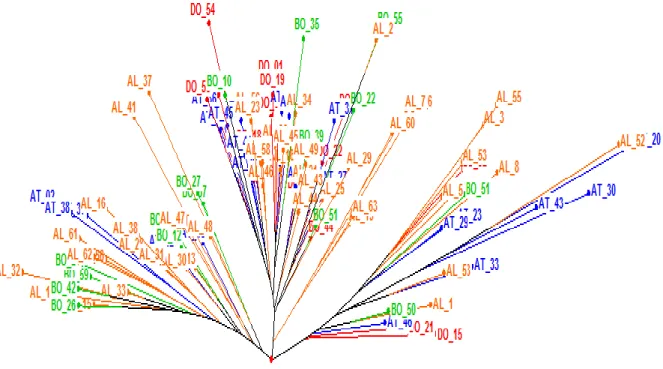
Figure 2. Neighbour joining dendrogram from 114 pearl millet accessions obtained from the UPGMA method.
Accessions from Alibori, Borgou, Atacora and Donga are respectively shown in orange, green, blue and red.
regions.
The structure of accessions under study and PCA
The graphical representation of genetic relationships among accessions was drawn with a dendrogram taking into account the various genetic distances of Nei. The analysis of this dendrogram revealed that there is no particular structuration of the diversity of accessions according to their geographical origin. Even if three clusters were obtained from the dendrogram (Figure 2), each of them was found to gather accessions originating from each of the four regions.
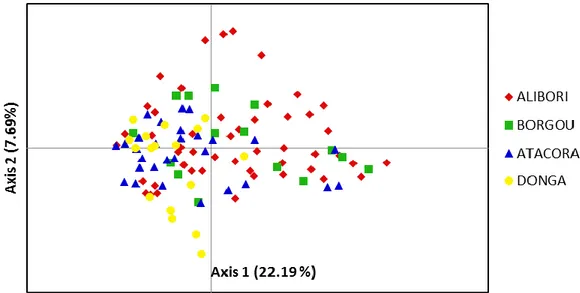
In order to better visualize the distribution of variability and to point out any genetic information related to the 114 accessions under study from the previous
dendrogram, a PCA was also performed (Figure 3). The first two axes of PCA explained respectively 22.19 and 7.69% with a cumulative variation of 29.88%. However, neither a clear pattern nor a geographical separation could be evidenced. A compact homogeneity was observed from the PCA representation. The PCA showed a similar result when an analysis of the dendrogram based on the genetic similarity among accession was performed; also, it indeed revealed the absence of any geographical structuration among accessions.
DISCUSSION
The northern where Pearl millet was cultivated, its consumption differed from one region to another. Indeed, in the part of the north east, it is used mainly to prepare
Figure 3. Principal component analysis performed on the 114 pearl millet accessions under study.
local beverage and meal with its flour. In the north west, it is used principally for beverage. This difference in usage could also be observed in the choice of the varieties cultivated throughout the various regions.
Our study aimed to assess the level of genetic diversity among cultivated pearl millet accessions collected in Northern Benin using SSR molecular markers. Using this approach, no significant variations were found among pearl millet accessions for most of the studied agromophological parameters (Bahir et al., 2014). These variations showed some limitations such as phenotype modifications due to environmental influence, when compared with molecular markers (Ferreira, 2006). The SSR molecular markers are known to be efficient for genetic diversity studies of pearl millet (Mariac et al., 2006; Bashir et al., 2015; Shakhatreh et al., 2015). The current study showed a lower average (4.071) number of alleles per locus compared to that reported by Mariac et al. (2006) which was 6.2 for 421 cultivated accessions from Niger, and 16.4 for accessions from a wide geographic range in West and Central Africa (Stich et al., 2010). Other authors reported the analysis of 214 Sudanese pearl millet accessions in which they found a high level of alleles was reported with an average of 13.3 per locus (Bashir et al., 2015). The low number of alleles observed in the present study could be explained by (1) the limited number of markers involved and (2) a smaller sample size when compared to previous studies.
Genetic variability contributes to a long term selection (Allard, 1960). According to our results, there is a moderate genetic diversity level among accessions. The average gene diversity (He = 0.405) obtained for the 114 cultivated accessions was lower than those reported in others pearl millet genetic diversity studies based on SSR molecular maker. Indeed Stich et al. (2010) reported on a He = 0.74 across west and central pearl millet inbreds,
Mariac et al. (2006) 0.49 among landraces from Niger and 0.77 for Sudanese cultivated accessions (Bashir et al., 2015). Although the number of samples and markers used did vary from one study to another, the estimated genetic diversity cannot be a function of the size of our sample. This explanation had been also underlined by Stich et al. (2010). The obtained value could be explained by a relatively weak polymorphism in our pearl millet samples when compared with others’ studies. This remark was also supported by the number of alleles obtained per marker. However, our results revealed a level of diversity among local pearl millet landraces that could be considered as useful for improving existing landraces and the development of local conservations strategies for biodiversity. As mentioned by Wang et al. (2012), high genetic diversity is favourable for genetic marker development, construction of segregating populations and provides enriched gene resources for gene mining in the grass family.
However, the AMOVA and Fst pairwise comparison revealed that no differentiation was observed within geographical regions. The lack of differentiation among populations could be explained by the closeness of populations of the northeast and the northwest which contributed to the high rate of pollen-mediated gene flow and by a high frequency of seeds exchange among farmers. Moreover, the possibility of alleles sharing and exchange contributed also to that situation. Similar results were reported by Bashir et al. (2015). According to Stich et al. (2010), the lack of regional differentiation could be explained by the fact that pearl millet is a highly allogamous plant with an out-crossing rate exceeding 85%. The little variation observed among the regions could be attributed probably to the climatic conditions existing in the north-eastern and the north-western part of Benin. Indeed, the northwest is characterized by a high
mountainous landscape which probably influenced the genetic adaptability of landraces. Most of the differentiation (95%) was present within accessions. This could be due to the natural selection and gene flow as it had been reported in many studies (Turpeinen et al., 2003; Nevo et al., 2004; Shakhatreh et al., 2015). According to Nevo et al. (1998), natural selection appears to be a major differentiating and orienting force of regional evolutionary change, maintaining genetic polymorphisms under conditions of environmental heterogeneity and stress.
The PCA showed no clear regional structuration of landraces. Moreover, the dendrogram obtained from a neighbour joining revealed also a similar result. These observations confirmed the previous results reported earlier and suggested that there is a great genetic similarity among cultivated regions of pearl millet in the Benin northern. It could be related to seeds exchange among regions which highly contributed to intermixture of accessions as mentioned earlier. Similar results were reported among the cultivated landraces in Niger (Mariac et al., 2006) and Sudanese (Bashir et al., 2015). Our results will contribute highly in the development of the pearl millet conservation strategies in the Northern Benin.
Conclusion
Conclusively, the present study revealed the genetic relationship and diversity among cultivated pearl millet accession in Northern Benin. Our results revealed a moderate genetic diversity and the weak extent of differentiation between regions. Given the number of alleles obtained per locus, the local plant material could be useful for the genetic improvement of existing varieties.However,anagromorphological characterization of accessions must be conducted and combined with genetic information in order to identify the best accessions which could be integrated into future plant breeding programs.
CONFLICT OF INTERESTS
The authors have not declared any conflict of interests.
Abbreviations
AMOVA, Analysis of molecular variance; MATAB, mixed
alkyltrimethylammonium bromide; SSR, simple sequence repeat.
ACKNOWLEDGMENTS
The authors would like to thank Islamic Development Bank (IDB) for funding through the Merit Scholarship Program attributed to the first author. We also wish to
Adeoti et al. 789
thank Christine TOULON from Institut National de RecherchesAgronomiques(INRA-Montpellier–FRANCE) for technical assistance during laboratory jobs; Cedric MARIAC and Marie COUDERC from Dynadiv for primers providing.
REFERENCES
Adomou AC (2005). Vegetation patterns and environmental gradients in Benin: implications for biogeography and conservation. PhD thesis Wageningen University, Wageningen; ISBN 908504-308-5; 150 p. Akoegninou A, van der Burg WJ, van der Maesen LJG (2006). Flore
analytique de Benin. Backhuys Publishers, Leiden, 1034 p.
Allard RW (1960). Principles of plant breeding. Edition, John Wiley. ISBN 0471023159, 9780471023159; 485 p.
Azevedo ALS, Costa PP, Machado JC, Machado MA, Pereira AV, da Silva Lédo FJ (2012). Cross Species Amplification of Pennisetum
glaucum, Microsatellite Markers in Pennisetum purpureum and
Genetic Diversity of Napier Grass Accessions. Crop Sci. 52:1776-1785.
Bahram M, Mohsen K, Ezzat K, Salar S (2014). Variation in Agro-morphological Characters in Iranian Garlic Landraces. Int. J. Veg. Sci. 20:202-215.
Bashir EM A, Abdelbagi MA, Adam MA, Albrecht EM, Heiko KP, Haussmann BIG (2014). Characterization of Sudanese pearl millet germplasm for agro-morphological traits and grain nutritional values. Plant Genet. Resour. 12:35-47.
Cuevas HE, Prom LK, Erpelding JE, Brotons V (2014). Assessments of genetic diversity and anthracnose disease response among Zimbabwe sorghum germplasm. Plant Breed. 133:234-242.
Dansi A (2010). Overview of the research on Neglected and Underutilized crops in West Africa. Oral communication, Cotonou, Benin.
FAO (2010). The second report on the state of the world’s plant genetic resources for food and agriculture. Rome, 370 p.
Ferreira ME (2006). Molecular analysis of gene banks for sustainable conservation and increased use of crop genetic resources. In. Ruane J, Sonnino A (eds) The role of biotechnology in exploring and protecting agricultural genetic resources. pp. 121-127.
Fufa H, Baenziger PS, Beecher BS, Dweikat I, Graybosch RA, Eskridge KM (2005). Comparison of phenotypic and molecular marker-based classifications of hard red winter wheat cultivars. Euphytica 145:133-146.
Haussmann BIG, Boubacar A, Boureima SS, Vigouroux Y (2006). Multiplication and preliminary characterization of West and Central African pearl millet landraces. International Sorghum and Millets Newsletter. 47:110-112.
Hu X, Wang J, Lu P, Zhang H (2009). Assessment of genetic diversity in broomcorn millet (Panicum miliaceum L.) using SSR markers. J. Genet. Genomics 36:491-500.
Jalloh A, Nelson GC, Thomas TS, Zougmoré R, Roy-Macauley H (2013). West African agriculture and climate change: a comprehensive analysis. Int. Food Policy Res. Inst.
Loumerem M, Van Damme P, Reheul D, Behaegh T (2008). Collection and evaluation of pearl millet (Pennisetum glaucum) germplasm from the arid regions of Tunisia. Genet. Resour. Crop Ev. 55:1017-1028. MAEP (2007). Rapport sur l’état des ressources phytogénétiques pour
l’alimentation et la nutrition. 57 p.
Manzelli M, Pileri L, Lacerenza N, Stefano B, Vincenzo V (2007). Genetic diversity assessment in Somali sorghum (Sorghum bicolor (L.) Moench) accessions using microsatellite markers. Biodivers. Conserv. 16:1715-1730.
Mariac C, Luong V, Kapran I, Mamadou A, Sagnard F, Deu M, Chantereau J, Gerard B, Ndjeunga J, Bezancon G, Pham JL, Vigouroux Y (2006). Diversity of wild and cultivated pearl millet accessions (Pennisetum glaucum [L.] R. Br.) in Niger assessed by microsatellite markers. Theor. Appl. Genet. 114:49-58.
Molosiwa OO, Aliyu S, Stadler F, Mayes K, Massawe F, Kiian A, Mayes S (2015). SSR marker development, genetic diversity and population
structure analysis of Bambara groundnut [Vigna subterranean (L.) Verdc.] landraces. Genet. Resour. Crop Evol. 62:1225-1243. Nei M (1973). Analysis of gene diversity in subdivided populations.
Proc. Natl. Acad. Sci. 70:3321-3323.
Nepolean T, Gupta SK, Dwivedi SL, Bhattacharjee R, Rai KN, Hash CT (2012). Genetic diversity in maintainer and restorer lines of pearl millet. Crop Sci. 52:2555-2563.
Nevo E, Baum B, Beiles A, Johnson D (1998). Ecological correlates of RAPD DNA diversity of wild barley, Hordeum spontaneum, in the Fertile Crescent. Genet. Resour. Crop Evol. 45:151-159.
Nevo E, Chen G, Suprunova T, Krugman T, Fahima T (2004). Ecogeographic and genetic determinates of kernel weight. Seed Sci. Res. 14:137-146.
Nicolai M, Cantet M, Sage-Palloix AM, Lefebvre V, Palloix A (2013). Genotyping a large collection of pepper (Capsicum spp.) with SSR loci brings new evidence for the wild origin of cultivated C. annuum and the structuring of genetic diversity by human selection of cultivar types. Genet. Resour. Crop Evol. 60:2375-2390.
Peakall R, Smouse PE (2012). GenAlEx 6.5: genetic analysis in Excel. Population genetic software for teaching and researchan update. Bioinformatics 28:2537-2589.
Perrier X, Jacquemoud-Collet JP (2006). DARwin software http://darwin.cirad.fr.
Pesson P (1984). Pollination and crop production; Ed. Quae, ISBN 2853404811. 683 p.
Roy A, Bal SS, Fergany M, Kaur S, Singh H, Malik AA, Singh J, Monfort AJ, Dhillon NPS (2012). Wild melon diversity in India (Punjab State). Genet. Resour. Crop Evol. 59:755-767.
Saghai-Maroof MA, Biyashev RM, Yang GP, Zhang Q, Allard W (1994). Extraordinary polymorphic microsatellite DNA in barley: species diversity, chromosomal locations, and population dynamics. Proc. Natl. Acad. Sci. USA. 91:5466-5470.
Salami HA, Chabi Sika K, Padonou W, Aly D, Adjanohoun A, Kotchoni S, Baba-Moussa L, Yallou C (2016). Genetic Diversity of Maize Accessions (Zea mays L.) Cultivated from Benin Using Microsatellites Markers. Am. J. Mol. Biol. 6:12-24.
Shakhatreh Y, Baum M, Haddad N, Alrababah M, Ceccarelli S (2015). Assessment of genetic diversity among Jordanian wild barley (Hordeum spontaneum) genotypes revealed by SSR markers. Genet. Resour. Crop. Evol. 63:813-822.
Stich B, Haussmann BIG, Pasam R, Bhosale S, Hash CT, Melchinger AE, Parzies HK (2010). Patterns of molecular and phenotypic diversity in pearl millet [Pennisetum glaucum (L.) R. Br.] from West and Central Africa and their relation to geographical and environmental parameters. BMC Plant Biol. 10(1):216.
Tostain S (1993). Evaluation of the genetic diversity of diploid penicillary millets (Pennisetum glaucum (L.) R. Br.) using enzymatic markers. Study of the relations between wild and cultivated species. PhD thesis, 331 p.
Turpeinen T, Vanhala T, Nevo E, Nissila E (2003). AFLP genetic polymorphism in wild barley (Hordeum spontaneum) populations in Israel. Theor. Appl. Genet. 106:1333-1339.
Vanisha SN, Dhaduk JJ, Sareen N, Shahu T, Desai R (2011). Potential Functional Implications of Pearl millet (Pennisetum glaucum) in Health and Disease. J. Appl. Pharm. Sci. 1(10):62-67.
Wang C, Jia G, Zhi H, Niu Z, Chai Y, Li W, Wang Y, Li H, Lu P, Zhao B, Diao X (2012). Genetic diversity and population structure of chinese foxtail millet [Setaria italica (L.) Beauv.] landraces. G3 Genes Genomes Genetics 2:769-777.
Wu YX, Daud MK, Chen L, Zhu SJ (2007). Phylogenetic diversity and relationship among Gossypium germplasm using SSRs markers. Plant Syst. Evol. 268:199-208.
Zhang Z, Zhao L (2013). Molecular characterization of genetic diversity of underutilized crops: Buckwheat as an example. Acta Hortic. 979:407-419.