HAL Id: hal-02935366
https://hal.univ-grenoble-alpes.fr/hal-02935366
Submitted on 10 Sep 2020HAL is a multi-disciplinary open access
archive for the deposit and dissemination of sci-entific research documents, whether they are pub-lished or not. The documents may come from teaching and research institutions in France or abroad, or from public or private research centers.
L’archive ouverte pluridisciplinaire HAL, est destinée au dépôt et à la diffusion de documents scientifiques de niveau recherche, publiés ou non, émanant des établissements d’enseignement et de recherche français ou étrangers, des laboratoires publics ou privés.
Virtual Sources of Body Waves from Noise Correlations
in a Mineral Exploration Context
Philippe Dales, Laura Pinzon-Ricon, Florent Brenguier, Pierre Boué, Nick
Arndt, John Mcbride, François Lavoué, Christopher Bean, Sophie Beaupretre,
Rosemary Fayjaloun, et al.
To cite this version:
Philippe Dales, Laura Pinzon-Ricon, Florent Brenguier, Pierre Boué, Nick Arndt, et al.. Virtual Sources of Body Waves from Noise Correlations in a Mineral Exploration Context. Seismological Research Letters, Seismological Society of America, 2020, 91 (4), pp.2278-2286. �10.1785/0220200023�. �hal-02935366�
Virtual Sources of Body Waves from Noise
Correlations in a Mineral Exploration
Context
Philippe Dales*1, Laura Pinzon-Ricon1, Florent Brenguier1, Pierre Boué1, Nick Arndt2, John McBride3, François Lavoué1, Christopher J. Bean4, Sophie Beaupretre2, Rosemary Fayjaloun1, and Gerrit Olivier1,5,6
Abstract
Cite this article as Dales, P., L. Pinzon-Ricon, F. Brenguier, P. Boué, N. Arndt, J. McBride, F. Lavoué, C. J. Bean, S. Beaupretre, R. Fayjaloun, et al. (2020). Virtual Sources of Body Waves from Noise Correlations in a Mineral Exploration Context, Seismol. Res. Lett. XX, 1–9, doi:10.1785/0220200023.
The extraction of body waves from passive seismic recordings has great potential for monitoring and imaging applications. The low environmental impact, low cost, and high accessibility of passive techniques makes them especially attractive as replacement or complementary techniques to active-source exploration. There still, however, remain many challenges with body-wave extraction, mainly the strong dependence on local seismic sources necessary to create high-frequency body-wave energy. Here, we present the Marathon dataset collected in September 2018, which consists of 30 days of continuous recordings from a dense surface array of 1020 single vertical-component geophones deployed over a mineral exploration block. First, we use a cross-correlation beamforming technique to evaluate the wavefield each minute and discover that the local highway and railroad traffic are the primary sources of high-frequency body-wave energy. Next, we demonstrate how selective stacking of cross-correlation functions dur-ing periods where vehicles and trains are passdur-ing near the array reveals strong body-wave arrivals. Based on source station geometry and the estimated geologic structure, we interpret these arrivals as virtual refractions due to their high velocity and linear moveout. Finally, we demonstrate how the apparent velocity of these arrivals along the array contains information about the local geologic structure, mainly the major dip-ping layer. Although vehicle sources illuminating array in a narrow azimuth may not seem ideal for passive reflection imaging, we expect this case will be commonly encoun-tered and should serve as a good dataset for the development of new techniques in this domain.
Introduction
Keeping pace with the global demand for metals and minerals requires ongoing discovery of new ore deposits. Following the selection of target areas using geological and other criteria, a program of mineral exploration incorporates geophysical tech-niques such as magnetic, electromagnetic, or gravity surveys followed by drilling. In some cases, in which impedance con-trasts between a target and host are sufficient, active seismic-reflection surveys have been used as an intermediary imaging step (Salisbury and Snyder, 2007; Malehmir et al., 2012), but active seismic sources (e.g., vibrating trucks or explosive shots) are expensive and difficult to operate in remote or environmen-tally sensitive areas. In recent years, passive seismic imaging using dense surface arrays has emerged as a low-cost and envi-ronmentally friendly approach for exploring the subsurface.
First proposed byClaerbout (1968)for vertical propagation of seismic waves within the framework of reflection seismic
exploration, seismic interferometry typically refers to the retrieval of the seismic wavefield at one receiver as if there were a virtual source at another. It has since been demonstrated that some components of this seismic response (or Green’s func-tion) can be estimated through the temporal cross correlation of ambient seismic noise recordings between sensor pairs (Lobkis and Weaver, 2001;Roux and Kuperman, 2004;Shapiro and Campillo, 2004;Snieder, 2004;Wapenaar, 2004).
With sensor arrays typically deployed on the Earth’s surface, research has mainly focused on imaging with surface-wave
1. Institut des Sciences de la Terre, Université Grenoble Alpes, Grenoble, France; 2. SisProbe, Grenoble, France; 3. Stillwater Canada, Thunder Bay, Ontario, Canada; 4. Dublin Institute of Advanced Studies, Dublin, Ireland; 5. Institute of Mine Seismology, Hobart, Tasmania, Australia; 6. CODES and School of Physical Sciences, University of Tasmania, Hobart, Tasmania, Australia
*Corresponding author: pdales@gmail.com © Seismological Society of America
arrivals (Sabra et al., 2005;Shapiro et al., 2005;Campillo, 2006;
Brenguier et al., 2007; Nishida et al., 2009; Lin et al., 2013), which are easier to recover due to their large amplitudes rel-ative to body-wave arrivals. There has also been success in recovering body-wave arrivals at local (Nakata et al., 2015,
2016; Olivier et al., 2015; Brenguier et al., 2019), regional (Ruigrok et al., 2011; Poli et al., 2012), and global scales (Boué et al., 2013; Nishida, 2013) through distance binning and stacking of cross-correlation functions (CCFs) to enhance the signal-to-noise ratio.
For high-resolution imaging of geologic structure at depth, as is the case in exploration seismology, reflected body-wave arrivals remain the most useful. Unfortunately, these arrivals prove very difficult to extract from passive datasets due to the unavailability of high-frequency body-wave sources. Nonetheless, some studies have produced promising results in recovering reflected body waves (Draganov et al., 2009,
2013; Nakata et al., 2011; Almagro Vidal et al., 2014;
Quiros et al., 2016). Although ambient recordings typically refer to the background seismic energy generated by natural sources, we use the term“passive” to include any sources that we do not control (e.g., trains, traffic, and earthquakes). At the exploration scale, successful recovery of body waves relies heavily on the availability and distribution of these passive sources, which are unique to each study site. The nature of these passive sources will also dictate the most appropriate method for recovering the virtual reflection response.
For retrieval of body-wave reflections, the theory requires only sources in the subsurface (Wapenaar, 2004). Therefore, when processing recordings from a surface array, the goal is to maximize the ratio of body- to surface-wave energy, espe-cially body-wave energy with high-incident angles (i.e., that coming from below the array). For example, when there exists sufficient time-separable sources, such as microearthquakes, they can be used directly for imaging (Reshetnikov et al., 2010;
Chaput et al., 2012,2015). When sources are not time sepa-rable, it is still possible to evaluate noise over time to select periods when there exists high ratios of body- to surface-wave energy based on apparent velocity analysis (Draganov et al., 2013; Almagro Vidal et al., 2014; Cheraghi et al., 2015;
Chamarczuk et al., 2019). There are also many studies that uti-lize trains passing on nearby railways as strong sources of body-wave energy (Quiros et al., 2016;Brenguier et al., 2019). When using sources at the surface to recover body-wave reflec-tions, care must be taken, as nonphysical arrivals will also be retrieved, such as nonphysical reflections (Draganov et al., 2012; King and Curtis, 2012; Löer et al., 2014) and virtual refractions (Dong et al., 2006;Mikesell et al., 2009). The most appropriate way to construct the virtual shot gathers depends on the availability and characteristics of the passive sources and the imaging goal.
In this work, we introduce the Marathon dataset, which should prove useful for developing techniques to perform
passive reflection imaging for exploration. In theDataset sec-tion, we describe the study area and dataset. In the following section, we locate and characterize the sources of body-wave energy. Next, we demonstrate how to selectively stack time periods to isolate traffic sources and construct virtual shot gathers. We then analyze the apparent arrival velocities of body waves along the dense station line and demonstrate how they are influenced by the local geologic structure. Finally, we dis-cuss the challenges of passive reflection imaging and the future work needed.
Dataset
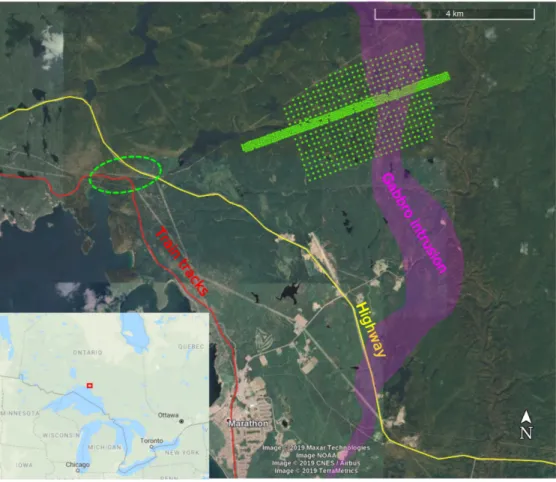
The Marathon dataset (seeData and Resources) consists of 30 days (21 September to 22 October 2018) of continuous seismic recordings from a 1020 node (single-component 10 Hz geo-phones recording at 250 Hz) surface array deployed over a roughly area near Marathon, Ontario in Canada (Fig.1). This area corresponds to an existing mineral exploration block where the potential targets are high concentrations of platinum group metals and minor Cu hosted in a gabbro intrusion (Fig. 2). The targets are lenses and irregular bodies up to 200 m in strike length and 25 m thick containing sparsely dis-seminated sulfides in more mafic (olivine-rich) lithologies. For a more detailed discussion of the local geology, seeGood et al. (2015). Because there has only been drilling down to a few hundred meters around the gabbro surface contact, the deeper geologic structure, in particular, the thickness and dip of the intrusion and the geometry of the lower contact, is largely unknown. The velocities of the geologic units are estimated from lab measurements of the drill cores and surface-wave dispersion.
The study site is situated on the Canadian shield and is mostly forested, with very little overburden. We expect no anthropogenic activity within the deployment area, except for occasional off-road vehicles. There is also a low-traffic airport nearby and an active underground mine 30 km away. We expect the main sources of high-frequency energy to be traffic on the nearby highway and railroad.
The ability of seismic-reflection surveys to detect ore depos-its is determined by the impedance contrast (ore vs. the host rock) and the geometry of the deposit (size and depth of burial) relative to the seismic-source frequency (see Salisbury and Snyder, 2007, for more detailed explanation). In our case, the zero-offset reflection coefficients (seen in Fig.2) are sufficient with especially strong contrasts between the host intrusion and the hangingwall (0.14) and footwall (0.16) (Salisbury and Snyder, 2007recommends above 0.06 in practice). It is unlikely we will be able to image the mineralized zones directly due to their low-impedance contrasts (0.05) and expected sizes less than the minimum wavelengths we hope to recover from the ambient noise (180 m wavelength for 30 Hz P wave in gab-bro). In this case, the mineralization would require a minimum thickness of around 50 m (Rayleigh limit), and a minimum
width of around 180 m (Salisbury and Snyder, 2007
states that, in practice and under ideal conditions, deposits across one wavelength can be detected as diffractors). In addi-tion, the mineralization consists of a small fraction of dissemi-nated platinum minerals-bear-ing sulfides in concentrations that are too low (usually less than 10%) to influence the impedance contrast. The main goal of the survey is therefore to image the basal contact of the host intrusion to constrain in which potential mineraliza-tion could occur.
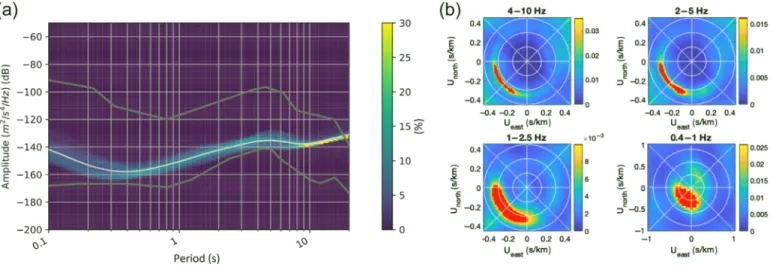
Low-frequency (below 10 Hz) properties of the passive seismic recordings can be seen in Figure 3. Below 2 Hz, the signals are dominated by sur-face waves generated on the shores of the nearby Lake Superior. Between 5 and 10 Hz, the energy is a combination of surface-wave energy from the lake and nearby traffic. The high-frequency portion (above 10 Hz) of the passive record-ings are analyzed in the follow-ing section.
Data Processing
and Results
To characterize the passive seismic wavefield at higher frequencies, we applied a plane-wave cross-correlation beamforming method (similar to illumination diagnosis, see
Almagro Vidal et al., 2014;
Chamarczuk et al., 2019) using a subarray and 1 min time windows filtered between 15 and 40 Hz (results in Fig. 4). The small size of the subarray (50 stations) was chosen, so that incoming waves from nearby traffic would still appear relatively planar. For each time window, we use
Figure 2. Simplified cartoon cross-section (along the dense line from Fig.1) of the local geology. The targets of interest are small lenses rich in Cu-platinum group metal (PGM; shown in gold) hosted in a gabbro intrusion (purple). The depth and thickness of the layers is estimated from drill-core data constraining only the first few hundred meters near the intrusion surface contact (gray shaded area). Also plotted are the zero-offset reflection coefficients of the different contacts (e.g., the syenite–gabbro contact has a reflection coefficient of 0.14). The color version of this figure is available only in the electronic edition.
Figure 1. Map of the study area, which is located just north of Marathon, Ontario, Canada. The 1020 node surface geophone array (green dots) has 150 m spacing except for the dense middle line, which has 50 m spacing. The purple shaded region shows the mapped surface contact of the gabbro intrusion, which hosts the target mineralization. The green dashed circle outlines the vehicle source locations used for selective stacking of cross-correlation functions (CCFs). The location of the study area is outline by a red box in the inset. The color version of this figure is available only in the electronic edition.
cross correlations between all station pairs within the subarray to perform a grid search for maximum beam power over all azimuths and velocities. Because the search is only over surface azimuths, any arrivals from below will have a high apparent velocity related to the angle of incidence.
It can be seen in Figure 4 that high-frequency seismic energy comes predominantly from the railway and highway. The dominant arrival with apparent velocities of 3600 m=s suggests that we are recording either direct S waves arriving with about a 20° angle of incidence with the surface or non-physical arrivals (discussed further on). Another interesting feature is the very-fast (7000 m=s) arrivals near 250° of azi-muth, which we believe are either reflected or refracted P-wave arrivals. Below 12 Hz, we only see surface-wave arrivals with apparent velocities around 2300 m=s. The dominance of body waves above 12 Hz can be explained by the more rapid attenu-ation of the high-frequency surface waves, which typically travel in the shallow and lower-quality material. Because this effect becomes more pronounced with propagation distance, the arrivals would have been more difficult to separate if the railway and highway were closer to the array. Although not explicitly shown, we also see weak body-wave arrivals from blasting events at a mine 30 km southeast of the array. If the mine were closer and blasting more frequent, we would con-sider using the coda of these events to construct the virtual shot gathers. From these results, we conclude that trains and cars, which pass the array, are the most significant sources of body-wave energy during this 30-day period.
To compute the final CCFs (or virtual shot gathers), we compare two different approaches of selectively stacking the individual 1 min CCFs: (1) selective stacking of CCFs com-puted during time periods, in which there is no clear direction-ality in the noise; and (2) selective stacking of CCFs when vehicles (trains and cars) are passing nearby the array.
Preprocessing of the CCFs is the same for both approaches and only involves spectral whitening and tapering of the 1 min time windows prior to cross correlation. Although not shown
here, the results using one-bit normalization were similar. We do not, however, recommend one-bit normalization, unless there is good justification for why it could potentially enhance body-wave arrivals. To visualize the results, we arrange the final stacked CCFs in common midpoint (CMP) gathers com-puted by interstation distance binning (in 20 m bins) and stacking CCFs for all station pairs along the dense line that share a CMP (midpoint is near the center of the dense line). Prior to distance bin stacking, certain CCFs are time-reversed based on interstation azimuth, so causal lag times always cor-respond to energy traveling up the array from southwest to northeast.
First, we consider selective stacking of time periods in which there is no clear directionality in the noise. This is achieved using a selective stacking metric based on the distribution of energy at different azimuths. We assume that periods in which seismic energy is evenly distributed across all azimuths will be closest to the theoretical diffuse wavefield conditions required to properly estimate seismic Green’s functions. These conditions are met for approximately four out of the 30 total days. The resulting virtual CMP gathers for a single midpoint (Fig. 5a) reveal dominance of surface-wave arrivals with very little energy above 20 Hz. Although the signal at causal lag times is much stronger (due to lack of sources north-east of the array), the arrivals appear symmetrical. We attribute the very weak body-wave arrivals during the “quiet” periods (20–60 Hz) to time periods when vehicular sources are present but too weak to create a strong noise directionality in an indi-vidual 1 min time window (and thus are incorrectly included in the stack).
Figure 3. (a) Probability power spectral density for station near center of array and (b) plane-wave beamforming results for the entire array. Both plots are averaged over the entire 30-day recording period. The color version of this figure is available only in the electronic edition.
Our second approach is to selectively stack CCFs when vehicles (trains and cars) are passing nearby the array. We also limit the azimuth to only keep periods when the vehicles are inline with the dense station line to ensure that the stationary-phase location is met for the majority of sensor pairs (green dashed area in Fig. 1). This results in keeping approximately 31 hr out of the 30 days. The advantage of this approach is that it results in well-understood sources that generate high-fre-quency body-wave energy. The resulting virtual CMP gathers (Fig.5b) reveal two main branches of body-wave arrivals, both of which have fast apparent velocities; the slower surface waves arrivals disappear almost completely above 20 Hz. The strong high-frequency body-wave arrivals that we observe are similar to those recorded in other studies modeling train radiation (Brenguier et al., 2019; F. Lavoué et al., unpublished manu-script, 2016, see Data and Resources). The linear moveout of these arrivals suggests they are either direct or refracted waves. Attempts to reveal reflected arrivals by stacking along hyperbolic moveouts were unsuccessful. Binning and stacking the individual shot records based on interstation distance are necessary to reveal these body-wave arrivals.
Although the surface-wave symmetry in the“quiet” virtual CMP gathers is encouraging, the lack of any clear direct body-wave arrivals suggests extracting the much weaker reflected body-wave arrivals would be very difficult. On the other hand, the clear body-wave arrivals in the“train” virtual shot gathers suggests that these signals should contain significant informa-tion on the reflecinforma-tion response. The main drawback of using
these vehicle sources is that there will be illumination, and thus retrieval of reflec-tions, only along the direction of the main sources of body-wave noise, in this case, the railway and the highway.
Although the virtual CMP gathers in Figure 5 show the arrivals for a single midpoint, it is interesting to see how these apparent arrival velocities change along the dense line. To visualize this, we perform a velocity slant-stack for virtual CMP gathers (constructed from vehicle periods) along the dense line (Fig. 6). Slant stacking aims at measuring the coherent summation at dif-ferent velocities and results in a single column for each CMP gather. For example, the col-umn highlighted by the green dashed line in Figure 6 corre-sponds to a slant stack of the bottom-right virtual CMP gather in Figure5. We restrict the stacking to traces with interstation distances between 500 and 1500 m in each CMP gather. The lower bound is chosen to ensure separation of the fast-arrival branches, which is only achieved on pairs with interstation dis-tance over 500 m. The upper bound is based on the assumption that lateral variations in geologic structure degrade coherent summation in the slant-stack procedure.
Discussion
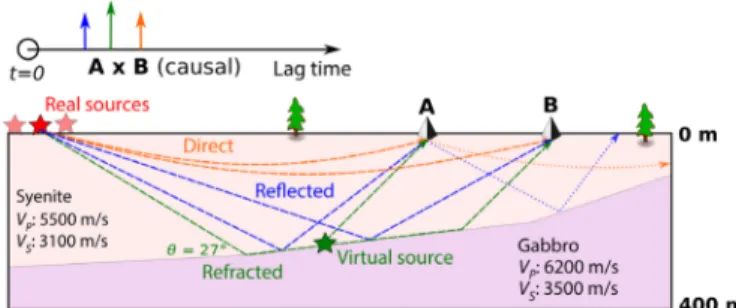
To assist in our interpretation of these observed arrival veloc-ities, a cartoon depiction of the different possible body-wave arrivals can be seen in Figure7in which vehicular traffic (red stars) radiates body-wave energy, which travels along direct, reflected, and refracted paths (dashed lines) to arrive at stations A and B. For station A, to act as a virtual source of direct and reflected body waves, station B would need to be located along the orange or blue dotted paths, respectively. As demonstrated for this pair, and what is most often the case, is that the kin-ematics are incorrect for the direct and reflected body waves. What is special about the refraction (Dong et al., 2006;Mikesell et al., 2009) is that the kinematics will always be correct, regardless of the source location and station pair. Therefore, as long as the vehicle sources are in line with the dense station line, the lateral position of the source is not important, as the time difference of the virtual refraction arrival for a given sta-tion pair will remain the same. This suggests that after cross correlation and stacking over many source locations, the virtual
Figure 4. Beamforming results computed for the 30 days of continuous recordings between 15 and 40 Hz. (a) Scatter plot of beamforming results for 30 days showing the slowness and azimuth corresponding to the maximum beam power for each 1 min time window. Note the velocities for many time periods are higher than the expected true velocities (dashed lines) in the syenite layer. (b) Map showing the relative incoming energy at each azimuth (blue circles) over the 30-day period centered around the 50 station subarray used for the beamforming (red dots). Note the patterns with respect to the highway and railway (yellow and red line, respectively). The color version of this figure is available only in the electronic edition.
refraction arrival should be the strongest. Although coherent summation will still occur for the direct and reflected body waves, it is restricted to specific source-station geometries.
Following this reasoning, we believe the main branch around 3500 m=s, annotated by (1) in Figure 6, is not the direct–direct S-wave correlation, but is instead the virtual S-wave refraction. Assuming a homogeneous syenite layer, refraction off a flat interface directly estimates the velocity of the underlying unit, in this case, the gabbro, which has an esti-mated velocity matching our measured velocity. In addition, if this arrival was the direct–direct S-wave correlation, we would expect the highest slant-stack amplitudes (colored dots in Fig.6) to be closest to the vehicular sources, which is not the case.
This interpretation is also supported by the appearance of the 7500 m=s branch (annotated by (2) in Fig.6), which we believe is the virtual refracted P-wave arrival. Apart from inter-action with a dipping layer, the P-wave arrivals should be almost nonexistent due to the geometry (vertical-component geophones recording surface sources) and low-velocity gra-dient in the upper layer. We believe its appearance around 3200 m along the dense line is due to the increasing slope of the gabbro contact, causing refracted waves to arrive with a steeper angle at the surface. Based on our estimated velocities of the syenite and gabbro, a contact slope of about 10° above
horizontal would match the observed apparent refraction velocity of 7500 m=s. We are still unsure of the geologic struc-ture, which would cause the relative P-wave dominance we observe between 2200 and 2600 m along the dense line (anno-tated by (2) in Fig.6). Our best guess would be some disconti-nuity in the contact creating more vertically traveling energy. The increasing apparent velocities of both the S- and P-wave virtual refraction branches (2 and 3) approaching the gabbro surface contact can be explained by a steepening of the contact to a maximum of 13°. Although drill measurement suggests a much steeper contact nearing the surface (as seen in
Figure 5. Virtual common midpoint (CMP) gathers for the dense line selectively stacking only. (a) CCFs for“quiet” time periods in which there is no obvious noise directionality and (b) periods when rail or highway traffic is passing the dense line. Note the relative dominance of the faster body-wave arrivals for the train periods compared to the surface-wave dominance for the quiet periods. These CMP gathers are computed by distance binning (20 m bins) and stacking CCFs for all station pairs along the dense line that share a CMP. All panels use the same midpoint, which is near the center of the dense line. The CCFs are arranged so causal lag-times correspond to energy traveling up the array from southwest to northeast. The color version of this figure is available only in the electronic edition.
Fig.2), the high level of spatial smoothing from slant-stacking pairs up to 1500 m apart would make this difficult to observe. Another interesting feature is that the highest energy traces have midpoints close to the gabbro surface contact, suggesting energy is trapped and/or focused in this area (annotated by (3) in Fig.6). Although not shown here, we also observe this effect in simulations of elastic wave propagation with similar geologic structure. Further experimentation is needed to determine the exact nature of this effect.
We expect this type of situation (vehicle sources illuminat-ing array within narrow azimuth) will be relatively common in exploration campaigns. Unless the exploration area is near active mining, volcanoes or fault systems, the best available sources of high-frequency seismic energy will likely be cars, trains, and other anthropogenic surface sources. These sources are also likely to be irregularly distributed, illuminating the array in a limited azimuth and limiting the effectiveness of tra-ditional imaging techniques.
In these cases, in which the diffuse wavefield conditions nec-essary to estimate the seismic Green’s functions are absent, a more practical approach must be taken and tailored to the available body-wave arrivals. In our case, the biggest challenge was properly interpreting the observed arrival branches in the virtual shot gath-ers. Without some knowledge of the sources of seismic energy and the local geologic structure, this would have been very diffi-cult. Fortunately, beamforming can be used to locate sources, and the general geology in exploration areas is usually known. The nature of these arrivals will then dictate the appropriate algorithm to migrate the virtual shot gathers and image the subsurface.
Conclusion
In this work, we used the Marathon dataset, a new and soon to be publicly available passive seismic dataset, to evaluate the application of passive interferometry for subsurface imaging in a mineral exploration context. After examining the proper-ties of the noise, we found that nearby highway and railway traffic are the main sources of high-frequency body-wave energy. We constructed virtual shot gathers by selectively stacking and comparing both quiet time periods and time peri-ods when traffic was passing nearby the array. The virtual shot gathers for the quiet time periods are dominated by surface waves and lack body-wave energy necessary for reflection imaging. The virtual shot gathers constructed for the vehicle time periods have significant body-wave energy, even at higher frequencies. We then analyzed the apparent velocities of the body waves at different locations along the dense line and related our observations to the local geologic structure. From this analysis, it is most likely that the observed body-wave arrivals correspond to virtual refractions off the syenite–gabbro contact. The apparent velocities of these refracted arrivals are also consistent with the dipping gabbro intrusion. The next step will be to use these measurements to invert for the depth, dip, and seismic velocities of the syenite–gabbro contact. This information will be helpful for constraining where mineraliza-tion could potentially occur.
Data and Resources
The Marathon dataset will be made publicly available on June 2021. It will either be hosted online or freely sent on external hard disks upon request via the website of passive seismic techniques for envi-ronmentally friendly and cost efficient mineral exploration (PACIFIC) (https://www.pacific-h2020.eu, last accessed May 2020). Figure 7. Cartoon depiction of the expected body-wave arrivals for station pair A–B given a source located at the red star and a two-layer model. The correlation of the arrivals recorded at each station is quite complex due to the multiple arrivals, phases (P and S waves), and cross terms between the different arrivals. In this case, the kinematics are correct for the virtual refraction (green) but not for the direct (orange) and reflected (blue) body waves whose failed paths are shown by dotted lines. The color version of this figure is available only in the electronic edition. Figure 6. Image resulting from slant-stacking virtual CMP gathers
(20–60 Hz) for different midpoints along the dense station line (gray scale represents amplitudes with white being high positive). The maximum value for each column is denoted by a scatter point with color corresponding to the relative strength of that maximum (red is high). Pink dashed lines indicate estimated surface contact of the gabbro intrusion. The column highlighted by the green dashed line corresponds to the slant-stack of the bottom-right virtual CMP gather in Figure5. The image features annotated by numbers are discussed in theDiscussionsection. The color version of this figure is available only in the electronic edition.
The unpublished manuscript by F. Lavoué, O. Coutant, F. Brenguier, P. Boué, L. Pinzon-Rincon, and P. Dales, (2020).“Modelling of long-range seismic waves generated by train traffic” was submitted to Geophysics.
Acknowledgments
This project has received funding from the European Union’s Horizon 2020 research and innovation program under Grant Agreement Number 776622 (PACIFIC) and from the European Research Council (ERC) under Grant Agreement Number 817803 (FaultScan).
References
Almagro Vidal, C., D. Draganov, J. van der Neut, G. Drijkoningen, and K. Wapenaar (2014). Retrieval of reflections from ambient noise using illumination diagnosis, Geophys. J. Int. 198, no. 3, 1572–1584, doi:10.1093/gji/ggu164.
Boué, P., P. Poli, M. Campillo, H. Pedersen, X. Briand, and P. Roux (2013). Teleseismic correlations of ambient seismic noise for deep global imaging of the earth, Geophys. J. Int. 194, no. 2, 844–848.
Brenguier, F., P. Boué, Y. Ben-Zion, F. Vernon, C. Johnson, A. Mordret, O. Coutant, P.-E. Share, E. Beaucé, D. Hollis, et al. (2019). Train traffic as a powerful noise source for monitoring active faults with seismic interferometry, Geophys. Res. Lett. 46, 9529–9536, doi:10.1029/2019GL083438.
Brenguier, F., N. M. Shapiro, M. Campillo, A. Nercessian, and V. Ferrazzini (2007). 3-D surface wave tomography of the piton de la fournaise volcano using seismic noise correlations, Geophys. Res. Lett.34, no. 2, doi:10.1029/2006GL028586.
Campillo, M. (2006). Phase and correlation in‘random’ seismic fields and the reconstruction of the green function, Pure Appl. Geophys. 163, no. 2, 475–502, doi:10.1007/s00024-005-0032-8.
Chamarczuk, M., M. Malinowski, Y. Nishitsuji, J. Thorbecke, E. Koivisto, S. Heinonen, S. Juurela, M. Mezyk, and D. Draganov (2019). Automatic 3D illumination-diagnosis method for large-n arrays: Robust data scanner and machine-learning feature pro-vider, Geophysics84, no. 3, Q13–Q25.
Chaput, J., M. Campillo, R. Aster, P. Roux, P. Kyle, H. Knox, and P. Czoski (2015). Multiple scattering from icequakes at Erebus vol-cano, Antarctica: Implications for imaging at glaciated volcanoes, J. Geophys. Res.120, no. 2, 1129–1141.
Chaput, J., D. Zandomeneghi, R. Aster, H. Knox, and P. Kyle (2012). Imaging of Erebus volcano using body wave seismic interferometry of Strombolian eruption coda, Geophys. Res. Lett.39, no. 7, doi:
10.1029/2012GL050956.
Cheraghi, S., J. A. Craven, and G. Bellefleur (2015). Feasibility of vir-tual source reflection seismology using interferometry for mineral exploration: A test study in the Lalor Lake volcanogenic massive sulphide mining area, Manitoba, Canada, Geophys. Prospect.63, no. 4, 833–848.
Claerbout, J. F. (1968). Synthesis of a layered medium from its acous-tic transmission response, Geophysics 33, no. 2, 264–269, doi:
10.1190/1.1439927.
Dong, S., J. Sheng, and G. T. Schuster (2006). Theory and practice of refraction interferometry, in SEG Technical Program Expanded Abstracts 2006, Society of Exploration Geophysicists, 3021– 3025, doi:10.1190/1.2370154.
Draganov, D., X. Campman, J. Thorbecke, A. Verdel, and K. Wapenaar (2009). Reflection images from ambient seismic noise, Geophysics74, no. 5, A63–A67.
Draganov, D., X. Campman, J. Thorbecke, A. Verdel, and K. Wapenaar (2013). Seismic exploration-scale velocities and structure from ambi-ent seismic noise (>1 Hz), J. Geophys. Res. 118, no. 8, 4345–4360. Draganov, D., K. Heller, and R. Ghose (2012). Monitoring CO2
stor-age using ghost reflections retrieved from seismic interferometry, Int. J. Greenh. Gas Con.11, S35–S46.
Good, D. J., R. Epstein, K. McLean, R. L. Linnen, and I. M. Samson (2015). Evolution of the main zone at the Marathon Cu-PGE sul-fide deposit, midcontinent rift, Canada: Spatial relationships in a magma conduit setting, Econ. Geol.110, no. 4, 983, doi:10.2113/ econgeo.110.4.983.
King, S., and A. Curtis (2012). Suppressing nonphysical reflections in Green’s function estimates using source-receiver interferometry, Geophysics77, no. 1, Q15–Q25.
Lin, F.-C., D. Li, R. W. Clayton, and D. Hollis (2013). High-resolution 3D shallow crustal structure in Long Beach, California: Application of ambient noise tomography on a dense seismic arraynoise tomogra-phy with a dense array, Geotomogra-physics78, no. 4, Q45–Q56.
Lobkis, O. I., and R. L. Weaver (2001). On the emergence of the Green’s function in the correlations of a diffuse field, J. Acoust. Soc. Am.110, no. 6, 3011–3017, doi:10.1121/1.1417528. Löer, K., G. A. Meles, A. Curtis, and I. Vasconcelos (2014). Diffracted
and pseudo-physical waves from spatially limited arrays using source–receiver interferometry (SRI), Geophys. J. Int. 196, no. 2, 1043–1059.
Malehmir, A., M. Urosevic, G. Bellefleur, C. Juhlin, and B. Milkereit (2012). Seismic methods in mineral exploration and mine plan-ning—Introduction, Geophysics 77, no. 5, WC1–WC2, doi:
10.1190/2012-0724-SPSEIN.1.
Mikesell, D., K. van Wijk, A. Calvert, and M. Haney (2009). The vir-tual refraction: Useful spurious energy in seismic interferometry, Geophysics74, no. 3, A13–A17.
Nakata, N., P. Boué, F. Brenguier, P. Roux, V. Ferrazzini, and M. Campillo (2016). Body and surface wave reconstruction from seis-mic noise correlations between arrays at Piton de la Fournaise volcano, Geophys. Res. Lett.43, no. 3, 1047–1054.
Nakata, N., J. P. Chang, J. F. Lawrence, and P. Boué (2015). Body wave extraction and tomography at Long Beach, California, with ambi-ent-noise interferometry, J. Geophys. Res.120, no. 2, 1159–1173. Nakata, N., R. Snieder, T. Tsuji, K. Larner, and T. Matsuoka (2011). Shear wave imaging from traffic noise using seismic interferometry by cross-coherence, Geophysics76, no. 6, SA97–SA106.
Nishida, K. (2013). Global propagation of body waves revealed by cross-correlation analysis of seismic hum, Geophys. Res. Lett.40, no. 9, 1691–1696.
Nishida, K., J.-P. Montagner, and H. Kawakatsu (2009). Global surface wave tomography using seismic hum, Science326, no. 5949, 112. Olivier, G., F. Brenguier, M. Campillo, R. Lynch, and P. Roux (2015). Body-wave reconstruction from ambient seismic noise correla-tions in an underground mine, Geophysics80, no. 3, KS11–KS25, doi:10.1190/geo2014-0299.1.
Poli, P., M. Campillo, H. Pedersen, and LAPNET Working Group (2012). Body-wave imaging of earth’s mantle discontinuities from ambient seismic noise, Science338, no. 6110, 1063–1065.
Quiros, D. A., L. D. Brown, and D. Kim (2016). Seismic interfero-metry of railroad induced ground motions: Body and surface wave imaging, Geophys. J. Int. 205, no. 1, 301–313, doi: 10.1093/gji/ ggw033.
Reshetnikov, A., S. Buske, and S. Shapiro (2010). Seismic imaging using microseismic events: Results from the San Andreas fault system at SAFOD, J. Geophys. Res. 115, no. B12, doi:10.1029/ 2009JB007049.
Roux, P., and W. A. Kuperman (2004). Extracting coherent wave fronts from acoustic ambient noise in the ocean, J. Acoust. Soc. Am.116, no. 4, 1995–2003, doi:10.1121/1.1797754.
Ruigrok, E., X. Campman, and K. Wapenaar (2011). Extraction of P-wave reflections from microseisms, Compt. Rendus Geosci.343, no. 8/9, 512–525.
Sabra, K. G., P. Roux, and W. A. Kuperman (2005). Emergence rate of the time-domain Green’s function from the ambient noise cross-correlation function, J. Acoust. Soc. Am.118, no. 6, 3524–3531, doi:
10.1121/1.2109059.
Salisbury, M., and D. Snyder (2007). Application of seismic methods to mineral exploration, in Mineral Deposits of Canada: A Synthesis
of Major Deposit-Types, District Metallogeny, the Evolution of Geological Provinces, and Exploration Methods, W. D. Goodfellow (Editor), Vol. 1, Mineral Deposits Division, Geological Association of Canada, Special Publication no. 5, 971–982.
Shapiro, N. M., and M. Campillo (2004). Emergence of broadband Rayleigh waves from correlations of the ambient seismic noise, Geophys. Res. Lett.31, no. 7, doi:10.1029/2004GL019491. Shapiro, N. M., M. Campillo, L. Stehly, and M. H. Ritzwoller (2005).
High-resolution surface-wave tomography from ambient seismic noise, Science307, no. 5715, 1615–1618.
Snieder, R. (2004). Extracting the Green’s function from the correla-tion of coda waves: A derivacorrela-tion based on stacorrela-tionary phase, Phys. Rev. E 69, 046,610, doi:10.1103/PhysRevE.69.046610.
Wapenaar, K. (2004). Retrieving the elastodynamic Green’s function of an arbitrary inhomogeneous medium by cross correlation, Phys. Rev. Lett.93, no. 25, 254,301.
Manuscript received 17 January 2020 Published online 3 June 2020