HAL Id: hal-02508275
https://hal.archives-ouvertes.fr/hal-02508275
Submitted on 22 Mar 2020
HAL is a multi-disciplinary open access
archive for the deposit and dissemination of sci-entific research documents, whether they are pub-lished or not. The documents may come from teaching and research institutions in France or abroad, or from public or private research centers.
L’archive ouverte pluridisciplinaire HAL, est destinée au dépôt et à la diffusion de documents scientifiques de niveau recherche, publiés ou non, émanant des établissements d’enseignement et de recherche français ou étrangers, des laboratoires publics ou privés.
Africa: Case of Niger
Mamane Barkawi Mansour Badamassi, El-Aboudi Ahmed, Paul Gérard
Gbetkom
To cite this version:
Mamane Barkawi Mansour Badamassi, El-Aboudi Ahmed, Paul Gérard Gbetkom. A New Agricultural Drought Index to Better Detect and Monitor Millet Crop by Remote Sensing in West Africa: Case of Niger. Journal of Advanced Research in Dynamical and Control Systems, Institute of Advanced Scientific Research, 2019, pp.1023-1033. �10.5373/JARDCS/V11SP11/20193132�. �hal-02508275�
DOI: 10.5373/JARDCS/V11SP11/20193132
ISSN 1943-023X 1023
Received: 23 Sep 2019/Accepted: 18 Oct 2019
A New Agricultural Drought Index to Better
Detect and Monitor Millet Crop by Remote
Sensing in West Africa: Case of Niger
Mansour Badamassi Mamane Barkawi*, Ph.D. Student in the Third Year Department of Biology Faculty of Science, Mohammed University, Ibn Batouta Avenue, Rabat, Morocco. E-mail: barkawimansour@gmail.com
El-Aboudi Ahmed, Professor of Higher Education (PES) Department of Biology Faculty of Science, Mohammed University, Rabat, Morocco.
Gbetkom Paul Gerard,Ph.D Student, Department of Geographic, Faculty of Arts, Letters, Languages, and Human Sciences, Aix Marseille University, Marseille, France.
Abstract--- In this paper, we propose to establish a remote sensing-based agricultural drought indicator named
Agricultural Drought Condition Index (ADCI) that will detect agricultural drought linked mainly to millet crops in the agricultural area of Niger. It is obtained by combining four key parameters: Precipitation Condition index (PCI), Evapotranspiration Condition Index (ETCI), Vegetation Condition Index (VCI) and Temperature Condition Index (TCI). PCI is used to reflect precipitation deficit (Du et al., 2013), VCI is used to reflect variations in the health status of vegetation, TCI is used to identify vegetation stress produced by high temperatures or excessive humidity and ETCI is used to reflect crop shortage. ADCI is calculated over the crop growth period (June to October) from 2003 to 2017 in the agricultural area of Niger. Then, a comparison analysis between the ADCI results and the millet crop yield was carried out. Based on these results, ADCI shows a very statistically significant correlation with the millet crop yield throughout the millet growth period (June-October) and it is strongly correlated with the VHI index but provided better drought conditions then VHI. This new index is quite powerful and capable to identify and monitor the agricultural drought related to the cultivation of millet.
Keywords--- Agricultural Drought, Agricultural Drought Condition Index (ADCI), Chirps, Modis, Principal
Component Analysis, Niger.
I. Introduction
Drought is one of the most dangerous natural phenomena that exists today. Many researchers like (Kogan 1997; Park et al 2004; Jang 2004) have been working on this topic. Its consequences can be disastrous even in highly developed countries. In Niger, the agricultural sector is very often threatened by chronic agricultural droughts followed by extensive damage (environmental degradation, financial crisis, loss of human life and animal). Agricultural drought is classified as a calamity that can affect the economy and society at regional to national extents (Wilhite, 2000). For example in Niger, the 2004 drought created a cereal deficit of -21% on the national agricultural production. The 2009 drought created a cereal deficit of -12% and that of 2011 a deficit of -18% (Michiels et al., 2012). The 2009 drought led to the loss of 2.7 million head of livestock by starvation, and an additional 357,000 animals were affected. The total value of the capital lost in the crisis attributable to the drought is approximately $ 805 million (Douglas and Sally, 2014).
Therefore, it is important to have a reliable and accurate tool that can correctly estimate the start, severity, and ending of a drought event to assist decision-making. Therefore, to better study the phenomenon of drought, it will be important to combine all aspects that can lead to drought. It have mainly two ways to calculate drought indices: from meteorological observation or from remote sensing data (Wilhite and Glantz 1985; Park et al 2004; Jang 2004). According to Rockström et al (2002), indicators resulting from meteorological observations are useful in rain farming. These indices are resulting from point data that are preferable for temporal monitoring at a point location but are not reliable in a spatial dimension. The disadvantage of meteorological data is that their use in a large area, as in our case, requires a high density of points which is difficult to obtain (Padhee et al., 2017). In addition, in order to know the spatial situations of drought from this data, an interpolation method is required (Du et al., 2013). However, according to Rhee et al (2010), the interpolation result is not always reliable because it can be affected by many factors. Therefore, indicators resulting from remote sensing is the ideal way for drought monitoring (Rhee et al., 2010). It offers a synoptic vision covering large areas instantly, high repetitiveness adapted to the monitoring of dynamic phenomena over time (Mishra and Singh, 2010).
According to the literature search, some drought-related indices or models have been established around the world. Leroux et al (2016) developed an empirical statistical model between the NDVI and the LST for the monitoring of rainfed crops over 11 years (2000 to 2011) at the scale of the Niamey Square Degree (NSD). The weakness of this model is that this area (NDS) is mainly dominated by agro-pastoral activities, with a mixture of livestock and crop cultivation (FEWS NET, 2011). Therefore, a pixel can contain several agricultural and pastoral information. Which explains the lower implementation of the model (Leroux et al. 2016). According to Sepulcre-Canto et al (2012), the most commonly used indices to identify agricultural drought resulting from remote sensing are the Vegetation Condition Index (VCI, Kogan 1995), the Temperature Condition Index (TCI, Kogan 1990) and the Vegetation Health Index (VHI, Kogan 2002). VCI is based on the relation between the current weekly value of NDVI and the values of NDVI that represent the best (NDVImax) and the worst (NDVImin) crop growth conditions for the period under consideration. About TCI, it represents the relationship between the current weekly value of Brightness Temperature (BT) and the temperature that occurred for the potential (BTmin) and stress (BTmax) crop conditions within the same period. This index provides useful information on the stress of vegetation due to water saturation. The VHI index was developed by the combination of VCI and TCI and is found to be more effective compared to other indices in monitoring vegetative drought (Kogan 1990; Kogan 2001). This index is used for various applications such as agricultural drought detection, drought duration, crop yields, and crop production during the growing season (Unganai and Kogan, 1998). VHI is the best known and most used agricultural drought index because of its ability to detect agricultural drought.
However, some improvements still need to be brought, because a good drought monitoring tool must take into account all components that could lead to drought. Thus, the interest of this research is to propose a new agricultural drought index, named Agricultural Drought Condition Index (ADCI), to better identify and monitor agricultural drought linked to Niger's main rain crop (millet crop). ADCI is based on the improvement of the VHI index (developed by Kogan 2002), it is obtained by integrating into the original VHI two key indicators on drought, precipitation through precipitation condition index (PCI) and evapotranspiration through evapotranspiration condition index (ETCI). We chose to use PCI because various studies (Farooq et al., 2009; Gago et al., 2015; Pérez-Blanco et al., 2016) showed that water stress has been proved to be a major cause for the occurrence of agricultural drought and PCI can be used to identify a precipitation deficit. ETCI is used to reflect crop shortage because according to Senay et al (2012) a decrease in rainfall leads to crop stress and reductions in Evapotranspiration (ET) and finally manifesting in the degradation of crops. This index was calculated over the millet crop growth period (June to October) from 2003 to 2017.
II. Study Area
Our study area corresponds to the agricultural area of Niger defined by the Ministry of Livestock, Fisheries and Animal Industries (FAO and SFW, 2010) through the study of (Terpend and Saley, 2005). This area is situated in the southern strip of Niger and extends from west to East between 12° and 15° north latitude and between 0° and 12° East longitude. It is crossed by the Niger River to the West over a length of 550 km (Fig.1).
Figure 1: Location of the Study Area. Source: Produced from the files "Administrative Limits‖
DOI: 10.5373/JARDCS/V11SP11/20193132
ISSN 1943-023X 1025
Received: 23 Sep 2019/Accepted: 18 Oct 2019
The majority of the population is concentrated in the southern part of the country because the climate is favourable to live and also for agricultural activities (Clara, 2011). Depending on the rainfall distribution (from south to north), the agricultural area includes four climatic areas. 1), Sudanian area receives an average annual rainfall higher of 600 mm and is characterized by agricultural potential not yet well exploited. 2), Sahelo-Sudanian area (between 400 mm and 600 mm), It is characterized by a strong agricultural potential rainfed and irrigated, Cereal crops are the most cultivated. 3), Sahelian area (between 300 mm and 400 mm), agriculture is widely practiced, especially pure cereals. 4), Saharo-Sahelian area (between 200 mm and 300 mm) (Fig.1), it is the transition between the Sahara and Sahel, with random rainfall (RECA, 2004).
III. Data and Method
3.1 Data
3.1.1 CHIRPS Precipitation
The Climate Hazards Group InfraRed Precipitation with Station (CHIRPS) is precipitation data from 1981 to the present. CHIRPS was developed to support the United States Agency for International Development's Famine Early Warning Systems Network, FEWS NET (Funk et al., 2015). The CHIRPS database, developed in 1981, incorporates images of space-based precipitation into a database of precipitation collected at ground stations around the world (Abdoulkarim et al., 2018). Each month's CHIRPS precipitation data is in mm with a spatial resolution of 0.05°×0.05° and near-global coverage (50°S and 50°N). In this research, CHIRPS precipitation data was downloaded from the CHG-Climate Hazards Group (http://chg.geog.ucsb.edu/data/chirps/) for each of the five (5) months (June to October) from 2003 to 2017. Then resampled to a 1 km resolution.
3.1.2. Normalized Difference Vegetation Index (NDVI)
NDVI has been considered by many scientists as one of the important parameters for crop yield and pasture production, agricultural field mapping and drought conditions (Justice et al., 1985; Hielkema et al., 1986; Dabrowska-Zielinska et al., 2002). MODIS (moderate resolution imaging spectroradiometer) can be used to develop NDVI imagery at different resolutions (250, 500, and 1000 m). In this research, NDVI monthly (MOD13A3, version v6 with 1 km resolution) was downloaded from the Land Processes Distributed Active Archive Center-LPDAAC (http://lpdaac.usgs.gov/) on the five (5) months of the Niger crop year from 2003 to 2017. For each of 5 months of each year, two tiles of the MODIS sinusoidal tiling system (h18v07 and h19v07) have been downloaded to cover the entire study area then after, the tiles are mosaicked to obtain a single image that corresponds to the NDVI of the month in question.
3.1.3 MODIS Land Surface Temperature (LST)
The MODIS LST (MOD11A2, version 6) product provides an average 8-day per-pixel Land Surface Temperature and Emissivity (LST&E) with a 1-kilometer spatial resolution in a 1,200 by 1,200 km grid (Wan et al., 2015). Thus, like the NDVI index, the eight-day LST (MOD11A2, v6) was downloaded from the same website as NDVI on the five (5) months of the Niger crop year from 2003 to 2017. A monthly LST of each month was calculated using the 8-day LST.
3.1.4 Actual Evapotranspiration (Eta)
Evapotranspiration (ET) is the combination of transpiration from vegetation and evaporation from soil. It is an important component of the hydrologic budget because it reflects the exchange of mass and energy between the soil-water-vegetation system and the atmosphere (Senay et al., 2012). Actual ET (ETa) is produced using the operational Simplified Surface Energy Balance (SSEBop) model (Senay et al., 2012) for 2003 to the present. The SSEBop setup is based on the Simplified Surface Energy Balance (SSEB) approach (Senay et al., 2011) (Senay et al., 2013) with unique parameterization for operational applications. It combines ET fractions generated from remotely sensed MODIS thermal imagery, acquired every 10 days, with reference ET using a thermal index approach. The original formulation of SSEB is based on the hot and cold pixel principles of SEBAL (Bastiaanssen et al., 1998) and METRIC (Allen et al., 2007) models. Actual ET (ETa) is affected by land cover type and condition, as well as soil moisture. The dependence of ETa on land cover and soil moisture, and its direct relationship with carbon dioxide assimilation in plants, makes it an important variable for monitoring drought, crop yield, and biomass a critical capability for decision-makers interested in food security, grain markets, water allocation, and carbon sequestration (Bastiaanssen et al., 2005). The actual ET data unit is millimeters (mm) with a spatial resolution of 1km and ranges from 0 to 1200. Thus, the ETa monthly (June to October) data from 2003 to 2017 was downloaded from the Famine Early Warning Systems Network (FEWS NET) portal https://earlywarning.usgs.gov/fews.
3.1.5 Crop Yield Data
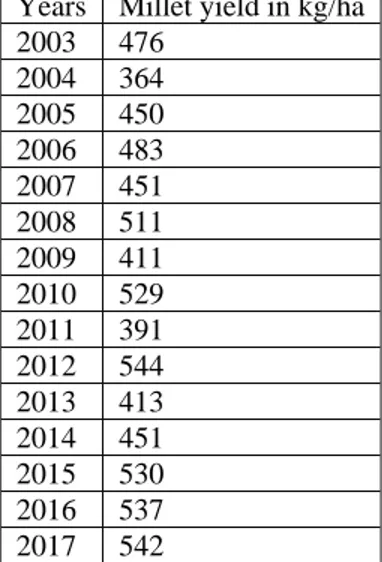
The aim of this research is not to predict crop yield but to monitor successfully agricultural drought conditions in the agricultural area of Niger. The correlations test between the ADCI and crop yield data were used to test and validate the possible use of this new ADCI index. The most crop affected by the agricultural drought and consumed by the people of Niger is millet (family of Pennisetum glaucum) (Sivakumar, 1992). Thus, annual data on crop yield of millet (in kg/ha) was obtained from the Directorate of Agricultural Statistics (DAS) attached to Niger's Ministry of Agriculture. These available data cover an interval of 15 years 2003 to 2017, Tab. 1.
Table 1: Annual Yield of Millet from 2003 to 2017 Years Millet yield in kg/ha
2003 476 2004 364 2005 450 2006 483 2007 451 2008 511 2009 411 2010 529 2011 391 2012 544 2013 413 2014 451 2015 530 2016 537 2017 542 3.2 Methodology
The methodological approach adopted is to propose an improvement of the vegetation health index (VHI) through the ADCI index to better detect the agricultural drought linked to the cultivation of millet in the agricultural area of Niger. To calculate this new index ADCI, we combined four condition indices using the principal component analysis (PCA) method: VCI, TCI, Precipitation Condition index (PCI), Evapotranspiration Condition Index (ETCI). PCI is defined as an index that can provide information of precipitation deficit (Du et al., 2013), VCI is used to reflect changes in the health status of vegetation (Kogan, 1995), TCI is used to detect vegetation stress caused by high temperatures or excessive humidity (Kogan, 1995b) and ETCI is used to reflect crop shortage (Senay et al., 2012). The combination of these four key parameters will allow us to better understand and detect drought in the agricultural area of Niger.
3.2.1 Principle of Calculation of Agricultural Drought Condition Index (ADCI)
In the context of monitoring agricultural drought, it is important to take into account the main factors that could lead to this drought. Therefore, this leads to the manipulation of many information at the same time with risks of information redundancy. Thus, the PCA is the ideal method for this combination. According to Avena et al (1999), PCA is a technique for removing or reducing the duplication or redundancy in multispectral images and for compressing all of the information that is contained in an original n-channel set of multispectral images into less than n channels or, more specifically, to their principal components.
Generally, the first principal component (PC1) at all times covers more than 75% information from the input data (Du et al., 2013) (PCI, VCI, TCI and ETCI in our case).
Thus, to better exploit the information from VCI, TCI, PCI, & ETCI and eliminate redundant information, we used this method to calculate ADCI (through ArcGis software) and PC1 is defined as a new index, ADCI, Eq.1.
(1)
PCI
PCI is a condition index that provides information about the meteorological drought (Du et al., 2013). Thus, using CHIRPS precipitation data, we calculated PCI by the same process of VCI to reflect precipitation shortage (Eq.2). As VCI and TCI, PCI also varies from 0 (unfavourable) to 100 (optimal), Tab.2.
DOI: 10.5373/JARDCS/V11SP11/20193132
ISSN 1943-023X 1027
Received: 23 Sep 2019/Accepted: 18 Oct 2019
(2)
Where CHIRPScurrent is the precipitation of the month under review, CHIRPSmin is the minimum precipitation
during the 2003-2017 period and CHIRPSmaxi is the maximum precipitation during the 2003-2017 period. Therefore,
a monthly PCI (June to October) during 2003-2017 over the agricultural area of Niger has been calculated.
VCI
VCI is an index of vegetation resulting from the maximum and minimum NDVI values. NDVI is calculated from spectral band reflectance (red and near-infrared). This index was developed to control local differences in ecosystem productivity (Du et al., 2013). This index changes from 0 (very poor) and 100 (optimal), Tab.2. For example, for our study period (2003-2017), calculating the June 2003 VCI amounts to showing the vegetation behaviour of June 2003 compared to the other 15 months of June in the series. VCI is obtained by Eq.3. Thus, from 2003 to 2017 monthly VCI (June to October) has been produced.
(3)
Where NDVIcurrent is the NDVI of the month under review, NDVImaxi is the maximum NDVI during the
2003-2017 period and NDVImin is the minimum NDVI during the 2003-2017 period.
TCI
TCI is developed by (Kogan, 1995b). It has the capacity to detect variations in vegetation behavior in the event of relative temperature variation (Kogan, 2002). It is commonly used to detect vegetation stress caused by high temperatures or excessive humidity. As VCI, TCI also changes from 0 (very poor) and 100 (optimal), Tab. 2. The low TCI values represent water stress conditions while the high TCI values represent conditions where there is no water stress (Kogan, 1995b). TCI is obtained by Eq.4.
(4)
Where LSTmaxi is the maximum land surface temperature-day during the study period 2003-2017, LSTcurrent is the
land surface temperature (LST-day) of the month under review and LSTmin is the minimum land surface
temperature-day during the study period 2003-2017.
Thus, a dataset of the VHI index was calculated over five (5) months (June to October) from 2003 to 2017.
ETCI
The actual ET is of interest to agriculture, water resources because it is an indicator of the crop water deficit (Allen et al., 2007). ETCI was used to reflect crops' water deficit in the agricultural area of Niger. It is obtained by Eq. 5 using the same process of TCI. ETCI also changes from 0 to 100, corresponding to changes in ET from unfavourable (0) to optimal (100), Tab.2.
(5)
Where ETamax is the maximum actual evapotranspiration during the 2003-2017 period, ETacurrent is the actual
evapotranspiration of the month under review and ETamin the minimum actual Evapotranspiration during the
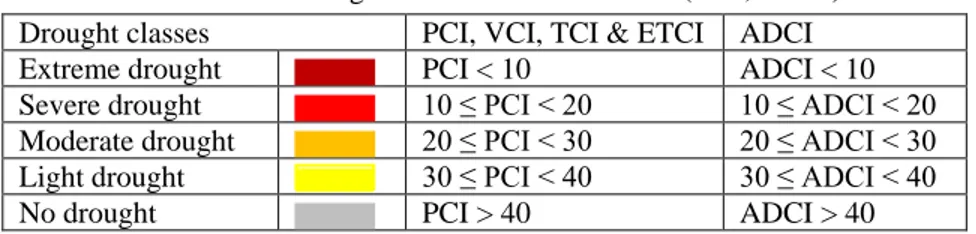
2003-2017 period. Thus, using the ETa data, a monthly of ETCI (June to October) during 2003-2003-2017 has been calculated. Table 2: The Drought Classification Schemes (VCI, ADCI)
Drought classes PCI, VCI, TCI & ETCI ADCI Extreme drought PCI < 10 ADCI < 10 Severe drought 10 ≤ PCI < 20 10 ≤ ADCI < 20 Moderate drought 20 ≤ PCI < 30 20 ≤ ADCI < 30 Light drought 30 ≤ PCI < 40 30 ≤ ADCI < 40 No drought PCI > 40 ADCI > 40
3.2.2 Principle of Calculation of Vegetation Health Index (VHI)
This indicator combines NDVI (through Vegetation Condition Index, VCI) and LST (through Temperature Condition Index, TCI) to offer information on the health status of the vegetation. It is obtained by Eq.6 according to Kogan (2002).
(6)
IV. Results and Discussions
4.1 Agricultural Drought Monitoring from 2003 to 2017 Using ADCI and VHI Indices
In this section, it is a question to evaluate ADCI and VHI indices to define which of both indices can highlight the years of agricultural drought that Niger has experienced from 2003 to 2017. The index that will be able to highlight Niger's past droughts can be used to monitor Niger's future droughts.
The results show that ADCI and VHI are highly correlated (R2 = 0.62) during the millet growth period from 2003 to 2017 (Fig.2). The P-value < 0.0004 between ADCI and VHI is less than alpha (0.05), so the result of the correlation between ADCI and VHI is not a coincidence: the result of the correlation is statistically significant.
Figure 2: Annuals Evolution of ADCI, VHI Indices and Millet Crop Yield from 2003 to 2017
According to the studies of World Bank (2011) and Michiels et al. (2012), the great years of agricultural drought that Niger has experienced from 2000 to 20012 are 2004, 2009 and 2011. These droughts created, respectively an important cereal deficit of -21%, -12% and -18% on national production.
According to the results of the ADCI and VHI indices (Fig.2), it was found that ADCI highlighted the same years of droughts with two other year‘s drought in 2013 and 2014 while VHI highlighted only the 2009 drought (VHI < 40).
For both indices, the driest years during 2003-2017 was 2004 and 2009. The wettest years were 2005, 2010, 2012, 2016 and 2017 for both indices (Fig.2). However, for the years 2004, 2011, 2013 and 2014, ADCI indicates severe drought conditions (ADCI < 40), while VHI indicates no-drought conditions (VHI > 40). Moreover, for the years 2004 and 2009 ADCI show more drought conditions (ADCI = 35.75 for 2004, ADCI = 31.40 for 2009) than VHI (VHI = 40.11 for 2004, VHI = 33.46 for 2009).
During 2007-2008, ADCI and crop yield increased while VHI decreased. ADCI and crop yield changed consistently each other while VHI sometimes behaved differently, maybe because it does not use direct information from precipitation and/or evapotranspiration.
According to the study of Michiels et al. (2012), the years 2005, 2010 and 2012 have been years of the great food crises that Niger has undergone. However, according to our results from Fig.2, we find that these years have been favourable for agricultural activities (ADCI & VHI value > 40). This is explained by the fact that, from 2003 to 2017, the great years of drought that Niger experienced were mainly 2004, 2009 and 2011.
The repercussions of these years of drought were thus manifest in the following years, which explains the food crises of 2005, 2010 and 2012. Thus, it can be noted that ADCI is strongly correlated with VHI and ADCI makes it possible to better detect and monitor the agricultural drought then VHI. ADCI does not highlight food crises, because it is set up only to detect agricultural drought.
DOI: 10.5373/JARDCS/V11SP11/20193132
ISSN 1943-023X 1029
Received: 23 Sep 2019/Accepted: 18 Oct 2019
4.2 Agricultural Drought Mapping Using ADCI Index
Since the ADCI has better results than the VHI, ADCI is used to map and understand drought conditions that Niger has experienced in 2004, 2009, 201, 2013 and 2014.The ADCI‘s result shows that the 2004 drought, during June, the agricultural drought appeared mainly in the western part of Niger, characterized by states of extreme drought to moderate drought.
From July to August, the severity of the drought decreased, especially in August, probably due to the arrival of the rains. From September to October, the drought worsened from moderate droughts to extreme drought. The central and the western part of the agricultural area is the most severely affected by agricultural drought (Fig.3).
The 2009 drought was more severe than the 2004 drought dominated by intensity from severe to extreme drought throughout the millet's growth period (Fig.3). Indeed, according to (Michiels et al., 2012), 2009 was characterized by late rains and prolonged droughts that have seriously compromised agricultural production and led to serious degradation in the agricultural areas of the country. Even for the 2009 drought, the central and the western part of the agricultural area is the most severely affected by agricultural drought.
For the year 2011, the agricultural drought started from the western part of June then spread to the East part to October. The western part is much more affected by drought (Fig.3). The drought of 2011 was less threatening that 2009.
The drought of 2013 and 2014 occurred almost in the same way from June to October. During these two years, August does not show a drought. This may be because during August precipitation reaches its peak.
Thus, using the ADCI index, drought events were monitored from 2003 to 2017 using ADCI maps and its classification schemes. These results show that the central and western parts of the agricultural area of Niger are very susceptible to agricultural drought and, in general, drought begins from the western part and spreads to the central part until the eastern part. The event of drought can last during the entire period of growth.
4.3 Evaluation of the Relationship between ADCI & VHI Indices and Crop Yield
A correlation analysis (through scatter plots) is carried out between these indices and millet yield during the millet growth period from 2003 to 2017 to determine which of these indices will have a better correlation with millet yield (Fig.4). For June and August, both indices show a scattered point cloud, covering a large area and are not on the same diagonal, which explains the weak coefficient of determination (R2 = 0.11 between ADCI and millet yield and R2 = 0.09 between VHI and millet yield) obtained in Fig. 4a and Fig.4b.
For June, it is logical that the correlation result should be low because this month is the beginning of growth in the cultivation of millet. Regarding July, the point clouds are on the same diagonal, but not very close together for the diagram (b-July) in Fig. 4, leading to a moderate relationship (R2 = 0.16) between the VHI and the millet yield and sufficiently close in the case of the diagram (a-July) to obtain a good relationship (R2 = 0.25) between the ADCI and the millet yield. From September to October, both indices show better correlations with the yield of millet.
However, the correlation between ADCI and millet yield (R2 = 0.42 in September and R2 = 0.58 in October) is greater than the correlation between VHI and mil yield (R2 = 0.26 in September and R2 = 0.39 in October). September and October generally correspond to the months of harvest of millet through the agricultural area of Niger, which is normal that the correlation evolves between both months.
At the end of this analysis, the ADCI index obtained by the first principal component (PC1) of PCI, VCI, TCI, and ETCI, shows a better correlation with millet yield during the millet growth period compared to the VHI index obtained only by the combination of VCI and TCI. ADCI can detect the drought consequence on agriculture. Thus, based on the ADCI classification, the condition of agricultural drought can be monitored.
Input data for the calculation of the ADCI index and statistics from the main rainfed crop are independent and from different sources. However, that did not prevent from obtaining strong correlations between this index and the crop yield, on the one hand, a good correlation between VHI and ADCI on the other. This makes, it possible to say that the ADCI index can be a good indicator of agricultural drought and can, therefore, be used to detect and monitor the evolution of millet cultivation in the agricultural area of Niger.
Thus, for each month of the year (June to October), the ADCI index will be calculated in order to monitor millet cultivation. When the ADCI values are low, it probably means that we are in an agricultural drought and when the ADCI values are high, we are probably in a non-drought period.
DOI: 10.5373/JARDCS/V11SP11/20193132
ISSN 1943-023X 1031
Received: 23 Sep 2019/Accepted: 18 Oct 2019
Figure 4: (a) Scatter Plots between ADCI Index and Millet Crop Yield and (b) Scatter Plots between the VHI Index and Millet Crop Yield during the Crop Growth Period (June - October) from 2003 to 2017
V. Conclusion
The combination of different indices, PCI, VCI, TCI, and ETCI with 1 km resolution using the PCA method named ADCI index was identified as an ideal drought index that can monitor the started, extent, and severity of agricultural drought. This new index contains diverse information from precipitation, vegetation, land surface temperature and evapotranspiration.
To evaluate the ADCI, it was compared to the VHI and millet crop yield. At the end of these results, ADCI is not only powerfully correlated with the millet crop yield than VHI during the millet growth period, but also ADCI can better reflect the intensity and areas affected by drought than VHI in the agricultural area of Niger. The most vulnerable and usually affected by agricultural drought are the central part (Maradi and Zinder regions) and the eastern part (Diffa region). Thus, based on these results, the ADCI will be an ideal way of monitoring the yield of millet and sorghum in the agricultural area of Niger.
Acknowledgments
I thank everyone who contributed to this article. First, I think of my supervisor Ahmed El-Aboudi for correcting my article. Finally, I thank my colleague Paul Gerard Gbetkom for his support and advice.
Source of F
inding
This research did not receive any specific grant from funding agencies in the public, commercial, or not-for-profit sectors.
References
[1] Abdoulkarim, I.S., Karimou, A.J.M., Abdou, A., Alkhalil, A., Ibrahima, K., 2018. spatial variability and precipitation trend over the period 1981-2016 in the Niger Basin.
[2] Allen, R.G., Tasumi, M., Trezza, R., 2007. Satellite-Based Energy Balance for Mapping Evapotranspiration with Internalized Calibration (METRIC)— Model. J. Irrig. Drain. Eng. 133, 380–394.
[3] Avena, G.C., Ricotta, C., Volpe, F., 1999. The influence of principal component analysis on the spatial structure of a multispectral dataset. Int. J. Remote Sens. 20, 3367–3376.
[4] Bastiaanssen, W.G.M., Menenti, M., Feddes, R.A., Holtslag, A.A.M., 1998. A remote sensing surface energy balance algorithm for land (SEBAL). 1. Formulation. J. Hydrol. 212–213, 198–212.
[5] Bastiaanssen, W.G.M., Noordman, E.J.M., Pelgrum, H., Davids, G., Thoreson, B.P., Allen, R.G., 2005. SEBAL Model with Remotely Sensed Data to Improve Water-Resources Management under Actual Field Conditions. J. Irrig. Drain. Eng. 131, 85–93.
[6] Clara, J., 2011. Capitalization on the experience of the Rural Code in Niger Fiche n°1: Presentation of Niger.
[7] Dabrowska-zielinska, K., Kogan, F.N., Ciolkosz, A., Gruszczynska, M., 2002. Modelling of crop growth conditions and crop yield in Poland using AVHRR-based indices. Int. J. Remote Sens. 23, 1109–1123. [8] Denis, M., Johny, E., Roger, B., 2012. Repetition of food and nutrition crises in Niger: urgent renovation
food security policies. Cah Agric 21, 302–310.
[9] Douglas, M.J., Sally, H., 2014. Improving Access to Water for Agriculture and Livestock in Niger : A Preliminary Analysis of Investment Options for... Improving Access to Water for Agriculture and Livestock in Niger : A Preliminary Analysis of Investment Options for the Millennium Chal.
[10] Du, L., Tian, Q., Yu, T., Meng, Q., Jancso, T., Vardy, P., Yan, H., 2013. A comprehensive drought monitoring method integrating MODIS and TRMM data. Int. J. Appl. Earth Obs. Geoinf. 23, 245–253. [11] FAO, SFW, 2010. Review of Niger‘s livestock sector.
[12] Farooq, M., Wahid, A., Kobayashi, N., Fujita, D., Basra, S.M.A., 2009. Plant drought stress: effects, mechanisms and management. Agron. Sustain. Dev. 29, 185–212. https://doi.org/10.1051/agro:2008021 [13] FEWS NET, 2011. Livelihoods zoning ‗plus‘ activity in Niger [WWW Document]. URL
http://www.fews.net/west-africa/niger/livelihood-description/
[14] Funk, C., Peterson, P., Landsfeld, M., Pedreros, D., Verdin, J., Shukla, S., Husak, G., Rowland, J., Harrison, L., Hoell, A., Michaelsen, J., 2015. The climate hazards infrared precipitation with stations : a new environmental record for monitoring extremes. Sci. Data 2, 1–21.
[15] Gago, J., Douthe, C., Coopman, R.E., Gallego, P.P., Ribas-Carbo, M., Flexas, J., Escalona, J., Medrano, H., 2015. UAVs challenge to assess water stress for sustainable agriculture. Agric. Water Manag. 153, 9–19. [16] Hielkema, J.U., Prince, S.D., Astle, W.L., 1986. Rainfall and vegetation monitoring in the Savanna zone of
Democratic Republic Sudan using NOAA Advanced Very High Resolution Radiometer. Int. J. Remote
Sens. 7, 1499–1514.
[17] Jang, J.D., 2004. Evaluation of thermal-water stress of forest in southern Québec from satellite images. Thèse de doctorat, Université Laval, Québec, Qc., Canada.
[18] Jasmien, C.J.W., Garba, M., Sabiou, M., Fatondji, D., Cornelis, W.M., 2015. Agricultural drought trends and mitigation in Tillabery, Niger. Soil Sci. Plant Nutr. 37–41.
[19] Justice, C.O., Townshend, J.R.G., Holben, B.N., Tucker, C.J., 1985. Analysis of the phenology of global vegetation using meteorological satellite data. Int. J. Remote Sens. 6, 1271–1318.
[20] Kogan, F.N., 2002. World Droughts in the New Millennium from AVHRR-based Vegetation Health Indices. EOS, Trans., Am. N Geophys. L UNIO N 8, 3–7.
[21] Kogan, F.N., 2001. Operational Space Technology for Global Vegetation Assessment. Am. Meteorol. Soc. 82, 1949–1964.
[22] Kogan, F.N., 1997. Global Drought Watch from Space. Bull. Am. Meteorol. Soc. 78, 621–636.
[23] Kogan, F.N., 1995b. Application of vegetation index and brightness temperature for drought detection.
Adv. Sp. Res. 15, 91–100. https://doi.org/10.1016/0273-1177(95)00079-T
[24] Kogan, F.N., 1990. Remote sensing of weather impacts on vegetation in non-homogeneous areas. Int. J.
Remote Sens. 1161. https://doi.org/10.1080/01431169008955102
[25] Leroux, L., Baron, C., Zoungrana, B., Traoré, S.B., Seen, D. Lo, Bégué, A., 2016. Crop Monitoring Using Vegetation and Thermal Indices for Yield Estimates : Case Study of a Rainfed Cereal in Semi-Arid West Africa. IEEE J. Sel. Top. Appl. EARTH Obs. Remote Sens. 9, 1–16.
[26] Michiels, D., Egg, J., Blein, R., 2012. Repeated food and nutritional crises in Niger: The emergency for a renewal in food security policies. Cah. Agric. 21, 302–310.
[27] Mishra, A.K., Singh, V.P., 2010. A review of drought concepts. J. Hydrol. 391, 202–216.
[28] Padhee, S.K., Nikam, B.R., Dutta, S., Aggarwal, S.P., 2017. Using satellite-based soil moisture to detect and monitor spatiotemporal traces of agricultural drought over Bundelkhand region of India. GIScience
Remote Sens. 54, 144–166.
[29] Park, S., Feddema, J.J., Egbert, S.L., 2004. Impacts of hydrologic soil properties on drought detection with MODIS thermal data. Remote Sens. Environ. 88, 53–62.
[30] Pérez-Blanco, C.D., Standardi, G., Mysiak, J., Parrado, R., Gutiérrez-Martín, C., 2016. Incremental Water Charging in Agriculture. A Case Study of the Regione Emilia Romagna in Italy. Environ. Model. Softw. 78, 202–215.
DOI: 10.5373/JARDCS/V11SP11/20193132
ISSN 1943-023X 1033
Received: 23 Sep 2019/Accepted: 18 Oct 2019
[31] RECA, 2004. National Network of Chambers of Agriculture: Agroecological Zoning of NIGER.
[32] Rhee, J., Im, J., Carbone, G.J., 2010. Monitoring agricultural drought for arid and humid regions using multi-sensor remote sensing data. Remote Sens. Environ. 114, 2875–2887.
[33] Rockström, J., Barron, J., Fox, P., 2002. Rainwater management for increased productivity among small-holder farmers in drought prone environments. Phys. Chem. Earth, Parts A/B/C 27, 949–959.
[34] Senay, G.B., Bohms, S., Singh, R.K., Gowda, P.H., Velpuri, N.M., Alemu, H., Verdin, J.P., 2013. Operational Evapotranspiration Mapping Using Remote Sensing and Weather Datasets: A New Parameterization for the SSEB Approach. JAWRA J. Am. Water Resour. Assoc. 49, 577–591.
[35] Senay, G.B., Bohms, S., Verdin, J.P., 2012. Remote Sensing of Evapotranspiration for Operational Drought Monitoring Using Principles of Water and Energy Balance, Remote Sensing of Drought: Innovative
Monitoring Approaches.
[36] Senay, G.B., Budde, M.E., Verdin, J.P., 2011. Enhancing the Simplified Surface Energy Balance (SSEB) approach for estimating landscape ET: Validation with the METRIC model. Agric. Water Manag. 98, 606– 618.
[37] Sepulcre-Canto, G., Horion, S., Singleton, A., Carrao, H., Vogt, J., 2012. Development of a Combined Drought Indicator to detect agricultural drought in Europe. Nat. Hazards Earth Syst. Sci. 12, 3519–3531. [38] Singh, R.P., Roy, S., Kogan, F.N., 2003. Vegetation and temperature condition indices from NOAA
AVHRR data for drought monitoring over India. Int. J. Remote Sens. 24, 37–41.
[39] Sivakumar, M.V.K., 1992. Climate change and implications for agriculture in Niger. Clim. Change 20, 297–312.
[40] Terpend, N., Saley, M., 2005. Study on the development of animal sector development programs.
[41] Unganai, L.S., Kogan, F.N., 1998. Drought Monitoring and Corn Yield Estimation in Southern Africa from AVHRR Data. Remote Sens. Environ. 63, 219–232. https://doi.org/10.1016/S0034-4257(97)00132-6 [42] Wan, Z., Hook, S., Hulley, G., 2015. MOD11A2 MODIS/Terra Land Surface Temperature/Emissivity
8-Day L3 Global 1km SIN Grid V006. distributed by NASA EOSDIS Land Processes DAAC. https://doi.org/10.5067/MODIS/MOD11A2.006
[43] Wilhite, D.A., 2000. ―Chapter 1.‖ In Droughts: A Global Assesment. Routledge, London. https://doi.org/10.4324/9781315830896
[44] World Bank, 2011. Risk assessment of the agricultural sector in Niger: from crisis response to long-term risk management.