HAL Id: ird-01372912
https://hal.ird.fr/ird-01372912
Submitted on 27 Sep 2016
HAL is a multi-disciplinary open access
archive for the deposit and dissemination of
sci-entific research documents, whether they are
pub-lished or not. The documents may come from
teaching and research institutions in France or
abroad, or from public or private research centers.
L’archive ouverte pluridisciplinaire HAL, est
destinée au dépôt et à la diffusion de documents
scientifiques de niveau recherche, publiés ou non,
émanant des établissements d’enseignement et de
recherche français ou étrangers, des laboratoires
publics ou privés.
Multiple cryptic species in the blue-spotted maskray
(Myliobatoidei: Dasyatidae: Neotrygon spp.) : an
update
Philippe Borsa, Kang-Ning Shen, Irma Arlyza, Thierry B. Hoareau
To cite this version:
Philippe Borsa, Kang-Ning Shen, Irma Arlyza, Thierry B. Hoareau. Multiple cryptic species in the
blue-spotted maskray (Myliobatoidei: Dasyatidae: Neotrygon spp.) : an update . Comptes Rendus
Biologies, Elsevier Masson, 2016, 339, pp.417-426. �10.1016/j.crvi.2016.07.004�. �ird-01372912�
To be cited as: Borsa P, Shen K-N, Arlyza IS, Hoareau TB (2016) Multiple cryptic species in the
blue-spotted maskray (Myliobatoidei: Dasyatidae: Neotrygon spp.): an update. Comptes Rendus Biologies
339, 417-426.
Multiple cryptic species in the blue-spotted maskray (Myliobatoidei: Dasyatidae: Neotrygon
spp.): an update
Espèces cryptiques multiples chez la pastenague masquée à points bleus (Myliobatoidei: Dasyatidae:
Neotrygon spp.) : actualisation
Philippe Borsa
a,*, Kang-Ning Shen
b, Irma S. Arlyza
c, Thierry B. Hoareau
da
Institut de recherche pour le développement (IRD), Oceans department, Marseille, France
bKang-Ning Shen, Department of Environmental Biology and Fisheries Science, National Taiwan
Ocean University, Keelung, Taiwan
c
Irma S. Arlyza, Lembaga Ilmu Pengetahuan Indonesia (LIPI), Pusat Penelitian Oseanografi (P2O),
Jakarta, Indonesia
d
Thierry B. Hoareau, Molecular Ecology and Evolution Programme, Department of Genetics,
University of Pretoria, Pretoria, South Africa
*
Corresponding author: Philippe Borsa, Institut de recherche pour le développement (IRD), UMR
250 “Ecologie marine tropicale des océans Pacifique et Indien”, c/o Indonesian Biodiversity
Research Center, Universitas Udayana, Jl Raya Sesetan Gang Markisa, 80322 Denpasar, Indonesia.
Tel. +62 81237453473. E-mails: philippe.borsa@ird.fr, philippeborsa@gmail.com
A B S T R A C T
Previous investigations have uncovered divergent mitochondrial clades within the blue-spotted
maskray, previously Neotrygon kuhlii (Müller and Henle). The hypothesis that the blue-spotted
maskray may consist of a complex of multiple cryptic species has been proposed, and four species
have been recently described or resurrected. To test the multiple-cryptic species hypothesis, we
investigated the phylogenetic relationships and coalescence patterns of mitochondrial sequences in
a sample of 127 new individuals from the Indian Ocean and the Coral Triangle region, sequenced at
both the CO1 and cytochrome b loci. The maximum-likelihood (ML) tree of concatenated
CO1+cytochrome b gene sequences, rooted by the New Caledonian maskray N. trigonoides yielded 9
strongly supported, main clades. Puillandre’s ABGD algorithm detected gaps in nucleotide distance
consistent with the ML phylogeny. The general mixed Yule-coalescent algorithm partitioned the
dataset into putative species generally consistent with the ML phylogeny. Nuclear markers generally
confirmed that distinct mitochondrial clades correspond to genetically isolated lineages. The 9 main
lineages identified by ML analysis were geographically distributed in a parapatric fashion, indicating
reproductive isolation. The hypothesis of multiple cryptic species is thus validated.
Keywords: parapatric distribution; Neotrygon kuhlii; Neotrygon trigonoides; Indo-West Pacific; Coral
Triangle
R E S U M E
Des recherches antérieures ont montré des clades mitochondriaux divergents au sein de la raie
masquée à points bleus, précédemment appelée Neotrygon kuhlii (Müller et Henle). L'hypothèse
d’un complexe d’espèces cryptiques chez la raie masquée à points bleus a été proposée ; trois
espèces ont été récemment décrites et une quatrième, ressuscitée. Afin de tester l’hypothèse
d’espèces cryptiques multiples, nous étudions les relations phylogénétiques et les patrons de
coalescence des séquences mitochondriales d’un échantillon de 127 individus de l'océan Indien et
de la région du Triangle de Corail, séquencés simultanément aux locus CO1 et cytochrome b. L'arbre
de maximum de vraisemblance (ML) des séquences partielles concaténées des gènes CO1 et
cytochrome b, raciné par la raie masquée de Nouvelle-Calédonie N. trigonoides, montre 9 clades
principaux fortement soutenus. A l’aide de l’algorithme ABGD de Puillandre, des lacunes dans la
distribution des distance nucléotidiques sont détectées, qui s’avèrent généralement cohérentes avec
la phylogénie de ML. L'algorithme mixte de Yule-coalescent (GYMC) partitionne l'ensemble de
données en un certain nombre d’espèces putatives dont la délimitation est généralement cohérente
avec la phylogénie de ML. Les marqueurs nucléaires confirment, en général, que les clades
mitochondriaux distincts caractérisent des lignées génétiquement isolées. Les 9 lignées principales
identifiées par l’analyse de ML montrent une distribution parapatrique, ce qui indique qu’elles sont
reproductivement isolées. L'hypothèse d’espèces cryptiques multiples est donc validée.
Mots-clés : distribution parapatrique ; Neotrygon kuhlii ; Neotrygon trigonoides ; Indo-Pacifique
1. Introduction
Taxonomic studies of sharks and rays have led to an upsurge in new species descriptions
within the last decade ([1, 2]; and references therein). In particular, it appears that the number of
species in the Coral Triangle region has been considerably under-estimated until recently [1].
Meanwhile, grave concern has been expressed over the risk of extinction in shallow-water species
from a number of shark and ray families including Dasyatidae or stingrays. Overfishing of stingrays
is particularly severe in the Coral Triangle region [3-5] and management is urgently needed.
Species are the fundamental units in many studies of biogeography, community ecology and
conservation ecology. Both conservation and fisheries management require that species be clearly
identified and populations be delineated [6].
This paper focuses on the blue-spotted maskray, previously Neotrygon kuhlii (Müller and
Henle, 1841) [7], a stingray species that inhabits Indo-West Pacific coral reefs, lagoons and slopes
[8]. The blue-spotted maskray is heavily exploited in Southeast Asia, but its catch rate and
mortality rates are poorly known and its population trends are unknown [9, 10]. Authors have
distinguished the “Java” (Java Sea) form of blue-spotted maskray from the “Bali” (Kedonganan)
form, based on differences in size at birth and male size at maturity and treated them as different
species [9]. Molecular population genetics offer the concepts and the practical tools for delineating
populations, diagnosing closely related species, and detecting cryptic species. Cryptic species are
defined as evolutionary lineages with a substantial amount of genetic distinctiveness and no
detectable morphological differences [11-13]. R.D. Ward and co-authors ([14]: 60-62) have noted
that at the CO1 locus, “the D. kuhlii group showed considerable within species diversity … with four
subgroups ... One was the sole specimen from Australia (Queensland), one from the six specimens taken
from Kedonganan fish market on Bali (Indonesia), one from the five specimens from Muara Angke fish
market at Jakarta, Java (Indonesia) and one from the three specimens from the Penghu Islands
(Taiwan). Average distances among and within these four groups were 2.80% and 0.18%
respectively”. Subsequent genetic studies in the genus Neotrygon have focused on its phylogeny
[15-17], and on the population genetic structure and phylogeography of the blue-spotted maskray [18,
19]. Additional mitochondrial clades have been uncovered within the blue-spotted maskray [15, 17,
19]. These clades have a parapatric-like distribution [19]. Meanwhile, molecular markers have
advanced the systematics of species in the genus Neotrygon: cryptic species have been uncovered
within N. ningalooensis and N. picta [17], and the New Caledonian maskray N. trigonoides
(Castelnau, 1873) [20] has been resurrected [16, 21]. The hypothesis that the blue-spotted maskray
may itself consist of a complex of multiple species has been raised repeatedly [14, 15, 17, 22] and
was also discussed by us [19, 23]. We emphasized that the parapatric-like population structure
uncovered in the Coral Triangle region “points to incipient speciation, where some degree of
reproductive isolation has been achieved but ecological compatibility has not yet been reached”.
Recently, P.R. Last and co-authors [24] described three new species (N. australiae, N.
caeruleopunctata, N. orientale) previously under N. kuhlii and resurrected a fourth one, N. varidens
(Garman 1885) [25]. Diagnostic morphological differences between the species were proposed but
no in-depth assessment of inter-specific against infra-specific differences
was included [24].
In the present paper, we compile all CO1 and cytochrome b gene sequences published thus far
for the blue-spotted maskray and we add new sequences from samples collected in the western
Indian Ocean and throughout the Indo-Malay archipelago, to construct a robust mitochondrial
phylogeny and establish an updated distribution of the clades previously uncovered in the Coral
Triangle region [14, 15, 17, 19]. We assess whether the different clades, including those recently
resurrected or erected as new species [24] correspond to evolutionary significant units that
deserve the status of separate species.
2. Materials and methods
2.1 Ethics in sampling and information sharing
All specimens examined for the present study were independently captured by commercial
fishers prior to being sub-sampled for DNA. Some of the sampling localities in our survey (Fig. 1)
were in countries that have adopted a principle of state sovereignty over biological resources,
including genetic resources with no commercial use [26]. This includes the Philippines, where
sampling took place under a collaborative research agreement between the National Taiwan
University, Taipei and the University of San Carlos, Cebu; and Indonesia, within the framework of a
memorandum of understanding between LIPI, Jakarta and IRD, Marseille. Some of the samples were
from West Papua, a former Dutch colony currently administered by Indonesia [27, 28] that has no
control over its own natural resources [29]. For equitable sharing of results and knowledge, the
data produced in the course of our study will be made accessible from the following open-access
repositories: Hal-IRD (http://www.hal.ird.fr/; hal@ird.fr), GenBank (http://www.ncbi.nlm.nih.gov)
[30], and DIPnet (http://www.indopacificnetwork.wikispaces.com/).
2.2. Sampling
A total of 362 individuals, including 341 blue-spotted maskray and 21 New Caledonian
maskray N. trigonoides, was utilized in the present study. This total includes 203 individuals whose
CO1 or cytochrome b gene sequences were compiled from either the literature [14, 16, 17, 19,
31-38], the BOLD barcode database, the Cryobank DNA-barcode database
(http://cryobank.sinica.edu.tw/chi/), or the GenBank nucleotide-sequence database; and 159 new
individuals sampled from local fish-landing places throughout the Indo-Malay archipelago, in
eastern Africa, and in New Caledonia. All individuals included in the present survey are listed in
Supplementary Table S1, along with sampling details, GenBank accession numbers, voucher
specimen details, and references. An overview of the density of blue-spotted maskray samples
across the Indo-West Pacific, with a focus on the Coral Triangle region is given in Fig. 1.
2.3. Molecular analyses
A piece of skin or flesh ~0.05 to ~1 cm
3was removed, using surgical scissors, from the pelvic
fin, or the pectoral fin, or the tail and was preserved in 95% ethanol at ambient temperature. DNA
extraction was done using either the Viogene (Taiwan) tissue genomic DNA extraction protocol, or
the DNEasy DNA extraction kit (Qiagen GmbH, Hilden, Germany). DNA was stored in 1X, pH 8.0 TE
buffer (AppliChem, Darmstadt, Germany). Polymerase chain reaction (PCR) amplification of a
fragment of the CO1 gene was done according to [19]. For the PCR-amplification of the cytochrome b
gene, we used primers L14735 and CB7 [39, 40]. The reaction volume was 15 μL and the reaction
mixture contained 0.2 mM dNTPs, 1.5 μL 10× PCR buffer (Bioman, Taipei), 0.5 μM of each forward
and reverse primers, 0.2 U Taq DNA polymerase (Bioman), and 1.0 μL template DNA. The PCR
parameters were: initial denaturation at 94°C for 4 min followed by 35 cycles of denaturation (94°C
for 45 s), annealing (48°C for 1 min), and extension (72°C for 1 min), and a final extension step at
72°C for 10 min. Intron 5 of the growth hormone gene, Gh5, was PCR-amplified using
exon-anchored primers Gh5F (5’- A G G C C A A T C A G G A C G G A G C -3’) and Gh6R (5’- T G C C A C T G T
C A G A T A A G T C T C C -3’) [41] setting the annealing temperature to 64.5°C and the number of
cycles to 35.
The PCR products were sequenced directly using the same primers as those used for the PCR.
Sequences were analyzed in an automated ABI Prism 377 sequencer (Applied Biosystems, Foster
City, CA) at the sequencing facility of the Taiwan Normal University (Taipei).
2.4. Genetic data analysis
Nucleotide sequences, including those obtained in the present study, and homologous
sequences retrieved from the BOLD, Cryobank, and GenBank databases (see Supplementary Table
S1) were aligned using B
IO
E
DIT
[42]. Four datasets were analyzed: (1) the CO1 gene sequence
dataset, consisting of 330 blue-spotted maskray and N. trigonoides sequences aligned over a
maximum length of 722 base pairs (bp); (2) the cytochrome b gene sequence dataset, consisting of
165 blue-spotted maskray and N. trigonoides sequences aligned over a maximum length of 1142 bp;
(3) the concatenated CO1+cytochrome b gene sequence dataset comprising 127 blue-spotted
maskray and 6 N. trigonoides sequences; (4) the Gh5 intron sequence dataset, consisting of 18
blue-spotted maskray and N. trigonoides sequences aligned over a maximum length of 359 bp.
The phylogeny of concatenated CO1+cytochrome b gene haplotypes was inferred by using the
maximum-likelihood (ML) method under M
EGA
6 [43]. The most likely nucleotide-substitution
model, which was determined according to the Bayesian information criterion, was the Tamura-Nei
model [44] where a discrete Gamma distribution (Γ=0.76) was used to model evolutionary rate
differences among nucleotide sites and invariable sites were allowed. The ML tree was rooted by
choosing New Caledonian maskray N. trigonoides as outgroup [16]. The robustness of nodes in the
tree was tested by bootstrap resampling.
The CO1 and cytochrome b gene sequence datasets (Supplementary Table S1) were used
separately to assign individuals that were sequenced at only one of either locus to a clade
uncovered from the phylogenetic reconstruction described above. For this, an ML tree was
constructed using each of the two datasets under M
EGA
6
and the assignment of a haplotype to a
clade was determined visually from its relative position on the tree.
2.5. Delineation of cryptic species
The Automatic Barcode Gap Discovery (ABGD) algorithm proposed by N. Puillandre and
co-authors [45] was used to identify gaps in the distribution of pairwise nucleotide distances. The
ABGD algorithm detects the largest significant gap in the distribution of pairwise nucleotide
distances and uses it for partitioning the dataset. Gap detection is then recursively applied to
previously obtained groups to get finer partitions until there is no further partitioning [45]. The
ABGD analysis was run on a matrix of 127 CO1+cytochrome b gene sequences, trimmed to a core
length of 1415 bp. Kimura’s [46] two-parameter substitution model was selected and the minimum
barcoding gap width was set to 1%.
Branch lengths between species are determined by speciation and extinction rates whereas
branch lengths within a species reflect coalescent processes at the level of populations [47]. This
results in the distinction of species when mitochondrial clades are substantially deeper than the
coalescent haplogroups at the extremities of the tree. We ensured that each of the
previously-identified deep mitochondrial clades was genetically distant from its nearest neighbour by several
times the mean intra-clade distance. For this, pairwise intra-clade and between-clades genetic
distances were estimated on the concatenated CO1+cytochrome b gene sequence matrix using
M
EGA
6.
To delimit potential cryptic species, we applied the general mixed Yule coalescent (GMYC)
algorithm [47] as implemented in the program S
PLITS
under R [48, 49]. This algorithm uses an
ultrametric tree to differentiate branching patterns consistent with coalescent, from speciation
processes, which provides a threshold time for the transition between populational and
species-level processes. We selected the single-threshold option. The ultrametric tree was constructed
using B
EAST
v. 1.7 [50] based on the same matrix (127 individuals x 1415 bp) as that used for the
ABGD analysis. Outgroup N. trigonoides was excluded from the analysis, which focused on the
blue-spotted maskray exclusively. A non-calibrated relaxed lognormal clock, and a constant coalescent
tree were assumed. The model of nucleotide substitution was TN93+G+I (see sub-section 2.4). Ten
million generations of Markov-Chain Monte Carlo analysis were run, of which we sampled a total of
10,000 genealogies. Length of burn-in was determined by visual inspection of traces in T
RACER
v.
1.5 [50]. A single analysis was run, for which convergence was reached rapidly. The T
REE
A
NNOTATOR
v. 1.7. software [50] was used to produce the final tree, based on maximum clade credibility and
mean node height.
3. Results
The complete set of partial CO1- and cytochrome b gene sequences, which comprises both those
compiled from the literature and from nucleotide databases and those produced in the present
study is presented as Supplementary Table S2. New CO1 gene sequences have GenBank accession
numbers KU497912-KU498038 and KU521523; new cytochrome b gene sequences have GenBank
accession numbers KU497752-KU497911 (details in Supplementary Table S1).
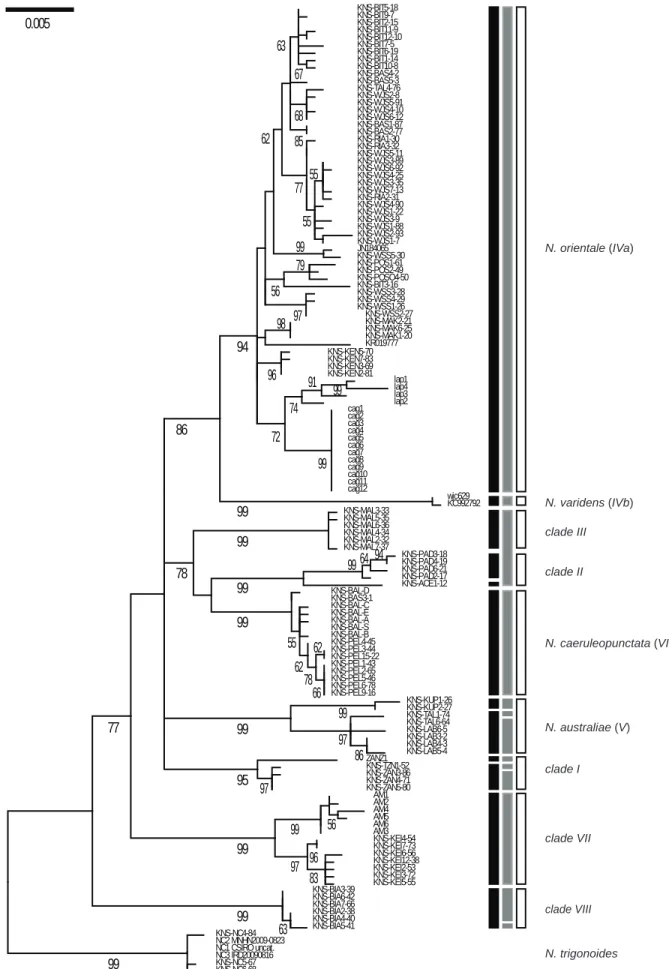
The ML tree of concatenated (CO1+cytochrome b) gene nucleotide sequences, rooted by N.
trigonoides showed 9 main statistically-supported clades (Fig. 2). Here we distinguished the
sister-subclades IVa (N. orientale) vs. IVb (N. varidens) within previous Clade IV [19, 23]. The 7 other
clades were Clades I-III, VII, VIII identified previously [19,23], N. australiae (our former Clade V),
and N. caeruleopunctata (our former Clade VI). Variation in clade nomenclature across studies
[15,17,19,23,24] is summarized in Table 1. Pairwise nucleotide distances between clades ranged
from 0.014 to 0.029 (average 0.022), that is, two to 29 times higher than within-clade average
distances (0.001-0.007; average 0.004) (Table 2).
Through automatic gap determination using Puillandre’s ABGD algorithm, 12 distinct
mitochondrial lineages were found, separated from each other by a gap in genetic distance ≥ 1%
(Fig. 2). The ABGD partitioning was consistent with the topology of the ML tree. In particular,
Clades II and III were recognized as distinct. The distinction between Clades IVa (N. orientale) and
IVb (N. varidens) was confirmed. Two subclades were identified within each Clade I (Indian-Ocean
maskray), and N. australiae. All 9 major clades of the ML tree were confirmed by the ABGD
partitioning (Fig. 2).
Based on the ultrametric tree of blue-spotted maskray mitochondrial haplotypes (not shown),
the likelihood of the null model (i.e., where all mitochondrial sequences belong to a single species)
was 1141.9, significantly lower than the maximum likelihood of the GMYC model (1145.1); the
likelihood ratio was 6.477 (P = 0.039). The estimated number of clusters within the blue-spotted
maskray was 13 (95% confidence interval: 10–46), whose boundaries often coincided with the
above 9 clades (Fig. 2). The distinction between clades IVa (N. orientale) and IVb (N. varidens) was
thus confirmed, as was that of N. caeruleopunctata. The main exception was the lack of recognition
of clades II and III as separate entities. The individuals collected in the Indian Ocean (our clade I
[19]) formed a distinct series of three clusters, as did N. australiae, and a subcluster was found
within clade VIII (Fig. 2).
The partition into species that was finally retained considered the tree topology, the nucleotide
divergence between lineages, and the results of the ABGD and GMYC analyses. This partition was
consistent with the current taxonomy of species, leaving unchallenged the four nominal species N.
australiae, N. caeruleopunctata, N. orientale and N. varidens (Fig. 2). The inability of the GYMC
algorithm to separate clade II from clade III may be caused by a lack of power, as the two clades
were approximately equally distant from each other as they were each from N. caeruleopunctata
(Table 2).
Once cryptic species of the blue-spotted maskray were identified, it was possible to tentatively
assign each individual in the total sample (Supplementary Table S1) to either of them, using the
partial CO1- or cytochrome b gene sequence. The ML tree of CO1 gene sequences, rooted by N.
trigonoides (Supplementary Fig. S1) showed the same 9 haplogroups as those highlighted in the
phylogenetic tree of Fig. 2, plus a tenth lineage represented by the single CO1 gene haplotype from
the Ryukyu Islands (GenBank AB485685; [31]). All haplogroups had acceptable to strong statistical
support, except the haplogroup representing individuals from the Indian Ocean. All 330 individuals
characterized by their CO1 gene sequence (except a single individual from India; GenBank
HM467799) unambiguously clustered with either one of the 9 lineages of Fig. 2, or with N.
trigonoides. The ML tree of cytochrome b gene sequences, rooted by N. trigonoides (Supplementary
Fig. S2) similarly showed the same 9 haplogroups as those highlighted in Fig. 2. Eight out of the 9
haplogroups had strong statistical support, with bootstrap scores between 93% and 100%. All 165
individuals characterized by their cytochrome b gene sequence unambiguously clustered with
either one of these 9 blue-spotted maskray lineages, or with N. trigonoides.
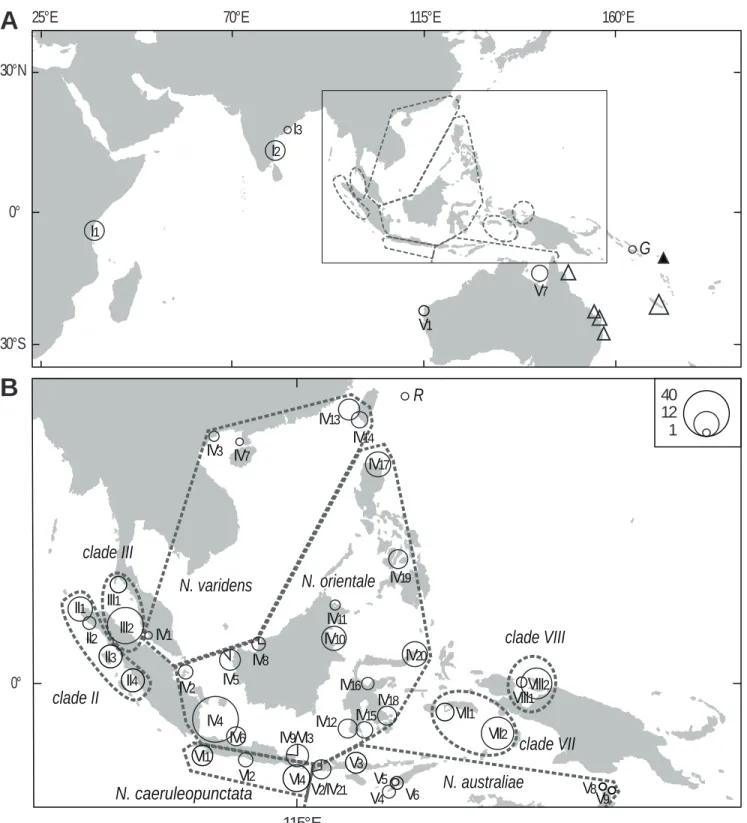
Using the sampling locations of the individuals (Supplementary Table S1), it was possible to
delineate the geographic distribution of each lineage (Fig. 1). The 9 lineages of the blue-spotted
maskray and the closely-related N. trigonoides had parapatric distributions (Fig. 1). Zones of
contact were identified between N. orientale and N. varidens in the southeastern part of the South
China Sea, between N. caeruleopunctata and N. orientale in Bali Strait, and between N. australiae
and N. orientale in the Lombok area (Fig. 1B). Similar zones of contact are expected between
Clade-II and Clade-Clade-III lineages east of the northern tip of Aceh, between Clade Clade-III and N. varidens in the
Malacca strait, between N. caeruleopunctata, N. orientale, and Clade II west of the southwestern tip
of Java, and between N. australiae and N. caeruleopunctata east of southern Bali (Fig. 1B). Other
contact zones may be possible between N. orientale and Clade VII, between N. australiae and Clade
VII, and between clade VII and Clade VIII (Fig. 1B).
Eighteen Neotrygon spp. individuals (out of 37 tested) were successfully sequenced at the Gh5
intron locus. The sequences have GenBank accession numbers KU497734-KU497751. The ML tree
derived from the alignment of sequences, rooted by N. trigonoides, is presented in Fig. 3A.
4. Discussion
The present results enforce Ward et al.’s [14] hypothesis that the blue-spotted maskray is a
complex of cryptic species, for the reasons developed in the following.
4.1. Coalescence patterns
Nucleotide distances between major blue-spotted maskray clades were several times higher
than distances within, confirming previous observations based on preliminary geographic sampling
[14, 15, 17, 19]. Denser geographic sampling (present study) did not lead to a dramatically altered
ratio of genetic distance between clades to that within, compared to Ward et al.’s results [14]. The
gaps in nucleotide distance remained consistent with the existence of 9 separate main lineages
within the blue-spotted maskray. The GMYC algorithm determined that the coalescence patterns
within a lineage vs. patterns between lineages generally conformed to the expectations of
infra-specific vs. inter-infra-specific processes.
4.2. General concordance of mitochondrial and nuclear differences
In sharks and rays, short mitochondrial DNA sequences at the CO1 locus (or CO1 DNA
barcodes) have proven their suitability to identify up to 99% species [14]. This high barcoding
success might be related to the apparent absence of mitochondrial introgression in this vertebrate
group [14], itself pointing to a likely low incidence of inter-specific hybridization. This may be an
indirect consequence of complex pre-mating behaviour, which prevents hetero-specific pairs, or of
mismatch in the morphologies of male and female genitalia, which hampers copulation. Complex
pre-mating behaviour has been reported in sandtiger shark [52] and New Caledonian maskray [53].
Mismatch of male – female copulatory apparatuses has been hypothesized for whiprays of the
Himantura uarnak (Forsskål, 1775) [54] species complex [35]. Other hypotheses for pre-mating
isolation involve chemical or visual cues [17]. Because cases of mitochondrial introgression are
virtually unknown in sharks and rays [6], one expects that patterns of inter-specific genetic
differentiation at nuclear loci parallel those at the mitochondrial locus.
Nuclear markers have also been used to characterize blue-spotted maskray populations [17,
18]. Significant allele-frequency differences at 2/4 intron loci were observed between adjacent
populations from southern Java and Bali Strait [18], corroborating the distinction between previous
Clades IVb and VI ([19, 23]; present study), hence the recognition of, respectively, N. orientale and
N. caeruleopunctata as separate species. Two major clades were observed at the nuclear locus
RAG-1 [RAG-17] (Fig. 3B), that distinguished the lineage from the eastern Andaman Sea (our Clade III) and
those from the adjacent South China Sea (N. varidens) and Java Sea (N. orientale). Similarly, the
RAG-1 marker allowed the distinction between the lineage from southern Bali (N. caeruleopunctata; our
previous Clade VI) and that of the adjacent Lombok Island (N. australiae; our previous Clade V) [17].
Additional information from nuclear marker Gh5 was produced in the present study. Nucleotide
sequences at intron locus Gh5 confirmed the distinction between N. orientale on the one side, and N.
australiae and N. caeruleopunctata on the other side, although some other Gh5 sequences of
individuals determined as N. orientale according to their mitochondrial haplotypes appeared to
cluster with N. australiae and with Clade I. This may either signal mitochondrial introgression, or
reflect incomplete lineage sorting at the Gh5 locus. In addition, at this locus, samples from the
Moluccas and West Papua (respectively, our Clade-VII and Clade-VIII lineages) were distinct from
all the other samples, and also from each other.
4.3. Parapatric distribution
Repeated lowering of the sea level caused by global temperature oscillation [55] has led to the
repeated fragmentation of the marine habitats of the Indo-Malay archipelago in the Pleistocene
[56]. In shallow-water species like the blue-spotted maskray, this has caused repeated depletion
and fragmentation of the populations, followed by repeated recolonisation of shallow-water
habitats once the sea level rose again, and secondary contact between long-isolated populations.
Population collapse reduces genetic diversity by the random fixation of a subset of alleles and
subsequent population expansion favours new, nascent diversification. This succession of isolation
episodes with cyclic population collapses followed by rapid population expansions is thought to
have favoured speciation in the blue-spotted maskray [17, 19].
Secondary contact after recolonisation of inundated shallow-water habitat may have been a
factor reinforcing genetic isolation instead of promoting re-homogeneisation. At the scale of an
individual’s lifetime, the blue-spotted maskray is a sedentary species. Long-term site fidelity has
been inferred from tagging experiments in the closely-related N. trigonoides, with similar results for
females and males [53]. Relatively poorly dispersing species often form well-delineated parapatric
boundaries [57]. One of the proposed mechanisms is that of a narrow and stable hybrid zone, which
acts as a geographic barrier to cross-dispersal [57]. While this hypothesis remains to be tested in
the blue-spotted maskray species complex, the present study identified several of these parapatric
boundaries, on which future genetic studies should focus.
5. Conclusion
Sound conservation and fisheries management requires knowledge on population genetic
structure, so as to delineate demes, which are the basic units on which to conduct meaningful
demographic analyses. Previous attempts at investigating the population genetic structure of
blue-spotted maskray have found substantially higher levels of population differentiation than usual,
leading to suspecting cryptic species. Here, molecular markers distinguished nine main separate
lineages within the blue-spotted maskray previously under N. kuhlii. These lineages qualify as
distinct species, based on levels of genetic divergence, coalescence patterns, concurrent
differentiation at nuclear loci, and parapatric distribution, which points to reproductive isolation.
We propose that repeated dramatic demographic lows and highs in the Pleistocene, combined with
individual sedentarity and possibly homogamy, have driven speciation in the blue-spotted maskray.
Disclosure of interest
We have no conflicts of interest concerning this article.
Appendix A. Supplementary data
Supplementary data associated with this article can be found, in the online version, at
http://dx.doi.org/10.1016/j.crvi.2016.07.004.
Acknowledgments
We thank Jean-Dominique Durand (IRD, Ho-Chi Minh Ville), Nicolas Hubert (IRD, Cibinong),
Samuel P. Iglesias (MNHN, Concarneau) and Robert D. Ward (CSIRO, Hobart) for exchanging
viewpoints, and five anonymous reviewers for insightful comments on previous versions of this
paper. DeAnne Olsen Cravaritis (NCBI, Bethesda) kindly edited the files deposited in GenBank. A.
Pavan Kumar (ICAR-CIFE, Mumbai) kindly provided details on specimen VIZNK-01. The fishers,
researchers, and travellers who participated in the collection of samples are listed in Appendix A.
The background map of the Indo-West Pacific was edited from images downloaded from Digital
Vector Maps, San Diego (http://digital-vector-maps.com/). Funded by IRD-UMR 250, NTOU, and
LIPI-P2O. The present report is a contribution of the IRD / LIPI project on the population genetics
of Elasmobranchs in the Indonesian archipelago (PARI). Designed the study: PB, KNS. Contributed
reagents or materials or analysis tools: ISA, PB, TBH, KNS. Did the experiments: ISA, KNS. Analyzed
and interpreted the data: PB, TBH, KNS. Wrote the paper: PB.
References
[1] W.T. White, P.R. Last, A review of the taxonomy of chondrichthyan fishes: a modern perspective,
J. Fish Biol. 80 (2012) 901-917.
[2] S. Weigmann, Annotated checklist of the living sharks, batoids and chimaeras (Chondrichthyes)
of the world, with a focus on biogeographical diversity, J. Fish Biol. 88 (2016) 837-1037.
doi:10.1111/jfb.12874
[3] S.J.M. Blaber, C.M. Dichmont, W. White, R. Buckworth, L. Sadiyah, B. Iskandar, S. Nurhakim, R.
Pillans, R. Andamari, Dharmadi, Fahmi, Elasmobranchs in southern Indonesian fisheries: the
fisheries, the status of the stocks and management options, Rev. Fish Biol. Fisheries 19 (2009)
367-391.
[4] W.T. White, P.M. Kyne, The status of chondrichthyan conservation in the Indo-Australasian
region, J. Fish Biol. 76 (2010) 2090-2117.
[5] N.K. Dulvy, S.L. Fowler, J.A. Musick, R.D. Cavanagh, P.M. Kyne, L.R. Harrison, J.K. Carlson, L.N.K.
Davidson, S.V. Fordham, M.P. Francis, C.M. Pollock, C.A. Simpfendorfer, G.H. Burgess, K.E.
Carpenter, L.J.V. Compagno, D.A. Ebert, C. Gibson, M.R. Heupel, S.R. Livingstone, J.C. Sanciangco,
J.D. Stevens, S. Valenti, W.T. White, Extinction risk and conservation of the world’s sharks and
rays, eLife 3 (2014) e00590.
[6] C.L. Dudgeon, D.C. Blower, D. Broderick, J.L. Giles, B.J. Holmes, T. Kashiwagi, N.C. Krück, J.A.T.
Morgan, B.J. Tillett, J.R. Ovenden, A review of the application of molecular genetics for fisheries
management and conservation of sharks and rays, J. Fish Biol. 80 (2012) 1789–1843.
[7] J. Müller, F.G.J. Henle, Systematische Beschreibung der Plagiostomen, mit sechzig
Steindrucktafeln, Veit und Comp, Berlin, 1841, xxii+200 p., 60 pl.
[8] R. Froese, D. Pauly (Eds.), FishBase, World Wide Web electronic publication, 2015
(www.fishbase.org, version 09/2015).
[9] W.T. White, Dharmadi, Species and size compositions and reproductive biology of rays
(Chondrichthyes, Batoidea) caught in target and non-target fisheries in eastern Indonesia, J.
Fish Biol. 70 (2007) 1809–1837.
[10] Fahmi, W.T. White, I.P. Jacobsen, Neotrygon kuhlii. The IUCN red list of threatened species,
2015 (2015) e.T161590A68636167.
[11] J.C. Avise, Phylogeography, Harvard University Press, Boston, 2000.
[12] N. Knowlton, Molecular genetic analyses of species boundaries in the sea, Hydrobiologia 420
(2000) 73-90.
[13] J. Mallet, Why was Darwin’s view of species rejected by twentieth century biologists? Biol.
Philos. 25 (2010) 497–527.
[14] R.D. Ward, B.H. Holmes, W.T. White, P.R. Last, DNA barcoding Australasian chondrichthyans:
results and potential uses in conservation, Mar. Freshw. Res. 59 (2008) 57-71.
[15] G.J.P. Naylor, J.N. Caira, K. Jensen, K.A.M. Rosana, W.T. White, P.R. Last, A DNA sequence-based
approach to the identification of shark and ray species and its implications for global
elasmobranch diversity and parasitology, Bull. Am. Mus. Nat. Hist. 367 (2012) 1–262.
[16] P. Borsa, I.S. Arlyza, W.J. Chen, J.-D. Durand, M.G. Meekan, K.N. Shen, Resurrection of New
Caledonian maskray Neotrygon trigonoides (Myliobatoidei: Dasyatidae) from synonymy with N.
kuhlii, based on cytochrome-oxidase I gene sequences and spotting patterns, C. R. Biol. 336
(2013a) 221–232. doi: 10.1016/j.crvi.2013.05.005
[17] M. Puckridge, P.R. Last, W.T. White, N. Andreakis, Phylogeography of the Indo-West Pacific
maskrays (Dasyatidae, Neotrygon): a complex example of chondrichthyan radiation in the
Cenozoic, Ecol. Evol. 3 (2013) 217-232.
[18] P. Borsa, I.S. Arlyza, M. Laporte, P. Berrebi, Population genetic structure of blue-spotted
maskray Neotrygon kuhlii and two other Indo-West Pacific stingray species (Myliobatiformes:
Dasyatidae), inferred from size-polymorphic intron markers, J. Exp. Mar. Biol. Ecol. 438 (2012)
32-40. doi: 10.1016/j.jembe.2012.09.010
[19] I.S. Arlyza, K.-N. Shen, J.-D. Durand, P. Borsa, Mitochondrial haplotypes indicate parapatric-like
phylogeographic structure in blue-spotted maskray (Neotrygon kuhlii) from the Coral Triangle
region, J. Hered. 104 (2013) 725-733. doi:10.1093/jhered/est044
[20] F. de Castelnau, Contribution to the ichthyology of Australia, Proc. Zool. Acclim. Soc. Victoria 2
(1873) 37-158.
[21] P. Borsa, Molecular genetics as a valid contribution to the taxonomy of species complexes in
stingrays: comment on Weigmann’s global checklist of chondrichthyan fishes, J. Fish Biol. 88
(2016) 837-1037.
[22] P.R. Last, W.T. White, J.N. Caira, Dharmadi, Fahmi, K. Jensen, A.P.K. Lim, B.M.
Manjaji-Matsumoto, G.J.P. Naylor, J.J. Pogonoski, J.D. Stevens, G.K. Yearsley, Sharks and rays of Borneo,
CSIRO, Collingwood (Victoria), 2010, 304 p.
[23] P. Borsa, J.-D. Durand, W.-J. Chen, N. Hubert, D. Muths, G. Mou-Tham, M. Kulbicki, Comparative
phylogeography of the western Indian Ocean reef fauna, Acta Oecol. 72 (2016) 72-86. doi:
10.1016/j.actao.2015.10.009
[24] P.R. Last, W.T. White, B. Séret, Taxonomic status of maskrays of the Neotrygon kuhlii species
complex (Myliobatoidei: Dasyatidae) with the description of three new species from the
Indo-West Pacific, Zootaxa, 4083 (2016) 533–561.
[25] S. Garman, Notes and descriptions taken from selachians in the U. S. National Museum, Proc.
U.S. Natl. Mus. 8 (1885) 39-44.
[26] M.E. Watanabe, The Nagoya protocol on access and benefit sharing, BioScience 65 (2015)
543-550.
[27] J. Saltford, The United Nations and the Indonesian takeover of West Papua, 1962–1969,
Routledge, London, 2003, 256 p.
[28] G. Harvey, The price of protest in West Papua, Griffiths J. Law Hum. Dignity 3 (2015) 170-203.
[29] C. Budiardjo, Resource-rich West Papua, but who benefits? Jakarta Post, 14 May 2010.
[30] Y. Baskin, GenBank – Storehouse for life’s secret code, Sci. Digest 91 (1983) 94-95.
[31] N. Yagishita, K. Furumitsu, A. Yamaguchi, Molecular evidence for the taxonomic status of an
undescribed species of Dasyatis (Chondrichthyes: Dasyatidae) from Japan, Species Diversity 14
(2009) 157-164.
[32] N.C. Aschliman, M. Nishida, M. Miya, J.G. Inoue, K.M. Rosana, G.J.P. Naylor, Body plan
convergence in the evolution of skates and rays (Chondrichthyes: Batoidea), Mol. Phyl. Evol. 63
(2012) 28-42.
[33] F. Cerutti-Pereyra, M.G. Meekan, N.W.V. Wei, O. O’Shea, C.J.A. Bradshaw, C.M. Austin,
Identification of rays through DNA barcoding: an application for ecologists, PLoS One 7 (2012)
e36479.
[34] Z.D. Wang, Y.S. Guo, X.M. Liu, Y.B. Fan, C.W. Liu, DNA barcoding South China Sea fishes,
Mitochondr. DNA 23 (2012), 405-410.
[35] I.S. Arlyza, K.-N. Shen, D.D. Solihin, D. Soedharma, P. Berrebi, P. Borsa, Species boundaries in
the Himantura uarnak species complex (Myliobatiformes: Dasyatidae), Mol. Phyl. Evol. 66
(2013) 429-435. doi: 10.1016/j.ympev.2012.09.023
[36] X. Chen, D. Xiang, J.Q. Yu, W.Y. Ding, S.L. Zhang, Complete mitochondrial genome of the
blue-spotted stingray Neotrygon kuhlii (Myliobatiformes: Dasyatidae), Mitochondr. DNA 25 (2014)
429-430.
[37] K.C. Lim, P.E. Lim, V.C. Chong, K.H. Loh, Molecular and morphological analyses reveal
phylogenetic relationships of stingrays focusing on the family Dasyatidae (Myliobatiformes),
PLoS One 10 (2015) e0120518.
[38] K.-N. Shen, C.-W. Chang, S.-Y. Tsai, S.-C. Wu, Z.-H. Lin, Y.-F. Chan, C.-H. Chen, C.-D. Hsiao, P.
Borsa, Next generation sequencing yields the complete mitogenomes of leopard whipray
(Himantura leoparda) and blue-spotted maskray (Neotrygon kuhlii) (Chondrichthyes:
Dasyatidae), Mitochondr. DNA Pt A 27 (2016) 2613-2614. doi:
10.3109/19401736.2015.1041119
[39] S.R. Palumbi, A.P. Martin, S. Romano, W.O. McMillan, L. Stice, G. Grabowski, The Simple Fool’s
Guide to PCR, Version 2.0, Department of Zoology and Kewalo Marine Laboratory, University of
Hawaii, Honolulu, 1991, 46 pp.
[40] T. Kitamura, A. Takemura, S. Watabe, T. Taniuchi, M. Shimizu, Molecular phylogeny of the
sharks and rays of Superorder Squalea based on mitochondrial cytochrome b gene, Fisheries
Sci. 62 (1996) 340-343.
[41] M. Hassan, C. Lemaire, C. Fauvelot, F. Bonhomme, Seventeen new exon-primed intron-crossing
polymerase chain reaction amplifiable introns in fish, Mol. Ecol. Notes 2 (2002) 334–340.
[42] T.A. Hall, B
IOEDIT
: a user-friendly biological sequence alignment editor and analysis program
for Windows 95/98/NT, Nucl. Acids Symp. Ser. 41 (1999) 95-98.
[43] K. Tamura, G. Stecher, D. Peterson, A. Filipski, S. Kumar, MEGA6: Molecular Evolutionary
Genetics Analysis version 6.0, Mol. Biol. Evol. 30 (2013) 2725–2729.
[44] K. Tamura, M. Nei, Estimation of the number of nucleotide substitutions in the control region of
mitochondrial DNA in humans and chimpanzees, Mol. Biol. Evol. 10 (1993) 512-526.
[45] N. Puillandre, A. Lambert, S. Brouillet, G. Achaz, ABGD, automatic barcode gap discovery for
primary species delimitation, Mol. Ecol. 21 (2012) 1864–1877.
[46] M. Kimura, A simple method for estimating evolutionary rates of base substitutions through
comparative studies of nucleotide sequences, J. Mol. Evol. 16 (1980) 111–120.
[47] J. Pons, T.G. Barraclough, J. Gomez-Zurita, A. Cardoso, D.P. Duran, S. Hazell, S. Kamoun, W.D.
Sumlin, A.P. Vogler, Sequence-based species delimitation for the DNA taxonomy of undescribed
insects, Syst. Biol. 55 (2006) 595–609.
[48] R Development Core Team, R: A language and environment for statistical computing. R
Foundation for Statistical Computing, Vienna, 2011 (http://www.R-project.org/).
[49] T. Fujisawa, T.G.Barraclough, Delimiting species using single-locus data and the Generalized
Mixed Yule Coalescent approach: A revised method and evaluation on simulated data sets, Syst.
Biol. 62 (2013) 707-724.
[50] A.J. Drummond, A. Rambaut, B
EAST
: Bayesian evolutionary analysis by sampling trees, BMC
Evol. Biol. 7 (2007) 214.
[51] T.H.Jukes, C.R. Cantor, Evolution of protein molecules, in: H.N. Munro (ed.), Mammalian protein
metabolism, Acad. Press, New York, 1969, p. 21-132.
[52] I. Gordon, Pre-copulatory behaviour of captive sandtiger sharks, Carcharias taurus, Env. Biol
Fishes 38 (1993) 159-164.
[53] S.J.Pierce, S.A. Pardo, M.B. Bennett, Reproduction of the blue-spotted maskray Neotrygon kuhlii
(Myliobatoidei: Dasyatidae) in south-east Queensland, Australia, J. Fish Biol. 74 (2009) 1291–
1308.
[54] P. Forsskål, Descriptiones animalium, avium, amphibiorum, piscium, insectorum, vermium;
quae in itinere orientali observavit Petrus Forskål (post mortem auctoris edidit Carsten
Niebuhr), Adjuncta est materia medica kahirina atque tabula maris Rubri geographica, Mölleri,
Hauniae, 1775, xxxiv+164 p.
[56] H.K. Voris, Maps of Pleistocene sea levels in Southeast Asia: shorelines, river systems and time
durations, J. Biogeogr. 27 (2000) 1153–1167.
Table 1
Blue-spotted maskray, Neotrygon spp. (formerly N. kuhlii) and New Caledonian maskray, N. trigonoides. Lineage
nomenclature utilized in present study, and its relationship to recent genetic-based studies. Homology between
lineages was assessed by the phylogenetic placement of individuals sequenced at different loci and/or by the
geographic origin of a sample. Genetic markers indicated in brackets.
Present study
Naylor et al. 2012
[15]
Arlyza et al. 2013
[19, 23]
Puckridge et al. 2013
[17]
Last et al. 2016
[24]
(CO1, cytb)
(ND2)
(CO1)
(CO1+16S, RAG-1)
(CO1)
N. australiae
N. kuhlii 4
N. kuhlii Clade V
Clade 5
N. australiae
N. caeruleopunctata
-
N. kuhlii Clade VI
Clade 6
N. caeruleopunctata
N. orientale
N. kuhlii 1
N. kuhlii Clade IV
Clades 2, 3
N. orientale
N. varidens
N. kuhlii 2
N. kuhlii Clade IV
Clade 1
N. varidens
Clade I
N. kuhlii 3
N. kuhlii Haplogroup I
Clade 8
-
Clade II
-
N. kuhlii Clade II
-
-
Clade III
-
N. kuhlii Clade III
Clade 7
-
Clade VII
-
N. kuhlii Clade VII
-
-
Clade VIII
-
N. kuhlii Clade VIII
-
-
Guadalcanal maskray
-
-
-
N. kuhlii
Ryukyu maskray
-
N. kuhlii Clade IV
Clade 4
-
Table 2
Blue-spotted maskray, Neotrygon spp. Mean ± SD pairwise genetic distances (number of nucleotide substitutions
per site), estimated from concatenated CO1+cytochrome b gene fragment sequences (total N=133) (M
EGA
6 [43];
Tamura-Nei model [44]). N sample size.
No. Clade
N
Mean pairwise genetic distance
Within
clade
Between clades (net)
1
2
3
4
5
6
7
8
9
1
N. australiae.
8 0.007
±0.001
2
N. caeruleopunctata
15 0.002
±0.001
0.020
±0.003
3
N. orientale
67 0.007
±0.001
0.017
±0.003
0.014
±0.003
4
N. trigonoides
6 0.001
±0.001
0.032
±0.005
0.032
±0.005
0.028
±0.004
5
N. varidens
2 0.001
±0.001
0.026
±0,004
0.025
±0.004
0.016
±0.003
0.037
±0.005
6
Clade I
5 0.003
±0.001
0.018
±0.003
0.016
±0.003
0.014
±0,003
0.028
±0.004
0.024
±0.004
7
Clade II
5 0.006
±0.001
0.023
±0.004
0.015
±0.003
0.020
±0.003
0.033
±0.005
0.027
±0.004
0.020
±0.003
8
Clade III
6 0.001
±0.000
0.022
±0.004
0.017
±0.003
0.017
±0.003
0.031
±0.005
0.026
±0.004
0.019
±0.003
0.018
±0.003
9
Clade VII
13 0.005
±0.001
0.022
±0.004
0.021
±0.003
0.019
±0.003
±0.005
0.030
0.027
±0.004
0.018
±0.003
0.027
±0.004
0.026
±0.004
10 Clade VIII
6 0.001
±0.000
0.026
±0.004
0.023
±0.004
0.024
±0.004
0.030
±0.005
0.030
±0.005
0.024
±0.004
0.029
±0.004
0.028
±0.004
0.027
±0.004
Fig. 1. Sampling sites of blue-spotted maskrays, Neotrygon spp. previously under Neotrygon kuhlii, including new
samples from present study, samples from the literature, and additional haplotypes from BOLD, Cryobank and
GenBank (details in Supplementary Table S1). Individuals were identified to species according to present revision,
from either their COI or cytochrome b gene sequence. Roman numbers I-VIII designate the haplogroups or clades
reported previously [19, 23], four of which have since been described or redescribed [24] (Table 1). Surface of
symbol (circle or triangle) proportional to sample size. A. I
1, I2 and I3: clade I from, respectively, Tanzania (N=7),Tamil Nadu (N=7) and Vizakhapatnam (N=1). V
1and V
7: N. australiae from, respectively, Ningaloo Reef (N=2) and
Gulf of Carpentaria (N=5). G: Guadalcanal maskray (N. kuhlii according to [24]), Honiara, Solomon archipelago
(N=1); Open triangles: N. trigonoides; solid triangle: Vanikoro, type locality of N. kuhlii; inset: see Fig. 1B. B.
Enlarged map of the Indo-Malay archipelago. II
1, II
2, II
3and II
4: clade II from, respectively, Banda Aceh region
(N=11), Meulaboh (N=3), Sibolga (N=10) and Padang (N=10). III
1and III
2: clade III from, respectively, Andaman-Sea
coast of Thailand (N=5) and Kuala Lama region (N=25). N. varidens: IV
1 from Kuala Selangor (N=1), IV3from
Haiphong (N=2), IV
5from Karimata Strait (N=1/8), IV
7from Beibu Gulf (N=1), IV
8from Sarawak (N=1/4), IV
13from
Penghu (N=4), IV
14from Taiwan (N=8). N. orientale: IV
2from Riau archipelago (N=4), IV
4from the western Java Sea
(N=40), IV
5 from Karimata Strait (N=7/8), IV6 from Batang (N=7), IV8 from Sarawak (N=3/4), IV9from Bali Strait
(N=7), IV
10from the western Sulawesi Sea (N=11), IV
11from Sandakan (N=2), IV
12from Makassar (N=7), IV
15from
Bone Bay (N=2), IV
16from Tomini Bay (N=3), IV
17from Cagayan (N=12), IV
18from Kendari (N=7), IV
19from
Lapu-Lapu (N=7), IV
20 from Bitung (N=12), IV21from Tanjung Luar (N=2). VI
1, VI
2, VI3 and VI4: N. caeruleopunctata from,respectively, Pelabuhan Ratu (N=8), Sadang (N=4), Bali Strait (N=3) and southern Bali Island (N=14). N. australiae:
V
2from Tanjung Luar (N=5), V
3from Labuan Bajo (N=8), V
4from off Rote Island (N=3), V
5from Tanjung Sulamo
(N=1), V
6from Kupang (N=3), V
8from Torres Strait (N=1), V
9from the northern Great Barrier Reef (N=1). VII
1, VII2:clade VII from, respectively, Ambon (N=6) and Kei Islands (N=20). VIII
1, VIII
2: clade VIII from, respectively, Pulau
Numfor (N=2) and Biak (N=18). R: Ryukyu maskray, Ishigaki-shima, Ryukyu archipelago (N=1).
Fig. 2. Maximum-likelihood phylogeny (M
EGA
6
[43]; Tamura-Nei model with gamma-distributed rate differences
among sites + invariant sites [44]; partial deletion) of blue-spotted maskrays Neotrygon spp. previously under N.
kuhlii, based on nucleotide sequences of the concatenated CO1+ cytochrome b gene fragments. A total of 133
individual sequences (Supplementary Table S1), aligned over 1640 bp, was retained in the final dataset, after all
positions with less than 95% site coverage had been eliminated. N. trigonoides was used as outgroup [16]. Roman
numbers I-VIII designate the haplogroups or clades reported previously [19]. Numbers at a node are bootstrap
scores (from 600 bootstrap resampling runs). Vertical black bars summarize the partition obtained according to
Puillandre’s gap detection analysis, ABGD. Vertical grey bars summarize the partition into species obtained from
GMYC analysis (S
PLITS
; single-threshold option). Open bars: partition into species finally retained considering tree
topology, nucleotide divergence between lineages, and results of ABGD and GMYC analyses.
Fig. 3. Nuclear phylogenies of the blue-spotted maskray, Neotrygon spp. A. Maximum-likelihood phylogeny (M
EGA
6
[43]; Jukes-Cantor model [51]) with gamma-distributed rate differences among sites; partial deletion] of Gh5
intron sequences. A total of 18 individual sequences aligned over 356 bp was retained in the final dataset, after all
positions with less than 95% site coverage had been eliminated. N. trigonoides was used as outgroup [16].
Numbers at a node are bootstrap scores (from 1000 bootstrap resampling runs). B. Summary of the Bayesian
phylogeny based on partial RAG-1 sequences (redrawn from figure 2a of [17]; lineage names edited according to
Table 1). Numbers at a node are posterior probabilities.
1
12
40
A
B
30°N
30°S
0°
25°E
70°E
115°E
160°E
115°E
0°
N. orientale
N. varidens
R
II
1
III
1
IV
1
VII
1
VI
1
VI
4
V
2
/IV
21
V
3
V
4
V
8
V
9
V
5
V
6
IV
4
IV
5
IV
6
IV
8
IV
9
/VI
3
IV
10
IV
11
IV
13
IV
14
IV
17
IV
15
IV
16
IV
19
IV
20
IV
18
IV
12
IV
3
IV
7
IV
2
VII
2
VIII
2
III
2
II
2
II
3
I
1
I
2
I
3
II
4
N. caeruleopunctata
N. australiae
clade III
clade II
V
1
V
7
VI
2
VIII
1
G
clade VII
clade VIII
KNS-BIT5-18 KNS-BIT9-7 KNS-BIT2-15 KNS-BIT11-9 KNS-BIT12-10 KNS-BIT7-5 KNS-BIT6-19 KNS-BIT1-14 KNS-BIT10-8 KNS-BAS4-2 KNS-BAS5-3 KNS-TAL4-76 KNS-WJS2-8 KNS-WJS5-91 KNS-WJS4-10 KNS-WJS6-12 KNS-BAS1-87 KNS-BAS2-77 KNS-RIA1-30 KNS-RIA3-32 KNS-WJS5-11 KNS-WJS3-89 KNS-WJS6-92 KNS-WJS4-25 KNS-WJS3-35 KNS-WJS7-13 KNS-RIA2-31 KNS-WJS4-90 KNS-WJS1-22 KNS-WJS3-9 KNS-WJS1-88 KNS-WJS2-93 KNS-WJS1-7 JN184065 KNS-WSS5-30 KNS-POS1-61 KNS-POS2-49 KNS-POSO4-50 KNS-BIT3-16 KNS-WSS3-28 KNS-WSS4-29 KNS-WSS1-26 KNS-WSS2-27 KNS-MAK2-21 KNS-MAK6-25 KNS-MAK1-20 KR019777 KNS-KEN5-70 KNS-KEN7-83 KNS-KEN3-69 KNS-KEN2-81 wjc629 KC992792 KNS-PAD3-18 KNS-PAD4-19 KNS-PAD6-21 KNS-PAD2-17 KNS-ACE1-12 KNS-KUP1-26 KNS-KUP2-27 KNS-TAL1-74 KNS-LAB6-5 KNS-LAB3-2 KNS-MAL3-33 KNS-MAL5-35 KNS-MAL6-36 KNS-MAL4-34 KNS-MAL2-32 KNS-MAL7-37 cag1 cag2 cag3 cag4 cag5 cag6 cag7 cag8 cag9 cag10 cag11 cag12 lap4 lap1 lap3 lap2 KNS-BAL-D KNS-BAS3-1 KNS-BAL-C KNS-BAL-E KNS-BAL-A KNS-BAL-S KNS-BAL-B KNS-PEL4-45 KNS-PEL3-44 KNS-PEL15-22 KNS-PEL1-43 KNS-PEL2-65 KNS-PEL5-46 KNS-PEL6-78 KNS-PEL9-16 ZANZ1 KNS-TZN1-52 KNS-ZAN3-86 KNS-ZAN4-71 KNS-ZAN5-80 KNS-TAL6-64 KNS-LAB4-3 KNS-LAB5-4 AM4 AM5 AM1 AM2 KNS-KEI4-54 KNS-KEI7-73 KNS-KEI6-56 KNS-KEI12-38 KNS-KEI2-53 KNS-KEI3-72 KNS-KEI5-55 AM6 AM3 KNS-BIA3-39 KNS-BIA6-42 KNS-BIA7-66 KNS-BIA2-38 KNS-BIA4-40 KNS-BIA5-41 KNS-NC4-84 NC2 MNHN2009-0823 NC1 CSIRO uncat. NC3 IRD20090816 KNS-NC5-67 KNS-NC6-68

![Fig. S1 Maximum-likelihood phylogeny [M EGA 6 (Tamura et al. 2013); Tamura 3-parameter model (Tamura 1992) with gamma-distributed rate differences among sites; partial deletion] of Neotrygon spp., including four new species formerly under N](https://thumb-eu.123doks.com/thumbv2/123doknet/13710575.434402/52.918.185.751.54.1045/maximum-likelihood-phylogeny-parameter-distributed-differences-neotrygon-including.webp)
![Fig. S2 Maximum-likelihood phylogeny [M EGA 6 (Tamura et al. 2013); Tamura-Nei model (Tamura & Nei 1993) with gamma-distributed rate differences among sites, invariable sites allowed; partial deletion]](https://thumb-eu.123doks.com/thumbv2/123doknet/13710575.434402/53.918.191.758.50.1016/maximum-likelihood-phylogeny-tamura-distributed-differences-invariable-deletion.webp)
