HAL Id: hal-03117760
https://hal.archives-ouvertes.fr/hal-03117760
Submitted on 21 Jan 2021
HAL is a multi-disciplinary open access
archive for the deposit and dissemination of sci-entific research documents, whether they are pub-lished or not. The documents may come from teaching and research institutions in France or
L’archive ouverte pluridisciplinaire HAL, est destinée au dépôt et à la diffusion de documents scientifiques de niveau recherche, publiés ou non, émanant des établissements d’enseignement et de recherche français ou étrangers, des laboratoires
resources
Samuel Ginot, Camille Le Noëne, Jacques Cassaing
To cite this version:
Samuel Ginot, Camille Le Noëne, Jacques Cassaing. Comparative bite force in two syntopic murids (Rodentia) suggests lack of competition for food resources. Canadian Journal of Zoology, NRC Re-search Press, 2018, 96 (6), pp.633-638. �10.1139/CJZ-2017-0243�. �hal-03117760�
Draft
Comparative bite force in two syntopic murids (Rodentia) suggests lack of competition for food resources.
Journal: Canadian Journal of Zoology
Manuscript ID cjz-2017-0243.R2
Manuscript Type: Article
Date Submitted by the Author: 26-Oct-2017
Complete List of Authors: Ginot, Samuel; Institut des sciences de l'evolution, Le Noëne, Camille; UMR 5554 CNRS
Cassaing, Jacques; UMR 5554 CNRS, Université Montpellier 2
Keyword: Performance, niche overlap, coexistence, sex dimorphism, short-tailed mouse (Mus spretus), wood mouse (Apodemus sylvaticus)
Draft
Comparative bite force in two syntopic murids (Rodentia) suggests lack of competition
1
for food resources.
2
Authors : Samuel Ginot* (1), Camille Le Noëne (1), Jacques Cassaing (1) 3
(1) Institut des Sciences de l’Evolution de Montpellier – UMR 5554. Université Montpellier
4
2, CNRS, IRD, EPHE – cc 064. F 34095 Montpellier cedex 05.
5 [email protected] 6 [email protected] 7 [email protected] 8
*Corresponding author: [email protected]. 9
Draft
Ginot, S., Le Noëne, C., Cassaing, J. "Comparative bite force and competition in two
11
syntopic murids (Rodentia)."
12
13
Abstract
14
Closely related syntopic species have been shown to avoid competition by differentiating in 15
the type of food they process. This can be achieved by changes in size or in the masticatory 16
apparatus that produce modifications in bite force. The wood mouse (Apodemus sylvaticus 17
L., 1758) and short-tailed mouse (Mus spretus Lataste, 1883) are two murid rodent species 18
found in syntopy in the south of France. We measured bite force in wild specimens of both 19
species to test for differences in performance. Despite its greater body mass, the wood mouse 20
showed only slightly higher bite force than the short-tailed mouse. We found no clear sexual 21
dimorphism in either species, however among the males of the short-tailed mouse, two 22
groups appeared in terms of bite force. This bite force difference may correspond to a hierar-23
chical organisation of these males. Overall, it seems that both species have similar bite forces 24
and accordingly overlap in the resources they use. Other factors may exist that create a niche 25
differentiation between the wood mouse and the short-tailed mouse. Another explanation 26
may be a great abundance of food, which would cancel competition for this resource in these 27
species. 28
Résumé
29
Il a été montré que les espèces proches vivant en syntopie évitent la competition en différen-30
ciant le type de nourriture qu'elles utilisent. Cela peut être permis par des changements de 31
taille ou dans l'appareil masticateur qui sont à l'origine de différences dans la force de mor-32
sure. Le mulot sylvestre (Apodemus sylvaticus L. 1758) et la souris à queue courte (Mus 33
Draft
spretus Lataste 1883) sont deux espèces de rongeurs muridés trouvés en syntopie dans le sud
34
de la France. Nous avons mesuré la force de morsure chez des specimens sauvages des deux 35
espèces pour tester de potentielles différences de performance. Bien que le mulot sylvestre 36
soit plus gros, sa force de morsure n'est que légèrement plus haute que celle de la souris à 37
queue courte. Nous n'avons pas détecté de dimorphisme sexuel marqué au sein des deux es-38
pèces, cependant parmi les souris à queue courte mâles, il apparaît deux groupes en termes 39
de force de morsure. Ceux à la morsure plus forte pourraient représenter des mâles domi-40
nants, tandis que ceux à la morsure plus faible seraient des subordonnés. Généralement, les 41
deux espèces ont des forces de morsures similaires, et par conséquent montrent un grand 42
chevauchement dans les ressources qu'elles peuvent utiliser. D'autres facteurs pourraient 43
exister qui créeraient une différenciation de niche entre le mulot sylvestre et la souris à 44
queue courte. Une explication alternative pourrait être la présence de nourriture en abon-45
dance, qui supprimerait la compétition entre les deux espèces à ce niveau. 46
47
Keywords
48
Performance ; short-tailed mouse (Mus spretus) ; wood mouse (Apodemus sylvaticus) ; niche 49
overlap ; coexistence ; sex dimorphism 50
Draft
Introduction51
Syntopic species (sensu Rivas 1964), i.e. species sharing the micro-habitats, have long 52
been known to differentiate in their ability to cope with food types and hardnesses to reduce 53
competition (e.g. Grant 1968; Grant 1972; Verwaijen et al. 2002; Yamashita et al. 2009). 54
Grant (1972) particularly highlighted that there was often significant disparities in size 55
among coexistent species with similar needs and that this was probably due to ecological and 56
evolutionary factors. His synthesis ended by the hypothesis that the advantage to the larger 57
species may be the free access to food, due to dominance, and the ability to deal with larger 58
and/or harder seeds; while the smaller species might have a greater efficiency in energy ex-59
traction from the foods it exploits, and being better at avoiding predators. Such a dichotomy 60
can be achieved either by evolution toward a greater body size, or by changes in the mastica-61
tory apparatus (e.g.Van Daele et al. 2009). Therefore, comparing pairs of syntopic species at 62
their natural localities can be very fruitful in highlighting ecological performance differences 63
and niche separation. Thus, Verwaijen et al. (2002) correlated bite force and prey hardness in 64
two species of lacertid lizards, and proposed that differences in bite force are an important 65
factor in prey handling efficiency and also influence prey selection in nature. In a large set of 66
turtle species, Herrel et al. (2002) demonstrated that in vivo bite force was correlated with 67
trophic ecology, as well as head height. Similar results were found in large Neotropical cats 68
(Kiltie et al. 1984) which differenciate from each other in terms of skull morphology, gape 69
and bite force under the influence of ecological character displacement. In Neotropical bats, 70
the amazing diversity of skull shapes among the phyllostomid radiation was also explained 71
in terms of bite force and dietary niche (Aguirre et al. 2002). Yamashita and colleagues 72
(2009) found that sympatric (living in the same national park, but not necessarily syntopic) 73
lemurs from Madagascar, all feeding on bamboo, specialized on different part of the plant 74
Draft
and accordingly segregated in their feeding behaviours. Finally, comparing two Cricetidae 75
rodent species with different sizes and diets Williams et al. (2009) highlighted the im-76
portance of gape in the biting performance. They showed that the larger species, which is 77
also carnivorous, could maintain a large proportion of its maximal bite force at wide gape 78
angles due to a more derived and advantageous condition of the jaw muscles (notably a low-79
er stretch factor). 80
According to the various studies cited above, the measure of bite force appears to be a 81
great tool to address the evolution of food niche dimension and separation. The wood mouse 82
Apodemus sylvaticus (L., 1758) and the short-tailed mouse Mus spretus (Lataste, 1883)–two
83
murid species often found in syntopy (i.e. caught in the same trap lines) in southern France– 84
are good candidates to run such a study. The two species share several habitats and most 85
food items (Bauduin et al. 2013; Cassaing et al. 2013). Therefore, they may be considered to 86
be in a situation of competition for food, yet they seem to coexist at least since the Holocene 87
period. The wood mouse is about 1.5 times larger than the short-tailed mouse. In an experi-88
mental setting in the wild, it has been shown that these rodents can carry and eat larger seeds 89
than equivalent individuals of the short-tailed mouse (Muñoz and Bonal 2008). The question 90
remains as whether it also displays differences in terms of ingestion and comminution of 91
food items. For its part, the short-tailed mouse demonstrates great skills to retrieve food 92
sources. Notably, this species appears to use inadvertent information released by others 93
(Valone 1989; Doligez et al. 2003; Danchin et al. 2004; Parejo et al. 2004), even heterospe-94
cifics (Cassaing et al. 2013). This may be highly expensive for the wood mouse if it gets its 95
food caches used by the short-tailed mouse. To our knowledge, there has been no evidence 96
so far that the short-tailed mouse does not achieve the second part of Grant’s (1972) predic-97
tion mentioned above (i.e. that it is better at energy extraction and predator avoidance). 98
Draft
We will focus here on the first step of ingestion by measuring the bite force of both spe-99
cies in the wild. This measure, which notably depends on the biomechanics of the skull and 100
associated muscles, is a good proxy of the diet- and competition-related ecological perfor-101
mance, at the inter- and intraspecific levels (Davis et al. 2010; Santana et al. 2010). Myo-102
morphous rodents, such as the species studied here, have been hypothesized to be "high-103
performance generalists", according to Cox et al. (2012). If this holds true, we may expect 104
strong bite forces in the two murids studied here, compared to values reported in the litera-105
ture for non-murid rodents. Among them, we expect bite force to correlate body size, both at 106
the interspecific (Freeman and Lemen 2008; Ginot et al. 2018), and intraspecific level 107
(Becerra et al. 2011). Within species, we may find sex dimorphism in bite force, associated 108
with intra-sex competition, as reported by Becerra and colleagues (2011) in another species 109
of rodent (Ctenomys talarum). Interspecifically, the wood mouse is much larger than the 110
short-tailed mouse and it should display much stronger bites. Because both species occur in 111
syntopy -and feed mostly on the same items (Bauduin et al. 2013; Cassaing et al. 2013)- the 112
difference in bite force may be expected to be large, reducing competition for food (i.e. by 113
giving access to harder and larger items to the largest species). On the other hand, the differ-114
ence may be reduced if resources are widely available, therefore producing no competition 115
between both species, and if other factors (e.g. behaviour differences, intra-specific competi-116
tion) do not influence bite force. 117
118
Materials & methods
119
Individuals of both species were first sampled in a garrigue near Montpellier (43° 34’ 120
38” N, 03° 43’ 06” W) , with a mix of custom-built multi-catch traps (described in Cassaing 121
1986) and Victor® Tin Cat® traps set up in a 7 x 7 grid. The traps were 25 m apart, so the 122
Draft
grid covered 2.25 ha. An exhaustive description of the site can be found in Cassaing et al. 123
(2013). At this site, we captured 45 specimens of wood mice and 27 short-tailed mice. Addi-124
tional samplings (wood mouse n = 49 ; short-tailed mouse n = 8) were carried out at the Lu-125
naret zoo in Montpellier in a large mixed wood (Holm oak, Aleppo pines) with dense under-126
neath vegetation, setting the same traps every 10 meters along a 100 meter-long line. Alt-127
hough caught within the zoo area, these specimens were wild, living in unkept spaces be-128
tween the enclosures. Six specimens of wood mice were also captured in the Caroux moutain 129
range (Hérault, France) near the village of Douch (altitude 700m), using the same trap densi-130
ty as for the zoo samples. Wood mice and short-tailed mice were caught in the same trap 131
lines (sometimes even in the same traps), except in the Douch locality, where only wood 132
mice were caught, probably because it is at the limits of the short-tailed mouse's range. 133
We determined the rodents’ age on the basis of their weight, which is known to have a 134
good correlation with genuine age (Pearson's correlation: male R²=0.88, female R²=0.79, 135
with p<0.05 for both sexes according to Frynta and Zižková 1992). Broad age categories 136
were defined as follows: for the short-tailed mouse, juveniles <10g ; subadults 10 to 13g ; 137
adults >13g; for the wood mouse, juveniles <15g ; subadults 15 to 20g ; adults >20g. We 138
recorded their sex and their apparent reproductive status by morphological features (e.g. tes-139
tis position, opening of the vagina, nipple condition, suspected gestation). 140
Shortly after capture we measured the animals' voluntary bite force at the incisors using 141
a piezoelectric force transducer (Kistler, type 9203, range 0-500 N, accuracy 0.01–0.1 N; 142
Amherst, NY, USA ; calibrated by the constructor at 25 °C and 36% humidity) attached to a 143
handheld charge amplifier (Kistler, type 5995, Amherst, NY, USA ; Herrel et al. 1999). The 144
force transducer was mounted between two steel bite plates as described in Herrel et al. 145
(1999). We adjusted the distance between the bite plates by measuring it with a caliper, and 146
Draft
by increasing or decreasing it via the micrometer head, so that each individual had a gape 147
angle of approximately 30° (Dumont and Herrel 2003), at which we found the rodents bit 148
most consistently. All animals bit directly onto steel at the same spot on the plates (i.e. at the 149
tip), to ensure a consistent out-lever length. We recorded three trials in a row for each indi-150
vidual, and the maximal score was used in the analyses. Body mass (g) was recorded using a 151
Pesola® LightLine tubular weighing scale. Bite force over body weight ratios were also 152
computed (Bite Force Quotient, or BFQ, Table 1), after converting mass (g) to weight (N), 153
by dividing it by 1000 g/kg and multiplying by 9.8 m/s². 154
All field procedures were under the Approval No. A34-172-042 (Hérault Prefecture). 155
The animals were gently handled, and when necessary, marked by toe-tattooing (e.g. 156
Leclercq and Rozenfeld 2001) to avoid duplicated measurements. All individuals were re-157
leased at the location of their capture after manipulations. 158
Difference in mean bite forces, mass and BFQ between species, as well as differences in 159
bite force between sexes were tested using two-tailed Student's t-tests. Correlations between 160
bite force and weight were assessed by fitting least-squares linear regressions, and differ-161
ences between the slopes and intercepts were tested using an ANCOVA. Allometric trajecto-162
ries of log bite force against log body mass were tested against the expected slope of 2/3 for 163
isometric scaling by linear regressions. Distribution of bite forces within sexes were visually 164
inspected and tested for multimodality using Hartigan's dip test. All analyses were run in R 165 (R Core Team 2017). 166 167 Results 168
Both species have a similar bite force, barely higher for the wood mouse than for the 169
short-tailed mouse (mean=9.08, max=12.66, min=3.50 for the wood mouse; mean=8.31, 170
Draft
max=11.20, min=5.13 for the short-tailed mouse, Table 1). Although apparently negligible, 171
the difference between mean absolute bite force values was significant (Student's t-test: 172
t=2.13, df=64, p<0.05). When comparing only adult specimens with sexes pooled between
173
both species (mean=9.73 ± 2.01 for adult wood mouse ; mean=8.93 ± 1.75 for adult short-174
tailed mouse), the difference was not significant (Student's t-test: t=1.59, df=30, p=0.123). 175
On the other hand, interspecific differences of mean body mass (g) values were significant 176
either when looking at the whole dataset (Student's t-test: t=10.60, df=81, p<0.01) or only at 177
adults (Student's t-test: t=11.30, df=33, p<0.01). In accordance with the literature, the wood 178
mouse was almost 1.5 times bigger than the short-tailed mouse (20.42 g and 13.72 g respec-179
tively on average). Therefore, BFQ mean value was significantly higher for the short-tailed 180
mouse than the wood mouse (Student's t-test: t=5.70, df=43, p<0.01). 181
When body mass was plotted against bite force (Fig. 1), both species showed similar 182
ranges in bite force and body mass. Both linear regressions showed a significant relationship, 183
however with fairly low coefficients of determination (short-tailed mouse: R²=0.14, df=32, 184
p<0.05 ; wood mouse: R²=0.24, df=99, p<0.01). The ANCOVA run on both species showed
185
that as a whole, body mass had a significant effect on bite force (F=39.22, df=1, p<0. 186
001) and that the slopes were almost exactly identical to each other (F=0.00, df=1, p=0.988, 187
i.e. the relationship between bite force and body mass is the same for both species).
Further-188
more, the intercepts were not significantly different between both species (F=2.90, df=1, 189
p=0.091), although the regression line for the short-tailed mouse was slightly higher than
190
that of the wood mouse. Tests of the slopes of log bite force against log body mass showed 191
no significant deviation from isometry (p=0.096 for the wood mouse, p=0.202 for the short-192
tailed mouse). 193
Draft
Looking at adults within species, we found that the female short-tailed mice did not bite 194
significantly harder than males (Student's t-test: t=1.96, df=14, p=0.069). No sex dimor-195
phism was found in terms of body mass (Student's t-test: t=0.66, df=7.37, p=0.526). Like-196
wise, in the wood mouse there was no difference in either bite force (Student's t-test: t=-197
0.35, df=36.67, p=0.725), or body mass (Student's t-test: t=-1.38, df=30.10, p=0.176) be-198
tween sexes. 199
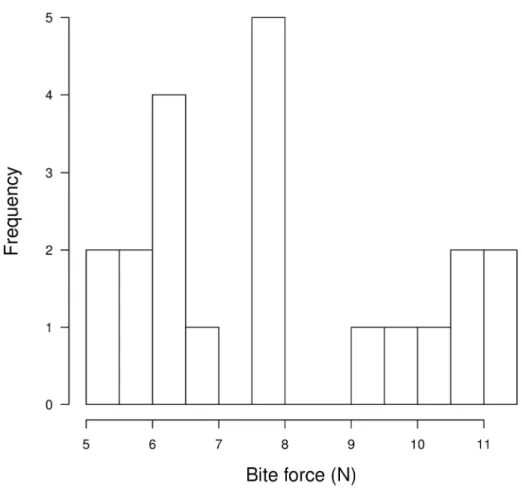
Visual inspection (Fig. 2) of the distribution of bite forces in short-tailed subadult and 200
adult males reveals two groups, the first one with 14 individuals (11 subadults and 3 adults), 201
had a mean of 6.59 N, and a range from 5.13 N to 7.82 N. The other group, with 7 individu-202
als (2 subadults and 5 adults), had a mean of 10.38 N, with a range from 9.33 N to 11.20 N. 203
Despite the large gap between both groups, Hartigan's dip test for multimodality showed that 204
the distribution was not significantly different from unimodality (D=0.10, p=0.33). Compar-205
ing short-tailed mouse adult and subadult males with the higher bite forces to conspecific 206
adult and subadult females, we found a significant difference in mean bite force (Student's t-207 test: t=3.61, df=18, p<0.01). 208 209 Discussion 210
The two murids we studied showed a consistent bite force compared with published data 211
on murid rodents. Cox et al. (2012) for example, reported an average in vivo bite force of 212
31.1 ± 10.75 N in laboratory R. norvegicus, which is much bigger than the species studied 213
here. Between our species, the difference in bite force appeared to be small compared to the 214
difference in body mass, and was not signicant in adults. As shown by its greater average 215
BFQ (Table 1), the short-tailed mouse M. spretus had a greater bite force relative to its size, 216
compared to the wood mouse A. sylvaticus. Within species, a significant positive relationship 217
Draft
was found between bite force and size (represented here by body mass), as was found other 218
vertebrates (Herrel and Gibb 2006). Indeed, the lightest individuals, likely the youngest, 219
showed an absolute bite force lower than that of the heavier ones (Fig. 1). Furthermore, we 220
found that bite force scaled isometrically with body mass in both our species, showing that, 221
relative to their mass, the lighter individuals do not have lower bite force than heavier indi-222
viduals. 223
Short-tailed mouse adult females bit on average harder than males, although not signifi-224
cantly. Furtermore, adult males in this species appeared to be split in two groups in terms of 225
bite force (Fig. 2). However, the distribution was not significantly different from unimodali-226
ty, perhaps due to small sample size. Still, this result is in line with those of staged dyadic 227
encounters reported by Cassaing (1984). That study suggested some behavioural differences 228
in males due to social hierarchy, and this may influence bite force as well. The adult males 229
with the weaker bite forces could be the subordinate ones, while the other group would com-230
prise the more dominant males. The mean bite force of the latter group is significantly higher 231
than the one of subadult and adult females. So the potentially more dominant males appear to 232
bite harder than the females, in accord with to previous results on rodents (e.g. Becerra et al. 233
2011). Altough our data may fit with Cassaing's (1984) and Hurst's (1994) hypotheses that 234
male short-tailed mice display hierarchical relationships (with dominant or subordinate sta-235
tus), it is not sufficent to explain or quantify them, and it was not the goal of this study. One 236
way to assess how bite force and social status may be linked to each other in the short-tailed 237
mouse would be by measuring bite force in dominant and defeated individuals of male-male 238
encounters (e.g. Husak et al. 2006). 239
Our results show a suprisingly close bite force for the two syntopic murines studied 240
here. As far as bite force is concerned, their abilities to break down hard seeds seem to be 241
Draft
similar. Even if the wood mouse could handle larger acorns thanks to its greater body size -242
as showed by Muñoz and Bonal (2008) in Central Spain- it should be noted that the higher 243
range of acorns occurring in Spain is missing in garrigues in southern France where animals 244
were captured. It seems that in our case both species eat the same seeds (Bauduin et al. 2013) 245
and share the same habitat (Cassaing et al. 2013), therefore displaying a great niche overlap, 246
despite their important size differences. This would suggest that, in the areas we studied, the 247
competition for food is not a limiting factor. This may partially explain why the wood mouse 248
seems to show no attempt of pushing the short-tailed mouse aside, despite being used by the 249
latter as a cue to resource abundance. 250
It seems that niche partitioning between our species, if any, does not occur through a 251
qualitative difference in the access to harder foods. Resource partitioning may be produced 252
by other factors such as the level of the habitat being exploited (strictly on the ground, or at 253
least partially above and partially below it), the proportion of the animal parts in the diet, and 254
the metabolic assimilation rate of both species. However, our data, as well as those of 255
Bauduin and colleagues (2013) seem to point toward a lack of competition for resources, 256
perhaps due to a great abundance of food in the localities studied rather than toward . 257
Draft
Acknowledgements258
The authors are grateful to workers of the Zoo de Lunaret in Montpellier, as well as François 259
Catzeflis, who allowed us to collect data during the trapping sessions at the zoo. We also 260
thank Pierre-Henri Fabre who organized fieldwork in the Caroux moutains and Thomas Tix-261
ier, who helped during fieldwork at the zoo as well as in Murviel-les-Montpellier. We are 262
very grateful to two anonymous reviewers for their exhaustive and in depth comments and 263
corrections, which greatly improved the quality of the manuscript. The authors received no 264
funding for this study. This publication is a contribution of the Institut des Sciences de l'Evo-265
lution de Montpellier (UMR5554 – UM2 + CNRS + IRD) No. ISEM 2017-255. 266
Draft
267
References
268
Aguirre, L. F., Herrel, A., Van Damme, R., and Matthysen, E. 2002. Ecomorphological 269
analysis of trophic niche partitioning in a tropical savannah bat community. Proc. R. 270
Soc. Lond. B: Biol. Sci. 269(1497): 1271-1278. 271
Anderson, R.A., Mcbrayer, L.D., and Herrel, A. 2008. Bite force in vertebrates: opportuni-272
ties and caveats for use of a nonpareil whole-animal performance measure. Biol. J. 273
Linn. Soc. 9:; 709-720. 274
Bauduin, S., Cassaing, J, Moussa, I., and Martin, C. 2013. Interactions between the short-275
tailed mouse Mus spretus and the wood mouse Apodemus sylvaticus: diet overlap re-276
vealed by stable isotopes. Can. J. Zool. 91: 102–109. 277
Becerra, F., Echeverría, A., Vassallo, A.I., and Casinos, A. 2011. Bite force and jaw biome-278
chanics in the subterranean rodent Talas tuco-tuco (Ctenomys talarum) (Caviomor-279
pha: Octodontoidea). Can. J. Zool. 89: 334–342. 280
Booth, W., Montgomery, W.I., and Prodöhl, P. A. 2007. Polyandry by wood mice in natural 281
populations. J. Zool. (Lond.) 273: 176-182. 282
Bryja, J., Patzenhauerová, H., Albrecht, T., Mošanský, L., Stanko, M., and Stopka, P. 2008. 283
Varying levels of female promiscuity in four Apodemus mice species. Behav. Ecol. 284
Sociobiol. 63: 251–260. 285
Cassaing, J. 1984. Interactions intra- et inter-spécifiques chez les souris sauvages du Midi de 286
la France, Mus musculus domesticus et M. spretus: conséquences sur la compétition 287
entre les espèces. Biol. Behav. 9: 281-293. 288
Cassaing, J. 1986. Les captures multiples chez les Rongeurs : fait du hasard ou phénomène 289
social ? Acta Theriol. 31: 239-248. 290
Draft
Cassaing, J., Cervera, S., and Isaac, F. 2010. Laboratory and field evidence of paternal care 291
in the Algerian mouse (Mus spretus). J. Ethol. 28: 7-13. 292
Cassaing, J., Le Proux de la Rivière, B., de Donno, F., Martinez Garcia, E., and Thomas, C. 293
2013. Interactions between two Mediterranean rodent species: habitat overlap and use 294
of heterospecific cues. Ecoscience, 20: 137‒147. 295
Cox, P.G., Rayfield, E.J., Fagan, M.J., Herrel, A., Pataky, T.C., and Jeffery, N, 2012. Func-296
tional Evolution of the Feeding System in Rodents. PLoS ONE, 7(4): e36299. 297
doi:10.1371/journal.pone.0036299 298
Danchin, E., Giraldeau, L.-A., Valone, T.J., and Wagner, R.H. 2004. Public Information: 299
From Nosy Neighbors to Cultural Evolution. Science 305: 487-491. 300
Davis, J.L., Santana, S.E., Dumont, E.R., and Grosse, I.R. 2010. Predicting bite force in 301
mammals: two-dimensional versus three-dimensional lever models. J. Exp. Biol. 213: 302
1844-1851 303
Doligez, B., Cadet, C., Danchin, E., and Boulinier, T. 2003. When to use public information 304
for breeding habitat selection? The role of environmental predictability and density 305
dependence. Anim. Behav. 66: 973–988. 306
Dumont, E., and Herrel, A. 2003 The effects of gape angle and bite point on bite force in 307
bats. J. Exp. Biol. 206: 2117-23. 308
Fons, R., Grabulosa, I., Saint Girons, M.-C., Galan-Puchades, M.T., and Feliu, C. 1988. In-309
cendie et cicatrisation des écosystèmes méditerranéens: Dynamique du repeuplement 310
en micromammifères. Vie Milieu, 38: 259-280. 311
Freeman, P.W., and Lemen, C. 2008. Measuring bite force in small mammals with a piezo-312
resistive sensor. J. Mammal. 89: 513–517. 313
Draft
Frynta, D., and Zizkova, M. 1992. Postnatal growth of Wood mouse (Apodemus sylvaticus) 314
in captivity. In Prague Studies in Mammalogy. Edited by I. Horáček and V. Vohralík. 315
Praha. Charles University Press pp. 57-69. 316
Ginot, S., Herrel, A., Claude, J., and Hautier, L. 2018. Skull size and biomechanics are good 317
estimators of in vivo bite force in murid rodents. Anat. Rec. 301(2): 256-266. 318
Grant, P. R. 1968. Bill size, body size, and the ecological adaptations of bird species to com-319
petitive situations on islands. Syst. Biol. 17(3): 319-333. 320
Grant, P.R. 1972. Interspecific competition in rodents. Annu. Rev. Ecol. Syst. 3: 79-106. 321
Herrel, A., and Gibb, A.C. 2006. Ontogeny of performance in vertebrates. Physiol. Biochem. 322
Zool. 79: 1-6. 323
Herrel, A., and O’Reilly, J. C. 2005. Ontogenetic scaling of bite force in lizards and turtles. 324
Physiol. Biochem. Zool. 79(1): 31-42. 325
Herrel, A., Spithoven, L., Van Damme, and R., De Vree, F. 1999. Sexual dimorphism of 326
head size in Gallotia galloti: testing the niche divergence hypothesis by functional 327
analyses. Funct. Ecol. 13: 289–297. 328
Hurst, J. L., Hall, S., Roberts, R. and Christian, C. 1996. Social organization in the aborigi-329
nal house mouse Mus spretus Lataste: behavioural mechanisms underlying the spatial 330
dispersion of competitors. Anim. Behav. 51: 327-344. 331
Husak, J.F., Lappin, A.K., Fox, S.F., and Lemos-Espinal, J.A. 2006. Bite-Force Performance 332
Predicts Dominance in Male Venerable Collared Lizards (Crotaphytus antiquus). 333
Copeia 2: 301-306 DOI: 10.1643/0045-8511(2006)6[301:BPPDIM]2.0.CO;2 334
Khidas, K., Khammes, N., Kelloufi, S., and Aulagnier, S. 2002. Abundance of the wood 335
mouse Apodemus sylvaticus and the Algerian mouse Mus spretus (Rodentia, Muri-336
Draft
dae) in different habitats of Northern Algeria. Mammal. Biol. – Z. Säugetierekd. 67: 337
34-41. 338
Kiltie, R. A. 1984. Size ratios among sympatric Neotropical cats. Oecologia, 61(3): 411-416. 339
Leclercq, G. C., and Rozenfeld, F. M. 2001. A permanent marking method to identify indi-340
vidual small rodents from birth to sexual maturity. J. Zool. (Lond.) 254(2): 203-206. 341
Muñoz, A., and Bonal, R. 2008. Are you strong enough to carry that seed? Seed size/body 342
size ratios influence seed choices by rodents. Anim. Behav. 76: 709–715 343
Parejo, D., Danchin, E., and Aviles, J.M. 2004. The heterospecific habitat copying hypothe-344
sis: can competitors indicate habitat quality? Behav. Ecol. 16: 96–105. 345
Rivas, L. R. 1964. A reinterpretation or the concepts “Sympatric” and “Allopatric” with pro-346
posal or the additional terms “Syntopic” and “Allotopic”. Syst. Zool. 13(1): 42-43. 347
Santana, S.E., Dumont, E.R., and Davis, J.L. 2010. Mechanics of bite force production and 348
its relationship to diet in bats. Funct. Ecol. 24: 776-784 doi: 10.1111/j.1365-349
2435.2010.01703.x 350
Valone, T. 1989. Group foraging, public information and patch estimation. Oikos, 56: 357– 351
363. 352
Van Daele, P.A.A.G., Herrel, A., and Adriaens, D. 2009. Biting Performance in Teeth-353
Digging African Mole-Rats (Fukomys, Bathyergidae, Rodentia). Physiol. Biochem. 354
Zool. 82: 40–50. 355
Verwaijen, D., Van Damme, R., and Herrel, A. 2002. Relationships between head size, bite 356
force, prey handling efficiency and diet in two sympatric lacertid lizards. Funct. Ecol. 357
16: 842-850. 358
Draft
Williams, S.H., Peiffer, E., and Ford, S. 2009. Gape and Bite Force in the Rodents Ony-359
chomys leucogaster and Peromyscus maniculatus: Does Jaw-Muscle Anatomy
Pre-360
dict Performance? J. Morphol. 270: 1338-47. Doi: 10.1002/jmor.1076 361
Yamashita, N., Vinyard, C. J., and Tan, C. L. 2009. Food mechanical properties in three 362
sympatric species of Hapalemur in Ranomafana National Park, Madagascar. Am. J. 363
Phys. Anthropol. 139(3): 368-381. 364
Draft
TABLES365
Table 1 : Bite force, body mass, and bite force quotient (bite force/weight ratio) measured in
366
two syntopic species of murine rodents, the short-tailed mouse Mus spretus and the 367
woodmouse Apodemus sylvaticus. Values shown in the table represent the mean ± 368
standard deviation for each subset. Sex was recorded based on the presence of testi-369
cles or nipples, age class is based on body mass (for M. spretus : juveniles < 10g ; 370
10g < subadults < 13g ; > 13g adults. For A. sylvaticus : juveniles < 15g ; 15g < 371 subadults < 20g ; > 20g adults). 372 Apodemus sylvaticus (n=103) Females (n=42) Males (n=61) Juveniles (n=4) Subadults (n=22) Adults (n=16) Juveniles (n=3) Subadults (n=19) Adults (n=39)
Bite force (N) Sex (Age
class) mean 7.63 ± 0.91 8.57 ± 1.83 9.6 ± 1.65 6.67 ± 1.05 8.28 ± 1.26 9.79 ± 2.17 Sex mean 8.87 ± 1.78 9.24 ± 2.10 Species mean 9.09 ± 1.97 Body mass (g) Sex(Age class) mean 12.88 ± 1.65 17.18 ± 1.25 22.63 ± 2.47 11.25 ± 2.88 18.61 ± 0.99 23.67 ± 2.67 Sex mean 18.85 ± 3.71 21.50 ± 3.99 Species mean 20.42 ± 4.07 BFQ (Bite force/weight) Sex(Age class) mean 61.11 ± 11.00 50.72 ± 9.02 43.34 ± 6.26 62.45 ± 13.80 46.25 ± 8.34 42.40 ± 9.75 Sex mean 48.90 ± 9.66 44.53 ± 10.42 Species mean 46.35 ± 10.29 Mus spretus (n=35) Females (n=13) Males (n=22)
Draft
Juveniles (n=0) Subadults (n=6) Adults (n=7) Juveniles (n=1) Subadults (n=10) Adults (n=10)Bite force (N) Sex(Age
class) mean NA 7.81 ± 0.44 9.83 ± 0.61 10.38 ± NA 7.13 ± 1.80 8.30 ± 2.03 Sex mean 8.89 ± 1.17 7.97 ± 2.074 Species mean 8.31 ± 1.80 Body mass (g) Sex(Age class) mean NA 12.00 ± 1.22 16.29 ± 3.90 9 ± NA 11.90 ± 0.66 15.25 ± 1.57 Sex mean 13.16 ± 3.61 13.36 ± 2.26 Species mean 13.72 ± 2.85 BFQ (Bite force/weight) Sex(Age class) mean NA 66.97 ± 7.85 63.88 ± 11.91 117.72 ± NA 61.44 ± 16.12 55.12 ± 9.75 Sex mean 65.31 ± 9.96 61.11 ± 18.38 Species mean 62.72 ± 15.66
Draft
373
FIGURE LEGENDS
374
Figure 1 : Bite force plotted against body mass in two syntopic murids of the south of
375
France, Apodemus sylvaticus and Mus spretus. Solid lines are the least-square regres-376
sion lines for each species. Dashed lines represent the limits of the age categories 377
based on body mass for each species (to the left of the line are juveniles, in the mid-378
dle are subadults, and to the right are adults). 379
Figure 2 : Histogram of bite force in adult and subadult males of Mus spretus, representing
380
the two groups of potentially dominant and subordinate individuals. 381
Draft
Figure 1 : Bite force plotted against body mass in two syntopic murids of the south of France, Apodemus sylvaticus and Mus spretus. Solid lines are the least-square regression lines for each species. Dashed lines
represent the limits of the age categories based on body mass for each species (to the left of the line are juveniles, in the middle are subadults, and to the right are adults).
Draft
Figure 2 : Histogram of bite force in adult and subadult males of Mus spretus, representing the two groups of potentially dominant and subordinate individuals.