Publisher’s version / Version de l'éditeur:
Vous avez des questions? Nous pouvons vous aider. Pour communiquer directement avec un auteur, consultez la
première page de la revue dans laquelle son article a été publié afin de trouver ses coordonnées. Si vous n’arrivez pas à les repérer, communiquez avec nous à [email protected].
Questions? Contact the NRC Publications Archive team at
[email protected]. If you wish to email the authors directly, please see the first page of the publication for their contact information.
https://publications-cnrc.canada.ca/fra/droits
L’accès à ce site Web et l’utilisation de son contenu sont assujettis aux conditions présentées dans le site LISEZ CES CONDITIONS ATTENTIVEMENT AVANT D’UTILISER CE SITE WEB.
Internal Report (National Research Council of Canada. Institute for Research in Construction), 1993-09
READ THESE TERMS AND CONDITIONS CAREFULLY BEFORE USING THIS WEBSITE.
https://nrc-publications.canada.ca/eng/copyright
NRC Publications Archive Record / Notice des Archives des publications du CNRC :
https://nrc-publications.canada.ca/eng/view/object/?id=90ab4808-f084-4f7b-90d6-1cabdf6ee2ce https://publications-cnrc.canada.ca/fra/voir/objet/?id=90ab4808-f084-4f7b-90d6-1cabdf6ee2ce
NRC Publications Archive
Archives des publications du CNRC
For the publisher’s version, please access the DOI link below./ Pour consulter la version de l’éditeur, utilisez le lien DOI ci-dessous.
https://doi.org/10.4224/20358877
Access and use of this website and the material on it are subject to the Terms and Conditions set forth at A System to Evaluate Fire Hazards of Materials Using a Small-Scale and Full-Scale Fire Test Methods
National Research Conseil national
i*i
Council Canada de recherches Canadai,ii
ic, ::l.<:j Institute for lnstiiut de
t e II'I b +? Research in recherche en
,3'z
Construction constructionE?c=cIWc
A System to Evaluate
Fire
Hazards
of Materials Using
a
Small-Scale and
Full-Scale Fire Test Methods
by Andrew Kim and Robert Onno
Internal Report No. 649
Date of issue: September 1993
,.... ;. . . , .
,
.. ,<~ .~. ...-.
* .YJ . wRC,Jf:MRCIn-teunal. ~ ~ ~ , : , ~ . t ; iriGti.t;s.ki;- 3 RO C'
.> ...
Hev l:::re~q{.~.~o~ A?~A;-.YSE 3e1
i-:ei-ei
.~+ea
0i.i: 1 i-.i;j4.-'ali... . ., ,.,
ANALYZED iti.ti:r-nai uer,c.y-'; : inr?i;j.-t:,,,te
f o r - i n
. .. ... .
,
,
..,
!,4. .. r cut? .. C:snailaCanad'3
This is an internal report of the Institute for Research in Construction. Although not intended for general distribution, it may be cited as a reference in other publications.
A SYSTEM TO EVALUATE FIRE HAZARDS OF MATERIALS USING SMALL- SCALE AND FULL-SCALE FIRE TEST METHODS
Andrew Kim and Robert Onno
ABSTRACT
Several small-scale test methods are available to determine the fire hazard of materials.
Small-scale tests, however, do not always reflect full-scale fire behaviour. Over the last few years, a number of papers have been published regarding this relationship between small-scale and full- scale tests. This report critically reviews those publications and examines the National Fire
Laboratory's test results in an attempt to find a method of classifying materials for their fire hazard. Two small-scale test methods (Cone and OSU) were evaluated and compared. A classification system, which relates cone calorimeter results to full-scale room burn results, is proposed
A SYSTEM TO EVALUATE FIRE HAZARDS OF MATERIALS USING SMALL- SCALE AND FULL-SCALE FIRE TEST METHODS
Andrew Kim and Robert OMO
INTRODUCTION
One of the foremost reasons for fire research has been providing the basis for test methods that can classify materials based on their degree of fire hazard. Interior lining materials have been the primary materials of interest, although furniture has also been an issue. Several small-scale test methods are available to determine the fire hazard of materials, however, small-scale test results do not always reflect full-scale fire behaviour. Some materials, when tested in the small- scale test environment, demonstrate completely different fire behaviour due to the limited material area and heat exposure of the small scale test. A number of researchers have attempted to find a relationship between small-scale and full-scale test results, however, no reliable predictions of
full-
scale results from small-scale tests have yet been found.
In analyzing the fire hazard of a material, there are three primary concerns: smoke
production rates, toxic chemical concentrations, and heat release rates. Smoke production reduces visibility in a building and thus hinders occupants' escape and firefighting operations. Toxic fire gases are usually carried with smoke and possibly incapacitate occupants who inhale that gas. Heat release rates are important because of their close relationship with rapid fire growth and fue spread in a building. There are varying opinions as to which of these concerns or combination of them is the true predictor of the potential level of hazard a material may possess. For example, limited visibility in a room due to high smoke production may, under some conditions, pose
an
equal or greater life-threatening hazard than heat release and under others may not. While toxicity is an important parameter for determining fire hazard, this aspect will not be addressed in this report. This report will concentrate on the smoke production and heat release rate results from full- scale and cone calorimeter testsas
the primary analysis tools.LITERATURE REVIEW
Heat release rate is thought to be one of the more important parameters in establishing the fire hazard of materials. There are two principal means of measuring heat release rates: the
thermopile method and the oxygen depletion method. The thermopile method uses temperature rise
in the thermopile to measure h&t rel&e rate, however, it possess~s some inaccuraciesdue to the heat loss through the test apparatus[l]. The oxygen depletion method is the preferred method and, today, most fire test methods measure heat release rate using the oxygen depletion method[2].
Janssens examined the oxygen depletion method in detail[3]. This method is based on the during combustion to measure the heat release rate. This results from the during combustion is, for most materials, proportional to the amount
process. That relationship is: Heat release = 13.1 MJ per kg of 02.
analyzed large-scale fire test data and summarized the
of fire testing. Post-flashover room fue theories 1970's, full scale room fire tests were being
developed by HuggetcS] and Parker[6] in by Fisher and Williamson[7].
Babrauskas and Peacock claim, in a recent paper, that heat release rate is the single most important variable in fue hazard[8]. They examined the time to death from a fue involving a single upholstered chair in a full-scale room, using HAZARD I, under the following conditions: normal, double heat release rate, double nnlterial toxicity and half ignition delay time. The results of the analysis indicated that the heat release rate was the critical parameter in determining time to death, thus illustrating the importance of heat release. In their paper, a comparison of CO yield and Peak Heat release Rate (PHR) against the time to reach untenable conditions in a bum room, indicated that PHR values were more representative of fue conditions than CO production.
In their paper[9], Babrauskas and Peacock compared the full-scale PHR values with cone calorimeter results. They determined that the full-scale PHR values correspond well to cone calorimeter test results. The authors compared toxicity and heat release values in full-scale but did not examine smoke data.
Sundstrom[lO] examined full-scale fire test results involving upholstered furniture in a fumiture calorimeter. The test procedure used by Sundstrom was not a typical room bum
environment, but one without resmctions on air entry and enclosing walls and ceiling. An item of furniture was placed below a large fume hood and ignited with a wood crib. SundsGom examined the following three criteria to calculate fire hazard: fire spread, visibility for escape and toxicity due to production of carbon monoxide. A CO value of 1500ppm is considred to be-immediately- dangerous to life and health[ll], and a smoke value of 3 obscura is assumed to be the minimum visibility requirement for an illuminated exit sign located 8 m away[l2]. Sundstrom used these two criteria as a means of establishing critical test conditions. Sundstrom's results showed that, for all of the materials tested, the most critical parameter was visibility. Sundstrom did not address heat release in his analysis.
Babrauskas[l3] published cone calorimeter results obtained in North America and
suggested the use of PHR and THR, obtained during a 600
s
test period at 75 kWIm2, as a means to evaluate materials. He did not, however, develop a c l a s ~ ~ c a t i o n method. A suggestedclassification system developed by Richardson and Brooks is included in the paper and is explained in Ref. 14. Their classification system included Babrauskas's suggestions, but uses a test duration of 900 s. Although Babrauskas suggested the use of cone results as a guide-line for classification, there was no comparison with full-scale fire test results.
Wickstrom and Goransson[l5] proposed a model to approximate the burning rate in a full- scale test by using cone calorimeter test results. This model was a modification of theories
presented in their previous paper[l6]. The three major assumptions they made to calculate heat release rate in a full-scale test are:
1. The growth rate of the burning area and the heat release rate are considered separately. 2. The growth rate of the burning area is proportional to the ease of ignition, i.e., the inverse of
time to ignition in small scale.
3 . The history of the heat release rate per unit area at each location on a large scale sample is the
same as one on a small scale sample.
Their theory is based on burning areas in the full-scale test The area involved in the fire at any time (A@)) is approximated by an equation involving the ignition time in the cone (tig). In their paper[l6], there was no allowance for the ignition flame increase at ten minutes in the room test, however, in their more recent paper[l5], this is accounted for by a separate equation of A(t) fort >
10 minutes. The burning area A(t) is then used to evaluate the
HRR
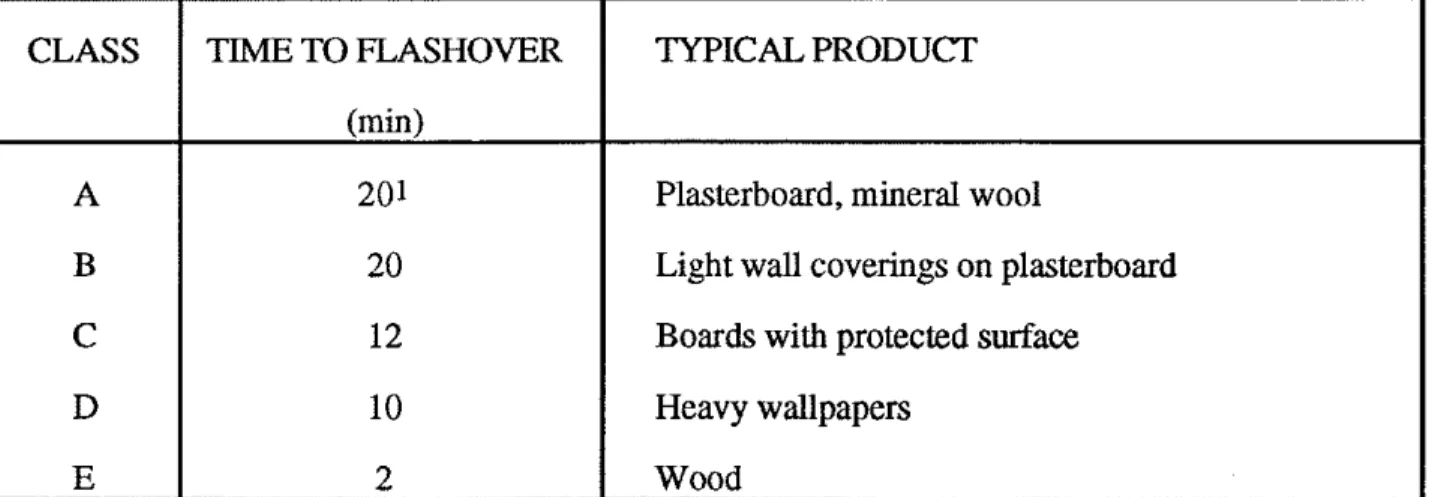
in the full-scale test The heat release rate in full-scale is equal to a duhamel integral involving the heat release rate in the cone calorimeter and A(t). Table 1 illustrates a classification system proposed by Wickstromand Goransson based on flashover time in the full-scale test. Since flashover is considered to correspond to a heat release rate of 1000 kW, the time to flashover was approximated by evaluating
Qfd-scale and determining when the heat release rate reached 1000 kW. This classification system
was based on a model using cone calorimeter results. This analysis contains valuable information and shows that there appears to be a direct relationship between the cone results and the full-scale test results. Smoke obscuration results were not addressed, however, in Ref. 15.
An empirical relationship, developed by Ostman and Nussbaum[l7], involves heat release, ignition time from the cone calorimeter tests and material density
as
a basis of approximating time to flashover in full-scale tests. The relationship is applicable to lining materials that are at least 12 mm thick Ostman and Nussbaum mention that there may be some modification required for materials that are 6 mm thick, which was also shown by Kim and Onno[18]. Ostman andNussbaum's analysis was based on the I S 0 room test[l9] which does not adjust the output of the ignition burner level until ten minutes have passed. An investigation into using the ASTM room bum test results in an empirical relationship similar to that of Ostman and Nussbaum showed that correlation was not as good as was the case using the I S 0 room test results (Ref. 18). The Ostman and Nussbaum equation is, however, a valuable tool to approximate flashover time. Since
flashover time is a critical variable in the room test, the equation provides a method of evaluating fire hazards for materials using cone data only.
Sundstrom and Goransson[20] have proposed a classification system based upon full-scale results. Twenty-nine materials, comprised of many lining materials and some composites, were used in the development of this proposal. The classification of materials was based on time to reach a specified Peak Heat Release rate, Peak Smoke Production rate and Average Smoke Production rate. The ranking was based on a five-level classification system. The use of both smoke and heat release rate limits provides a broader method of evaluation and may be a good starting point for a classification system based on both the cone and room bum tests.
Ostman and Tsantaridis[21] examined the relationship of smoke data recorded in the cone calorimeter and room bum tests. The data are those presented in their previous paper[l7]. They discuss the different forms of smoke data, including smoke production rate (ob x m31s) and smoke
potential (ob x m3/g), as well as specific extinction area (m21g). The smoke production rate is the
product of obscura and the exhaust duct volumetric flow rate. Smoke potential is the quotient of the smoke production rate divided by the mass loss rate. The specific extinction area is the light obscuration per unit path length and the exhaust duct flow rate, divided by the mass loss rate (i.e., smoke production rate per unit path length per unit mass loss rate). They observed that smoke data was more repeatable for materials that exhibit higher smoke production rates in the cone test
Smoke production rates seemed to follow heat release rates and varied with the heat flux levels used in the cone test. When it was expressed in smoke potential, however, the results were similar for the different heat flux levels. This is understandable, because with a higher heat flux, the material burning rate will be higher, resulting in higher heat release and smoke production rates. When the smoke production rate is represented by per unit mass of the burning sample (i.e. smoke potential), the results would be less affected by the heat flux levels. Ostman and Tsantaridis suggest that smoke extinction area is probably a more realistic parameter for comparing the smoke production in the cone calorimeter and room bum tests, as other papers have claimed[22]. Since mass loss rate is not determined in the full-scale room test, a means of interpreting full-scale results is required for comparison with the cone calorimeter data. Ostman and Tsantaridis used the
effective heat of combustion in the cone to convert the room smoke data to the cone units (ob m2/g) and illustrated comparisons between full-scale and small-scale results. The most promising one was the ratio of smoke production rate to heat release. A comparison of small-scale
and
full-scale smoke production ratios showed larger values for the small scale test. Although there was some consistency in this comparison, the results were not complete. Ostman and Tsantaridis alsocommented that, although for most materials smoke production is proportional to the heat release rate. some materials showed significantly larger values for smoke ~roduction
-
- -
when compared to the heat release rate.To summarize the literature review, it was noted that many researchers consider heat release rate as the most important parameter for assessing the fire hazard of materials and, until recently, more emphasis was placed on heat release rate than on smoke production rate. A number of papers have attempted to find a relationship between small-scale and full-scale test results, however, no reliable predictions of full-scale behaviour from small-scale test results have yet been found. Several researchers in Sweden have tried, with some success, to correlate small-scale test results with full-scale results for heat release and smoke production rates. Their main objective was to classify materials for their fire hazard based on small-scale test results. That work is not yet
complete and needs further validation. All of that work, however, is based on full-scale test results according to the I S 0 test method. In Canada, full-scale test results, based on the ASTM test method, are more readily accepted. There are substantial differences between the two full-scale test methods and there has been no attempt, as yet, to correlate small-scale test results with full-scale test results according to the ASTM test method.
TEST METHODS AND MATERIALS
Thirteen lining materials (see Table 2) were evaluated using three small-scale standard test methods; the International Maritime Organization W O ) test method[23] using the Robertson apparatus (radiant panel), the ASTM E906 test method[24] using the Ohio State University
Calorimeter (OSU), and the ASTM El354 test method[25] using the Cone Calorimeter. The same thirteen lining materials were also evaluated in full-scale room bum tests[26]. The thicknesses of these materials and an indication of which tests were conducted on these materials are listed in Table 2.
TEST RESULTS
The detailed results of the IMO tests were presented in a previous report[27]. For the OSU tests, the materials were tested vertically, at heat fluxes of 30 kW/mz and 50 kWIm2. Summaries of these OSU test results were also presented in previous reports[18,27].
A complete summary of results of the room bum tests is shown in Table 3. The most important parameter in the room bum test is considered to be the time to reach flashover, Tflash,
which is shown in Table 3. To assess repeatability on flashover times, some materials were tested twice over a two year period. Particleboard and chipboard reached flashover at approximately the same time in the second test as in the first Plywood, in both thicknesses, showed considerably longer flashover times in the second test. This could have been due to the fact that the samples wen: from a different batch and then: may have been some differences in matcrial composition. Chipboard was the only material which flashed over with a 40
kW
ignition source. Other materials flashed over only aftefthe increase in the ignition fire to 160kW. -An examination of the peak heat release (PHR) values in the full-scale tests indicates that materials that did not flashover can be separated from those that did - based on PHR values. There was no direct correlation, however, between PHR and the time to flashover. All materials that flashed over had a PHR value larger than 1000 kW, while materials having PHR's less than 500 kW did not reach flashover. This is reasonable because a value of 1000 kW is considered to correspond to flashover conditions in a room of this size.
The average heat release rate (HRR) was also examined. Materials having average
HRR
values less than 200 kW did not flashover. Materials having average values above 200 kW, with the exception of 12 mm thick plywood, flashed over. Generally, materials with average HRR values higher than 400 kW flashed over faster, but there was no direct correlation between the average HRR and flashover times.
An examination of average heat release rates during the initial five minutes (HRR-5m) shows that non-flashover materials had HRR-5m values less than 50 kW
.
Three materials did not fit into this generalization: polystyrene and 3 mm thick woodpanel had values greater than 50 kW hut did not reach flashover, while polyurethane had a value less than 50 kW hut reached flashover. Values greater than 100 kW generally corresponded to faster flashover times.Since the test duration was different depending on whether the material reached flashover or not, the total heat released (THR) value during the test is of little value. However, when total heat released during the first five minutes (THR-5m) was considered, there was a pattern
separating flashover and non-flashover materials. Non-flashover materials, with the exception of polystyrene and 3 mm thick woodpanel, had THR-5m values less than 15 MJ. Those that flashed over had THR-5m values higher than 15 MJ.
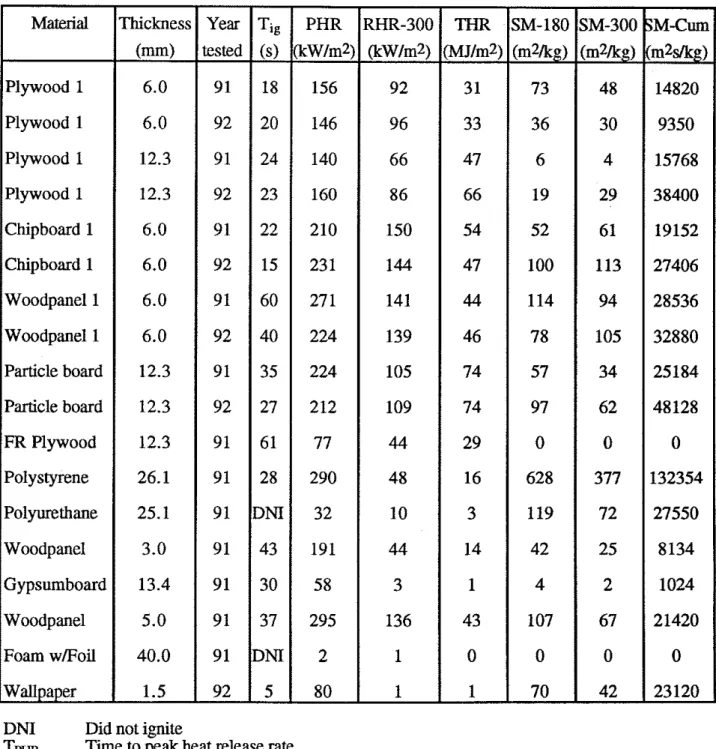
In the cone calorimeter tests, materials were tested only in the horizontal position, at flux levels of 25 and 50 kWlm2. A summary of the results of these tests is shown in Tables 4 and 5. Repeat tests were conducted for some materials in the second year to assess the repeatability of the cone
test
Comparing the results indicated that repeatability for ignition time and heat release was excellent, while smoke data was not repeatable.A comparison of the cone test results with 25 and 50 kWIm2 radiant flux indicates that, for PHR, the test results with 50 kWIm2 show much larger values than the results with 25 kWlm2, as was expected. With higher thermal radiation, m a t e d s will burn much faster with higher heat release rates. For Total Heat Released
(THR),
FR plywood showed much higher values at 50 kWIm2 than at 25 kWIm2. Other materials, such as plywood and particleboard, showed almost the same results for both 25 kWIm2 and 50 kWIm2 since,for highly combustible materials, 25 kWlmz is sufficient to sustain burning. For f i e retarded materials, 25 kWIm2 radiant flux is not sufficient to complete the combustion of the sample material and thus, when exposed to a higher heat flux level, more pyrolysis occurs, resulting in a higher heat release.As in the room burn test, the test duration of the cone calorimeter test is not fured but depends on the burning characteristics of the sample. Therefore, average values of the test results over the test duration are not always representative of the material behaviour. Instead, average values over the initial 60
s,
180s,
and 300s
following ignition of the sampleare
more meaningful and are thus used as a basis of comparison.Babrauskas and Krasny[9] suggested that a 180 s HRR average value from the cone test may correspond to the PHR of the room burn test, however, the NFL's results did not support that suggestion. The NFL's results show that the 300 s HRR average values represent a better
comparison of cone results with room burn test results, as shown in Tables 4 and 5. Based on the 300 s HRR average results from the cone test, materials can be grouped into flashover and non- flashover materials. Polyurethane was the only material that did not fit into this grouping.
COMPARISON O F TEST RESULTS Small-scale Test results
The IMO and OSU results are not easy to compare because of the differences in the test configurations. The IMO test method is used primarily to measure the flame spread rating of materials, which is useful as an input to compartment fire models. The test method also measures heat release rates, however, this method does not work as well as other small-scale test methods in producing heat release rate data Because of the varying level of thermal radiation exposure, the quantity of material that burns during a test is different for different materials.
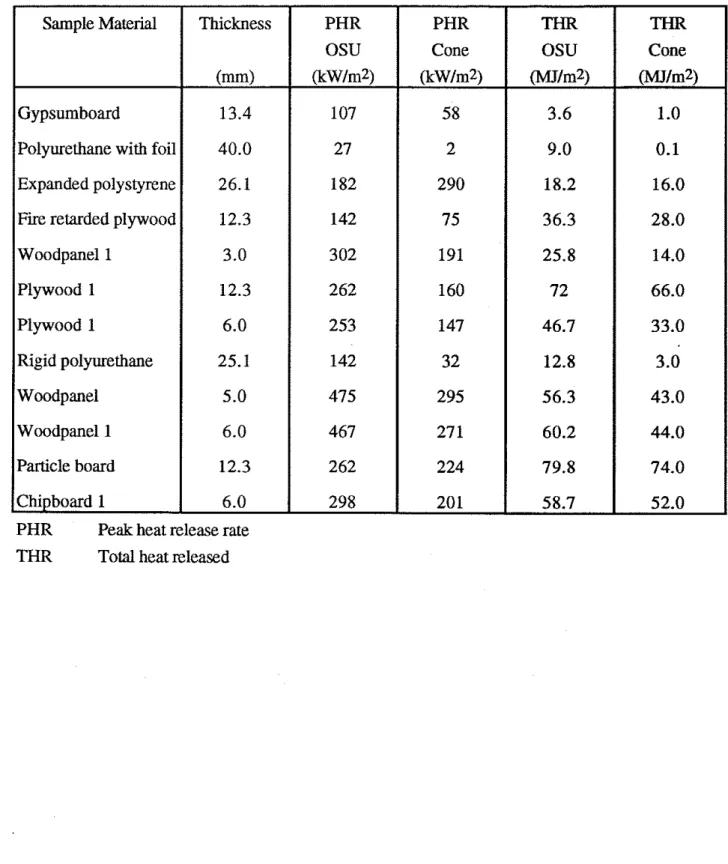
The OSU and cone calorimeter tests have similar features; the test samples are small and both are exposed to uniform radiant heat Test results from the OSU and cone calorimeter tests were compared to determine whether the PHR and THR values obtained in these two test methods were similar. Table 6 shows the results of OSU tests and cone calorimeter tests with a 50 kWIm2 exposure.
Since the sample size was different, the heat release data were converted to a per unit sample area. With the exception of polystyrene, the cone calorimeter results were much lower than the OSU results for PHR. For THR, the OSU results were stiU higher, but they were much closer than for PHR. There are several significant differences between the OSU and the cone that may account for this difference. The OSU test bums a sample in an enclosure, therefore, thermal feedback from the surrounding enclosure to the buming sample may increase the rate of burning. Also, in the OSU test, air is forced through the enclosure which may increase the bnrning rate of the sample. Another difference is that, in the OSU test, samples were tested in the vertical
orientation, whereas, in the cone test, the samples were tested horizontally. In the cone test, spark ignition was used, whereas in the OSU test, a pilot flame, located at the top of the sample, was used for ignition and was left ignited during the test - which may have enhanced the burning of the volatile gases not burned in the flame zone. The high PHR value for polystyrene in the cone test may be due to the test orientation. In the OSU test, the polystyrene melted, slipped to the bottom of the holder and did not receive direct heat exposure. This resulted in a lower heat release rate in the OSU.
Full-scale test results
As previously discussed[l8], one of the empirical equations comparing the cone test results with full-scale results was proposed by Ostman and Nussbaum[l7]. That relationship used the results of the cone test to predict flashover times in the full-scale I S 0 room bum tests. It was applied to the NFL's results and, as expected, there was no correlation between the NFL's cone results and the full-scale ASTM room bum test results. This is because the ASTM room bum test has a different ignition scenario from the I S 0 room bum
test
A modified empirical correlation was used to predict the ASTM full-scale room burn test flashover times using the cone results, however, the correlation was not as goodas
that produced by Ostman and Nussbaum[l7]. A detailed discussion appears in Ref. 18.The ASTM test method uses a 40 kW ignition fire for 5 minutes and then increased to 160 kW to simulate a waste basket fue spreading to other combustible materials in 5 minutes. This ignition scenario, however, does not produce consistant test results for most materials since the 40 kW fire is too small to cause flashover in many cases. The 160 kW fire, after the first 5 minutes, tends to precipitate flashover almost immediately. The separation of flashover times was, thus, very small, giving little information on assessing the level of hazard of each material. The I S 0 test
method provides a stable, medium level heat output of 100
k W
which seems to produce a gradual fire growth and a good distribution of flashover times.After examining cone test and ASTM room burn test results, it was determined that the
most
representative methodof
comparing the two sets of test results was to group the materials according to fire hazard level based on flashover time in the room bum test and the average Heat Release Rate after the initial 300 s (300s
HRR) in the cone test. The results are shown in Table 7.In general, this grouping encompasses most of the materials tested. The plywood materials have slightlv different results from one test to another. however. this grou~ing
.
u still relates the cone test and-fulllscale results correctly. The only exception tothis
was polyurethane.Polyurethane had a very low value in the cone calorimeter placing it in the Level 4 category, while the flashover time for the full-scale tests would have placed it in the Level 2 category. This is probably due to its different potential for ignition under high and low heat fluxes.
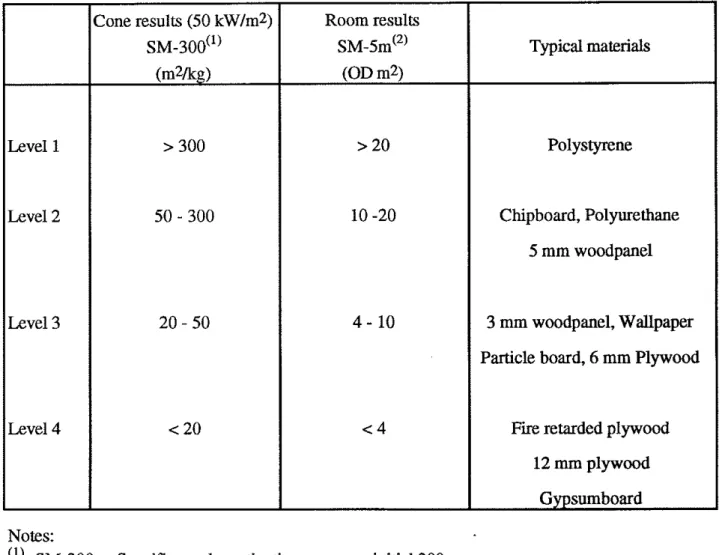
Smoke Data
As discussed previously, the smoke data obtained in the cone and room bum tests have
often been overlooked. Smoke data, obtained in the cone tests, were compared with the results obtained in the room bum tests. Smoke results from the room tests
are
more difficult to interpret than heat release, because there is no distinct condition such as flashover time. The cumulative smoke production and average smoke production rates over the test duration in the room test may not be reasonable data to compare because the test duration and the ignition flamesix
may be different for each material, depending on flashover time.The visibility in the room is directly proportional to the cumulative smoke production, therefore, cumulative smoke production over a fixed time period, such
as
the initial five minutes in the room test (SM-Sm), may be a reasonable parameter to consider. When the (SM-5m) was compared with the smoke data from the cone calorimeter tests, no correlation could be established It was possible, however, to establish some grouping of the materials when (SM-5m) and the 5 min average smoke extinction area in the cone test with a 50 kWIm2 exposure were compared. The results are shown in Table 8. Polystyrene produced considerable smoke in both the room test and the cone test. Materials, such as fm retarded plywood and gypsumboard, produced little smoke in the room test and this is reflected in the cone test results. There were two materials which did not fit intothis
grouping: 6 mm thick woodpanel showed a high smoke rate in the cone test, however,in the room test. it ~roduced a relativelv low smoke oroduction rate. Polvurethane foam with foil cover showed the dpposite behaviour. -1t showed nd smoke in the cone &st, but produced some smoke in the room test. It was also noted that smoke results were generally less repeatable during the cone tests when compared to heat release data. For some materials, considerable differences were found in repeat tests, typically over 20%.
Thii
may reflect the lack of a more directcomparison between the cone and room test results.
SUMMARY
Recent publications on the development of a means of classifying materials based on full- scale and small-scale test results have been reviewed, and an attempt has been made to correlate small-scale and full-scale test results. A careful examination of cone calorimeter and room bum test results has been presented. Results from the OSU test were compared with the cone calorimeter test results to evaluate the two small-scale test methods. Heat release data from the OSU tests were always higher than the results of cone calorimeter tests. The OSU test has
previously been used in fue research, however, the cone calorimeter test is gaining acceptance
as
a standard small-scale test A fm understanding of the differences between the results of the two tests could be quite useful in the future.A comparison of small-scale and full-scale test results showed that there is no direct correlation between the two results. An empirical correlation which predicts the ASTM full-scale room bum test flashover times using cone results was developed previously[l8]. It could predict whether a material will flash over or not, however, the correlation between predicted flashover times and measured flashover times for combustible materials was not good and it was not
acceptable as a classification tool for all materials. Two new classification systems based on cone test results are proposed. The systems, which group the materials based on the heat release data and smoke data from the cone tests, represent the ASTM full-scale test results well.
AU
materialstested in this project, except polyurethane and foam with foil cover, fit into the two classif~ation systems for heat release and smoke production rates.
ACKNOWLEDGEMENTS
The authors appreciate the assistance of Bruce Taber and Don Carpenter at the National
Fire
Laboratory in conducting full-scale room fue tests. REFERENCES
1.. Tran, H. C., "Rate of Heat and Smoke Release of Wood in an Ohio State University Calorimeter", Fire and Materials, Vol. 12, NO. 4, 1988, pp. 143-151.
2.. Tsuchiya, Y., "The OSU Heat Release Rate Test using the Oxygen Consumption Principle", Proceedings of International Conference for the Promotion of Advanced
Fire
Resistant Aircraft Materials, Atlantic City, N.J., Feb. 9-11, 1993.3. Janssens, M.L., "Measuring Rate of Heat Release by Oxygen Consumption", Fire Technology, Vol. 27, No. 3, August 1991, pp 234-249.
4. Peacock, R. D. and Babrauskas, V., "Analysis of Large-scale Fire Test Data", Fire Safety Journal, Vol. 17, No. 5, 1991, pp. 387-414.
5 Huggett, C., "Estimation of Rate of Heat Release by Means of Oxygen Consumption Measurements", Fire and Materials, Vol. 4, No. 2, 1980, pp. 61-65.
6 Parker, W. J., "Calculation of the Heat Release Rate by Means of Oxygen Consumption for Various Applications", Journal of F i e Science, Vol. 2, 1984, pp. 380-395,
7 Fisher, F. L. and Williamson, R. B., "Intralaboratory Evaluation of a Room Fire Test Method", U.S. National Bureau of Standards, GCR, 1983, pp. 83-421.
8 Babrauskas, V. and Peacock, R.D., "Heat Release Rate: The Single Most Important Variable in Fire Hazard, Proceedings of Fire Safety Developments and Testing: Toxicity, Heat Release, Product Development, Combustion Corrosivity,
Fie
Retardant Chemicals Association, Fall 1990 meeting, FRCA, Lancaster, PA 1990, pp. 67-80.9 Babrauskas, V., and Krasny, I. F., "Fire Behaviour of Upholstered Furniture", (NBS Monograph 173) National Bureau of Standards, Gaithersburg, MD, 1985.
10 Sundstrom, B., "Full-Scale Fire Testing of Upholstered Furniture and the Use of Test Data", Proceedings of New Technology to Reduce F i Losses and Costs Conference, Luxembourg,
1986. nn. - - . I , - - 147-1 - - - - 54. -
I I ~ ~ O S H / O S H A , "Occupational Hcalth Guidelines for Chcmical Hazards", U.S. Department of Hcalth and Human Services, U.S. Departmcnt of Labour, DDHHS (NIOSH), Publication NO. 81-123, 1981.
12 Jim, T. and Yamada, T., "Irritating Effects of F i Smoke on Visibility", Fire Science and Technology, Vol. 5, No. 1, 1985.
13 Babrauskas, V., "North American Experiences in the Use of Cone Calorimeter Data for Classification of Products", Proceedings of the International EUREFIC Seminar, Interscience Communications Ltd., London, 1991, pp. 89-103.
14 Richardson, L. R. and Brooks, M. E., "Combustibility of Building Materials", Fire and Materials, Vol. 15, No. 3, 1991, pp. 131-136.
15 Wickstrom, U. and Goransson, U., "Full-scaleIBench-scale Correlations of Wall and Ceiling Linings", Fire and Materials, Vol. 16, No. 1, 1992, pp. 15-22.
16 Wickstrom, U. and Goransson, U., "Prediction of Heat Release Rates of Surface Materials in Large-Scale Fire Tests Based upon Cone Calorimeter Results", Journal of Testing and
Evaluation, JTEVA, Vol. 15, No. 6, November 1987, pp. 364-370.
17 Ostman, B. A.-L and Nussbaum, R.M., "Correlation between Small-Scale Rate of heat Release and Full-Scale Room Flashover for Surface Linings", Proceedings of the Second International Symposium on Fire Safety Science, Hemisphere Publishing Corp., 1988, pp. 823-832.
18 Kim, A. and Onno, R., "Evaluating the F i e Hazard of Lining Materials Using the OSU, Cone Calorimeter and Full-Scale F i e Test Methods", IRC Internal Report No. 625, March
1992.
19 "Room Fire Test in Full-Scale for Surface Products", D O C . I S O ~ C ~ U S C ~ / W G ~ / N ~ O , 1986. 20 Sundstrom, B. and Goransson, U., "Possible Fire Classification Criteria and their
implications for Surface Materials tested in Full Scale According to I S 0 DP 9705 or
NT
Fire 025", Swedish National Testing Institute, Fire Technology SP Report 19,1988.21 Ostman, B. A.-L. and Tsantaridis, L. D., "Smoke Production in the Cone Calorimeter and the Room Fire Test", Fire Safety Journal, Vol. 17, No. 1, 1991, pp 27-43.
22 Babrauskas, V. and Mulholland, G., "Smoke and Soot Data Determinations in the Cone Calorimeter", Mathematical Modelling of Fires, ASTM STP 983, American Society for Testing and Materials, Philadelphia, 1987, pp. 83-104.
23 "Revised Recommendation on Fire Test Procedures for Surface Flammability of Bulkhead and Deck Finish Materials", Resolution A.564(14), International Maritime Organization, London, January 16, 1986.
24 "Standard Test Method for Heat and Visible Smoke Release Rates for Materials and Products" (ASTM-E-906), American Society for Testing and Materials, Philadelphia, 1983.
25 "Standard Test Method for Heat and Visible Smoke Release Rates for Materials and Products using an Oxygen Consumption Calorimeter" (ASTM E-1354). American Society for Testing and Materials, Philadelphia, 1990.
26 "Proposed Method for Room Fire Test of Wall and Ceiling Materials and Assemblies", Annual Book of ASTM Standards, Part 18,1982, pp. 1618-1638.
27 Kim, A. and Dyck, T., "Full-Scale and Small-Scale Tests of Room Lining Materials", IRC Internal Report No. 606, March 1991.
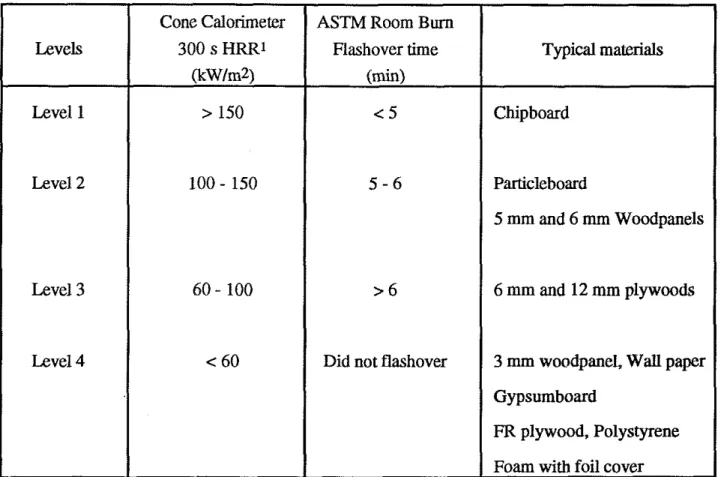
Table 1. A proposed classification system based on time to reach 1000 kW (flashover) in the RoomICorner Test (Ref. 14)
Note: 1 Heat release rate of the ignition flame was increased to 600 kW. CLASS A B C D E TIME TO FLASHOVER 201 20 12 10 2 TYPICAL PRODUCT
Plasterboard, mineral wool
Light wall coverings on plasterboard Boards with protected
surface
Heavy wallpapers Wood
11
Table 2. Description of test materials
Sample Material
Plywood 1 Plywood 1
Fire retarded plywood Woodpanel 1 Expanded polystyrene Rigid polyurethane Chipboard 1 Gypsumboard Plywood 2 Plywood 2 Woodpanel 2 Woodpanel Woodpanel 1 Chipboard 2 Particle board
Foam with foil cover Woodpanel 2
Wallpaper over Gypsumboard
Thickness (mm) 6.0 12.3 12.3 3.0 26.1 25.1 6.0 13.4 6.0 12.3 3.0 5.0 6.0 6.0 12.3 40.0 6.0 1.5
IMO
x x x x x x x OSU x xx
xx
xx
x
x
x
x x xx
xx
x
Conex
x
xx
xx
x
x
x
x
Roomx
x
xx
xx
x
x
x
x
xx
xx
xx
Table 3A. Room burn test results (heat release results)**
PHR Peak heat release rate THR Total heat released
Av-HRR Average heat release rate over test duration HRR-5m Average heat release rate during initial 5
min
THR-5m Total heat released during initial 5 min DNF Did not flashover
13
Table 3B. Room bum test results (smoke results)
Tflash T i e to reach flashover PSR Peak smoke value
Av-SM Average smoke value over test duration SM-Cum Cumulative smoke production for test duration Av-5m Average smoke value for initial 5 min
SM-5m Cumulative smoke production for initial 5 min DNF Did not flashover
Material Gypsumboard Chipboard 1 Woodpanel 1 Plywood 1 Plywood 1 FR Plywood Polystyrene Polyurethane Plywood 1 FR Plywood Polystyrene Woodpanel 1 Particleboard Plywood 2 Plywood 2 Foam w/Foil Chipboard 2 Particle board Woodpanel Wallpaper - Thicknesz (mm) 13.4 6.0 3.0 6.0 12.3 12.3 26.1 25.1 12.3 12.3 26.1 6.0 12.3 6.0 12.3 40.0 6.0 12.3 5.0 1.5 Date tested 90-5-10 90-6-12 90-6-18 90-6-21 90-7-4 90-7-9 90-7-12 90-7-17 90-7-20 90-7-26 90-7-31 90-11-1 91-2-22 91-3-25 91-4-8 91-4-30 91-5-7 91-5-13 91-5-16 92-5-12 TE,,~ (s) DNF 240 DNF 355 360 DNF DNF 325 427 DNF DNF 362 360 540 550 DNF 275 355 330 DNF PSR (OD) 0.02 0.408 0.044 0.097 0.768 0.028 0.146 0.521 0.064 0.036 0.331 0.357 0.255 0.185 0.108 0.110 0.258 0.359 0.344 0.067 Av-SM (OD) 0.01 0.059 0.024 0.017 0.046 0.013 0.045 0.086 0.016 0.019 0.058 0.051 0.047 0.028 0.021 0.020 0.030 0.043 0.054 0.03 SM-Cum (ODm3) 9.0 14.5 20.3 7.4 8.7 10.9 40.9 38.9 6.0 22.3 53.0 20.1 13.7 26.8 21.8 38.1 13.0 23.5 36.6 16.0 Av-5m (OD) 0.012 0.059 0.032 0.013 0.017 0.006 0.026 0.036 0.016 0.017 0.037 0.031 0.037 0.011 0.011 0.036 0.069 0.011 0.029 0.0 13 SM-5m (ODm3) 3.0 14.5 6.1 1.7 2.6 1.3 16.9 11.9 2.7 3.0 25.6 3.8 3.1 4.5 3.7 4.2 13.0 5.5 12.0 4.0
14
Table 4. Cone calorimeter test results with flux of 25 kWIm2
DNI Did not ignite
TPHR Time to peak heat release rate
Ti T i e to ignition
R h - 3 0 0 Average heat release rate over initial 300
s
SM-180 Specific smoke extinction area over initial 180 s SM-300 Specific smoke extinction area over initial 300
s
SM-Cum Cumulative smoke extinction area over test duration
SM-Cum {mzs/kg) 6590 7563 1005 2074 9333 19618 16380 23876 13299 32704 0 151810 886 3894 4200 13152 0 15700
-
Material Plywood 1 Plywood 1 Plywood 1 Plywood 1 Chipboard 1 Chipboard 1 Woodpanel 1 Woodpanel 1 Particle board Particle board FR Plywood Polystyrene Polyurethane Woodpanel Gypsumboard Woodpanel Foam w/Foil Wallpaper Tig (s) 144 122 205 128 139 88 248 175 130 110 745 124 DNI 121 DNI 277 DNI 10 RHR-300 (kWJm2) 81 83 44 58 120 104 120 102 78 81 32 55 3 375
114 1 3 SM-180 (m2kg) 35 30 4 3 23 35 84 53 23 53 0 745 5 21 21 64 0 59 PHR (kWlm2) 137 122 100 128 145 140 181 129 143 141 43 219 6.5 167 16 181 7.4 86THR
(MJIrn2) 27 32 5 1 61 48 42 39 39 74 73 10 17 2.4 12 2 37 1 1 Thickness (mm) 6.0 6.0 12.3 12.3 6.0 6.0 6.0 6.0 12.3 12.3 12.3 26.1 25.1 3.0 13.4 5.0 40.0 1.5 SM-300 (m2kg) 21 26 3 2 30 53 54 69 14 34 0 447 3 13 14 43 0 36 Year tested 91 92 91 92 91 92 91 92 91 92 91 91 91 91 91 91 91 92Table 5. Cone calorimeter test results with flux of 50 kWIm2
DNI Did not ignite
TPHR Time to peak heat release rate
Material Plywood 1 Plywood 1 Plywood 1 Plywood 1 Chipboard 1 Chipboard 1 Woodpanel 1 Woodpanel 1 Particle board Particle board
FR
Plywood Polystyrene Polyurethane Woodpanel Gypsumboard Woodpanel Foam w/Foil Wallpaper Ti T i e to ignitionR ~ R ~ O O Average heat release rate over initial 300 s SM-180 Specific smoke extinction area over initial 180 s SM-300 Specific smoke extinction area over initial 300 s SM-Cum ~bmulative smoke extinction area over test duration
Thickness (mm) 6.0 6.0 12.3 12.3 6.0 6.0 6.0 6.0 12.3 12.3 12.3 26.1 25.1 3.0 13.4 5.0 40.0 1.5 Year tested 91 92 91 92 91 92 91 92 91 92 91 91 91 91 91 91 91 92 T,g (s) 18 20 24 23 22 15 60 40 35 27 61 28 DNI 43 30 37 DNI 5 PHR (kW/m2) 156 146 140 160 210 231 271 224 224 212 77 290 32 191 58 295 2 80 RHR-300 (kWIm2) 92 96 66 86 150 144 141 139 105 109 44 48 10 44 3 136 1 1 THR (MJlrn2) 3 1 33 47 66 54 47 44 46 74 74 29 16 3 14 1 43 0 1 SM-180 (m2kg) 73 36 6 19 52 100 114 78 57 97 0 628 119 42 4 107 0 70 SM-300 (m2kg) 48 30 4 29 61 113 94 105 34 62 0 377 72 25 2 67 0 42 - k ~ - ~ u m (m2dkg) 14820 9350 15768 38400 19152 27406 28536 32880 25184 48128 0 132354 27550 8134 1024 21420 0 23120
Table 6. Comparison of OSU and cone test results with flux of 50 kWIm2
PHR Peak heat release rate THR Total heat released
Sample Material
Gypsumboard
Polyurethane with foil Expanded polystyrene
Fi
retarded plywood Woodpanel 1 Plywood 1 Plywood 1 Rigid polyurethane Woodpanel Woodpanel 1 Particle board Chipboard 1 Thickness (mm) 13.4 40.0 26.1 12.3 3.0 12.3 6.0 25.1 5.0 6.0 12.3 6.0 PHR OSU m m 2 ) 107 27 182 142 302 262 253 142 475 467 262 298 PHR Cone (kw1m2) 58 2 290 75 191 160 147 32 295 27 1 224 20 1 THR OSU WImZ) 3.6 9.0 18.2 36.3 25.8 72 46.7 12.8 56.3 60.2 79.8 58.7 THR Cone (MJlm2) 1.0 0.1 16.0 28.0 14.0 66.0 33.0 3.0 43.0 44.0 74.0 52.0Table 7. Cone and Full-scale Test Results Comparison
Note: 1 Cone test results with flux of 50 kWIm2
-
Levels Level 1 Level 2 Level 3 Level 4.
Cone Calorimeter 300 s HRRl (kWtm2) > 150 100 - 150 60 - 100 < 60ASTM Room Burn Flashover time
(&)
c 5
5 - 6
> 6
Did not flashover
Typical mate&
Chipboard
Particleboard
5 mm and 6 mm Woodpanels
6 mm and 12 mm plywoods
3 mm woodpanel, Wall paper Gypsumboard
FR
plywood, Polystyrene Foam with foil cover18
TABLE 8. Comparison of smoke results from Cone and Room tests
Notes:
(') SM-300 Specific smoke extinction area over initial 300
s
(*) SM-5m Cumulative smoke production over initial 5 minTypical materials
Polystyrene
Chipboard, Polyurethane 5 mm woodpanel
3 mm woodpanel, Wallpaper
Particle board, 6 mm Plywood
Fire retarded plywood 12 mm plywood Gypsumboard Room results ~ ~ - 5 m " ) (OD m2) > 20 10 -20 4 - 10 < 4 Level 1 Level 2 Level 3 Level 4
Cone results (50 kWIm2) SM-300") (m2lkg) > 300 50 - 300 20 - 50 < 20