HAL Id: hal-01614654
https://hal.archives-ouvertes.fr/hal-01614654
Submitted on 11 Oct 2017
HAL is a multi-disciplinary open access
archive for the deposit and dissemination of
sci-entific research documents, whether they are
pub-lished or not. The documents may come from
teaching and research institutions in France or
abroad, or from public or private research centers.
L’archive ouverte pluridisciplinaire HAL, est
destinée au dépôt et à la diffusion de documents
scientifiques de niveau recherche, publiés ou non,
émanant des établissements d’enseignement et de
recherche français ou étrangers, des laboratoires
publics ou privés.
Adenomatous Polyposis Coli Defines Treg
Differentiation and Anti-inflammatory Function through
Microtubule-Mediated NFAT Localization
Sonia Agüera-Gonzalez, Oliver T. Burton, Elena Vázquez-Chávez, Céline
Cuche, Floriane Herit, Jérôme Bouchet, Rémi Lasserre, Iratxe del Río-Iñiguez,
Vincenzo Di Bartolo, Andres Alcover
To cite this version:
Sonia Agüera-Gonzalez, Oliver T. Burton, Elena Vázquez-Chávez, Céline Cuche, Floriane Herit, et al..
Adenomatous Polyposis Coli Defines Treg Differentiation and Anti-inflammatory Function through
Microtubule-Mediated NFAT Localization. Cell Reports, Elsevier Inc, 2017, 21 (1), pp.181-194.
�10.1016/j.celrep.2017.09.020�. �hal-01614654�
Article
Adenomatous Polyposis Coli Defines Treg
Differentiation and Anti-inflammatory Function
through Microtubule-Mediated NFAT Localization
Graphical Abstract
Highlights
d APC controls microtubule organization and NFAT-driven cytokine gene expression
d APC silencing impairs NFAT nuclear localization and activation
d NFAT associates with microtubules that control its localization and its activation
d ApcMin/+Tregs have intrinsically reduced differentiation and IL-10 production
Authors
Sonia Ag€uera-Gonza´lez, Oliver T. Burton, Elena Va´zquez-Cha´vez, ...,
Iratxe del Rı´o-In˜iguez,
Vincenzo Di Bartolo, Andre´s Alcover
Correspondence
sonia.aguera-gonzales@curie.fr (S.A.-G.), andres.alcover@pasteur.fr (A.A.)
In Brief
Ag€uera-Gonza´lez et al. investigate the role of the polarity regulator and tumor suppressor Adenomatous polyposis coli (APC) in CD4 T cell activation and effector function. APC controls microtubule reorganization, NFAT transcription factor localization, and cytokine gene
expression. In ApcMin/+mutant mice, regulatory T cell (Treg) differentiation and anti-inflammatory function were
intrinsically affected.
Ag€uera-Gonza´lez et al., 2017, Cell Reports 21, 181–194 October 3, 2017ª 2017 The Authors.
Cell Reports
Article
Adenomatous Polyposis Coli Defines Treg
Differentiation and Anti-inflammatory Function
through Microtubule-Mediated NFAT Localization
Sonia Ag€uera-Gonza´lez,1,2,3,5,9,*Oliver T. Burton,4,8Elena Va´zquez-Cha´vez,1,2,3Ce´line Cuche,1,2,3Floriane Herit,1,2,3,6
Je´r^ome Bouchet,1,2,3,6Re´mi Lasserre,1,2,3,7Iratxe del Rı´o-In˜iguez,1,2,3Vincenzo Di Bartolo,1,2,3and Andre´s Alcover1,2,3,*
1Institut Pasteur, Department of Immunology, Lymphocyte Cell Biology Unit 2CNRS URA1961
3INSERM U1221 75015 Paris, France
4Division of Immunology, Boston Children’s Hospital and Department of Pediatrics, Harvard Medical School, Boston, MA 02115, USA 5Present addresses: Institut Curie, Membrane and Cytoskeleton Dynamics Group, CNRS UMR144, 75005 Paris, France
6Present addresses: Institut Cochin, INSERM, U1016, CNRS, UMR8104, Universite´ Paris Descartes, Sorbonne Paris Cite´, 75014 Paris, France
7Present addresses: Centre d’Immunologie de Marseille-Luminy, Aix Marseille Universite´ UM2, Inserm, U1104, CNRS UMR7280, 13288 Marseille, France
8Present addresses: Department of Microbiology and Immunology, VIB, University of Leuven, 3000 Leuven, Belgium 9Lead Contact
*Correspondence:sonia.aguera-gonzales@curie.fr(S.A.-G.),andres.alcover@pasteur.fr(A.A.)
http://dx.doi.org/10.1016/j.celrep.2017.09.020
SUMMARY
Adenomatous polyposis coli (APC) is a polarity regulator and tumor suppressor associated with familial adenomatous polyposis and colorectal cancer development. Although extensively studied in epithelial transformation, the effect of APC on T lymphocyte activation remains poorly defined. We found that APC ensures T cell receptor-triggered activation through Nuclear Factor of Activated T cells (NFAT), since APC is necessary for NFAT’s nuclear localization in a microtubule-dependent fashion and for NFAT-driven transcription leading to cytokine gene expression. Interestingly, NFAT forms clusters juxtaposed with microtubules. Ultimately, mouse Apc deficiency reduces the presence of NFAT in the nucleus of intestinal regulatory T cells (Tregs) and impairs Treg differentiation and the acquisition of a suppressive phenotype, which is characterized by the production of the anti-inflammatory cytokine IL-10. These findings suggest a dual role for APC tations in colorectal cancer development, where mu-tations drive the initiation of epithelial neoplasms and also reduce Treg-mediated suppression of the detri-mental inflammation that enhances cancer growth.
INTRODUCTION
T lymphocytes recognize peptide antigens associated with ma-jor histocompatibility complex molecules (MHCs) on antigen-presenting cells. Antigen recognition induces T cell polarization
toward the antigen-presenting cell. This forms an organized interface, the immunological synapse that regulates T cell activa-tion leading to T cell growth, differentiaactiva-tion and cytokine produc-tion. T cell receptor (TCR) and signaling molecules dynamically concentrate at the immunological synapse to optimally control T cell activation. This depends on the orchestrated action of the actin and microtubule cytoskeleton, and intracellular vesicle traffic (Ag€uera-Gonzalez et al., 2015; Soares et al., 2013).
Cell polarity is regulated by an array of evolutionary conserved polarity complexes crucial for stably polarized epithelial cells (Rodriguez-Boulan and Macara, 2014) or for induced polariza-tion in migrating cells (Elric and Etienne-Manneville, 2014). Scribble, Dlg1, and PKCz polarity regulators were shown to con-trol lymphocyte migration, immunological synapse formation, and T cell activation (Bertrand et al., 2010; Lasserre et al., 2010; Ludford-Menting et al., 2005; Real et al., 2007; Round et al., 2007; Xavier et al., 2004).
The polarity regulator and tumor suppressor adenomatous polyposis coli (APC) is known for its association with familial adenomatous polyposis (FAP), large numbers of sporadic hu-man colorectal tumors, and intestinal carcinomas in mice (McCartney and Na¨thke, 2008; Moser et al., 1990; Su et al., 1992; Zeineldin and Neufeld, 2013). APC contains several pro-tein-protein interaction domains (Figure 1A), permitting its involvement in various cellular processes including proliferation, differentiation, migration, and death. APC-interacting proteins include b-catenin, the polarity regulators Dlg1 or Scribble, cyto-skeleton regulators, nuclear pore and nuclear transport proteins, and apoptosis- or mitosis-related proteins (Etienne-Manneville, 2009; Nelson and Na¨thke, 2013).
The effect of APC mutations on intestinal epithelium differenti-ation and tumor progression has been widely investigated in colorectal cancer patients and in mouse models (Be´roud and Soussi, 1996; McCartney and Na¨thke, 2008; Moser et al.,
Figure 1. APC Is Expressed in T Cells and Controls Microtubule Network Organization upon TCR Stimulation
(A) Scheme of APC protein interaction motifs. (B) Expression of APC in primary human CD4+
T cells (CD4+
), Jurkat T cells, and colorectal carcinoma cell lines (HTC-116, DLD-1).
(C) Immunofluorescence of APC (red, arrowheads) and microtubules (green) at the immunological pseudo synapses (anti-CD3-coated coverslips 3 min). Scale bar, 3 mm.
1990; Nelson and Na¨thke, 2013; Su et al., 1992; Zeineldin and Neufeld, 2013). Altered intestinal immune homeostasis was found in Apc mutant mice, together with the impaired control of inflammation by regulatory T lymphocytes (Tregs) (Akeus et al., 2014; Chae and Bothwell, 2015; Gounaris et al., 2009). However, whether Apc defects in T cells contribute to this loss of anti-inflammatory functions remains only vaguely explored (Tanner et al., 2016). Our data unveil the requirement for APC in T cell receptor-dependent nuclear factor of activated T cells (NFAT) activation. APC permits NFAT nuclear localization in a microtubule-dependent fashion. Moreover, ApcMin/+mice display modestly reduced levels of NFAT expression and nuclear localization in intestinal regulatory T cells (Tregs). Heteroinsuffi-ciency of Apc leads to induced Treg (iTreg) populations with impaired capacity to differentiate and produce NFAT-regulated cytokines, particularly interleukin-10 (IL-10), which is essential to control intestinal inflammation and adenocarcinoma progres-sion (Rubtsov et al., 2008).
RESULTS
APC Regulates Microtubule Network Organization at the Immunological Synapse
We first investigated the expression of APC in human T cells. Jurkat cells and peripheral blood T cells express apparent full-length APC (311 kDa), as compared with HCT-116 and DLD-1 colon cancer cell lines that express full-length and truncated APC forms, respectively (Be´roud and Soussi, 1996) (Figure 1B). We then localized APC in T cells. As we have previously shown (Lasserre et al., 2010), T cells on stimulatory anti-CD3-coated coverslips (pseudo synapses) display radially organized microtu-bules, with the centrosome apposed to the contact site (Figures 1C–1E). Similar to other cell types (Etienne-Manneville et al., 2005; Na¨thke et al., 1996), APC appeared as discrete puncta apposed to microtubules (Figure 1C; Movie S1), frequently localized at the synapse periphery, likely corresponding to microtubule tips, as shown at the leading edge of migrating cells (Etienne-Manneville et al., 2005) (Figure 1C, right, arrowheads; Movie S1).
APC regulates microtubule stability and organization in polar-ized cells (Etienne-Manneville et al., 2005; Kroboth et al., 2007; Mogensen et al., 2002). We therefore investigated the role of APC in microtubule network organization at the immunological synapse. We assessed microtubule patterns at pseudo synap-ses of control and APC-silenced T cells. Control T cells mostly displayed radial microtubule patterns, whereas APC-silenced cells frequently displayed disorganized microtubule patterns in both Jurkat and primary T cells (Figures 1D and 1E). Moreover,
centrosome polarization to the immunological synapse was less efficient in APC-silenced cells, as assessed by the centro-some distance to the contact site (Figure 1F).
Tubulin acetylation correlates with microtubule stability and is controlled by APC (Kroboth et al., 2007). Consistently, APC-silenced T cells had lower levels of acetylated tubulin in unstimu-lated and CD3+CD28-stimuunstimu-lated cells (Figures 1G and 1H). Lower tubulin acetylation was also observed in DLD-1 epithelial carcinoma cells expressing truncated APC (Figure 1I) and in CD4+and Tregs from ApcMin/+heterozygous mutant mice (
Fig-ures S2B and S2H).
In sum, APC depletion results in impaired microtubule acetyla-tion, microtubule network organizaacetyla-tion, and centrosome polari-zation at the immunological synapse.
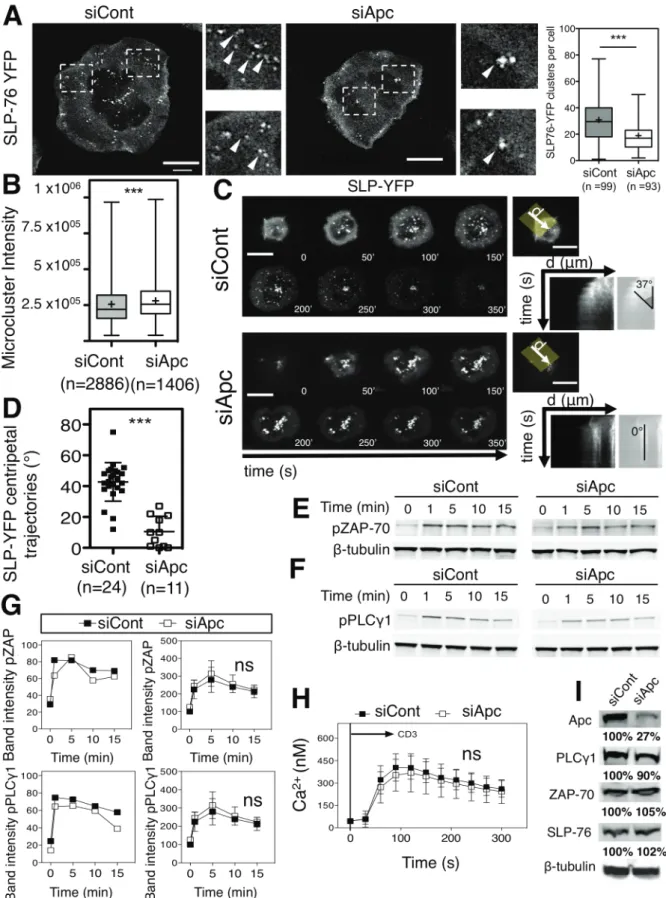
APC Silencing Alters Microcluster Patterns without Affecting Early TCR Signaling
Immunological synapses direct T cell activation through the actin- and microtubule-dependent spatial and temporal organi-zation of TCR signaling complexes (Bunnell et al., 2002; Campi et al., 2005; Lasserre et al., 2010; Yokosuka et al., 2005). APC silencing affected the generation and dynamics of signaling complexes at the immunological synapse, as monitored by the number, intensity, and trajectories of YFP-SLP76 microclusters (Figures S1A and S1B, arrowheads, andS1C and S1D). How-ever, APC-silenced cells did not have altered tyrosine phosphor-ylation of the proximal TCR signaling molecules ZAP70 and PLCg1, or calcium flux (Figures S1E–S1H;Movies S6andS7).
Therefore, APC is necessary for the generation and dynamics of signaling microcluster at the immunological synapse, without significantly affecting early signaling.
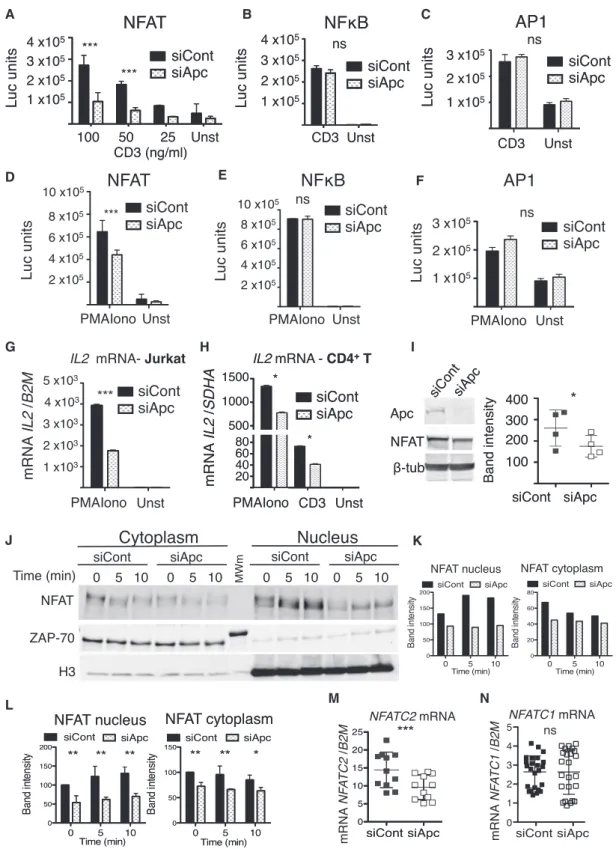
APC Regulates NFAT-Driven Gene Transcription
The transcription factors NFAT, nuclear factor kB (NF-kB), and AP1 (Fos and Jun) are crucial for antigen-triggered T cell growth, differentiation, and cytokine gene regulation. We investigated the effect of APC silencing on NFAT-, NF-kB-, and AP1-driven tran-scription using luciferase expression vectors. Despite normal TCR-induced phosphorylation and Ca2+ flux in APC-silenced
cells (Figures S1E–S1H), NFAT-driven luciferase expression was significantly lower (Figure 2A). In contrast, NF-kB- or AP1-driven luciferase was not affected (Figure 2B and 2C). Similar ef-fects were observed when T cells were stimulated with calcium ionophore (Iono) and phorbol myristate acetate (PMA) that acti-vate calcineurin and protein kinase C (PKC), respectively, by-passing TCR proximal signal events (Figures 2D–2F). Moreover, APC silencing decreased IL2 gene expression in Jurkat and pri-mary T cells, as assessed by qRT-PCR (Figures 2G and 2H).
(D and E) Microtubule network organization in siRNA control (siCont) or APC (siAPC) in Jurkat (D) and primary human CD4+T lymphocytes (E). Cells were ranked in two categories: pattern 1 (P1), presence of a radial plane of microtubules, or pattern 2 (P2), non-radial organization. APC expression was measured by western blot. Data are representative of three experiments (Jurkat) and two experiments for primary T cells (mean± SD, two-way ANOVA). Scale bar, 3 mm. (F) Centrosome position in siCont and siAPC Jurkat cells (distance of centrin spot to the coverslip). Data are representative of two experiments.
(G and H) Tubulin acetylation (Ac-Tub) in siCont and siAPC Jurkat cells activated with soluble anti-CD3+CD28 antibodies (Abs). Ac-Tub band was normalized to control b-tubulin and the percentage of siCont at time 0. Data are representative of three experiments (blot, G, and left graph, H). Mean± SD of three experiments (H, right graph).
(I) Ac-Tub staining in HCT-116 and DLD-1 cells. Data are from three experiments (whiskers: 5th–95th percentile; mean± SD; Mann-Whitney test). See alsoFigure S1.
A B C
D E F
G H I
J K
L M N
Figure 2. Effect of APC Silencing on NFAT Activation and IL2 Gene Transcription
(A–F) NFAT (A and D), NF-kB (B and E), and AP-1 (C and F)-dependent activation in siCont and siAPC Jurkat cells was measured using luciferase expression vectors. Cells were stimulated with anti-CD3+CD28 Abs (A–C) or PMA-Iono (D–F). Data are representative of six experiments for NFAT and AP1 (A, C, D, and F) and three experiments for NF-kB (B and E) (mean± SEM, two-way ANOVA).
(G–H) IL2 mRNA quantified by qRT-PCR in siAPC Jurkat (G) and primary human T cells (H) stimulated with PMA-Iono or CD3+CD28. Data are representative six experiments in (G) and of three experiments in (H) (mean± SD; Mann-Whitney test).
Similarly, T cells from mice with heteroinsufficiency for Apc (ApcMin/+) exhibited reduced proliferative, cytokine production and Treg lineage commitment responses to TCR stimulation compared to their wild-type counterparts (Figures S2A and S2C–S2G). Moreover, the early response gene c-Myc was also inhibited (Figures S2B and S2H).
NFAT shuttles between the cytoplasm and the nucleus in a phosphorylation-dependent manner. Cytoplasmic NFAT is phosphorylated on several serine residues whose dephosphory-lation by the calcium-dependent phosphatase calcineurin drives NFAT nuclear translocation and gene transcription (Beals et al., 1997a; Okamura et al., 2000). Conversely, phosphorylation by the serine kinases GSK-3b facilitates NFAT nuclear export and cytoplasmic retention (Beals et al., 1997b; Shibasaki et al., 1996). We investigated the effect of APC silencing on NFATC2 (NFAT1), an isoform constitutively expressed in T cells, which concentrates in the nucleus in response to TCR-CD28 stimula-tion or PMA-Iono. Nuclear NFATC2 in APC-silenced activated Jurkat or primary T cells was lower compared to controls. ( Fig-ures 2J–2L,S3A, and S3B). Similarly, DLD-1 carcinoma cells expressing truncated APC were less efficient at translocating NFATC2 and producing NFAT-driven luciferase in response to PMA-Iono than HCT-116 controls (Figures S3C and S3D). Moreover, we observed that NFATC2 was less expressed at the mRNA and protein level in APC-silenced Jurkat cells (Figures 2I and 2M), whereas NFATC1 (NFAT2) isoform expression was not significantly affected (Figure 2N).
Since APC and GSK-3 form a complex (Stamos and Weis, 2013), and GSK-3 phosphorylates NFAT and regulates its nuclear-to-cytoplasmic cycling (Beals et al., 1997b), we inves-tigated whether APC silencing affects NFATC2 phosphoryla-tion. We therefore analyzed NFATC2 phosphorylation status by comparing its electrophoretic mobility. Bands with slower mobility represent more phosphorylated protein species. Apc silencing did not significantly affect the ratio of higher to lower mobility NFAT electrophoretic bands, suggesting that phosphor-ylation was not altered by APC depletion (Figures S4A–S4H).
In sum, APC is necessary for NFATC2 expression and nuclear localization, as well as NFAT-driven gene transcription with func-tional consequences for proliferation, differentiation, and cyto-kine expression.
NFAT Nuclear Localization and Activation Requires Microtubule Integrity
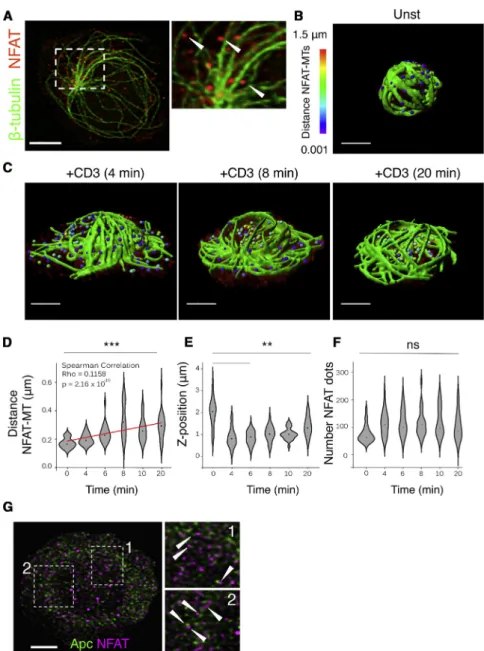
Microtubule disorganization in APC-silenced cells (Figures 1D– 1F) prompted us to hypothesize that APC regulation of microtu-bules may influence NFAT activation, including nuclear localiza-tion and transcriplocaliza-tional activity. Therefore, we first analyzed NFATC2 localization with respect to microtubules. We observed discrete puncta of endogenous NFATC2 juxtaposed to microtu-bules (Figure 3A, arrowheads). We then measured the distance
of NFATC2 microclusters to the closest microtubule at different activation times, using 3D segmentations and quantitative image analysis (Figures 3B and 3C; Movies S2, S3, S4, and S5). NFATC2-microtubule distance wasz0.2 mm in non-stimulated cells and significantly increased upon TCR stimulation (Figures 3C and 3D). NFATC2 microclusters approached to the synapse surface at early activation times and then progressively moved away to a central, peri-nuclear region of the cell as the cell re-tracted from the coverslip (Z-position;Figure 3E). The number of NFAT microclusters was conserved during the course of T cell activation (Figure 3F). These data are consistent with NFATC2 forming microclusters associated with microtubules in resting and early activated T cells and then separating at later times as NFAT translocates to the nucleus.
It was reported that NFAT and APC form cytoplasmic com-plexes that share common partners, like the Ser/Thr kinase GSK-3b, and the cytoskeleton regulator IQGAP (Sharma et al., 2011; Stamos and Weis, 2013). Moreover, both APC and NFAT associate with microtubules displaying spotted patterns (Figures 1C and3A). Therefore, we investigated the relative localization of APC and NFAT. APC and NFAT microclusters did not fully over-lap, although they were often found in close proximity (Figure 3G, arrowheads).
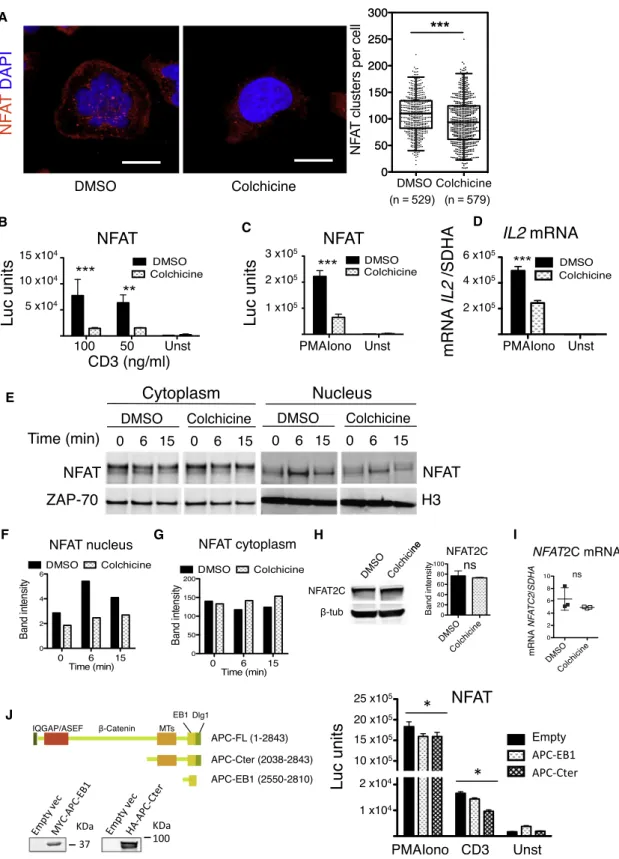
Next, we investigated whether microtubule integrity was required for NFATC2 localization and transcriptional activity. Treatment of T cells with the microtubule polymerization inhibitor colchicine significantly reduced the number of NFAT clusters at the immunological synapse, providing further evidence of the close relationship between NFAT and the microtubule network (Figure 4A). Furthermore, colchicine significantly inhibited NFAT-driven luciferase gene expression under both CD3-CD28 and PMA-Iono T cell stimulations (Figures 4B and 4C). Consis-tently, IL2 mRNA levels were reduced in colchicine-treated cells (Figure 4D). In addition, NFAT nuclear detection was significantly reduced in colchicine-treated T cells (Figures 4E–4G), suggest-ing that the defect of NFAT-dependent transcription could be related to impaired NFAT nuclear localization. In contrast with APC-silenced cells, colchicine-treated T cells displayed comparable amounts of total NFAT protein and mRNA (Figures 4H and 4I), suggesting that NFAT nuclear localization could be microtubule-dependent.
Finally, overexpression of two APC truncated molecules containing the C-terminal APC microtubule and EB1 interacting regions (Etienne-Manneville et al., 2005) significantly inhibited NFAT-driven luciferase expression in Jurkat cells, although less efficiently than APC silencing (Figure 4J).
Altogether, our data indicate that APC controls NFAT-driven gene transcription by regulating NFAT nuclear localization in a microtubule-dependent manner. APC also affects NFAT mRNA and protein levels. APC silencing inhibits NFAT, without altering NF-kB or AP1, leading to reduced IL2 gene expression.
(I) NFAT expression by western blot in APC-silenced cells. Data are representative of four experiments (two-tailed paired t test).
(J–L) Nuclear NFATC2 detection by western blot of cytoplasmic-nuclear fractionations (J) (ZAP-70 cytoplasmic control and histone-3 nuclear). Data are representative of three experiments (K). Mean± SD of three experiments (L), two-way ANOVA.
(M and N) NFATC2 (M) and NFATC1 (N) mRNA quantification by qRT-PCR. Data are representative of four experiments (M) and eight experiments (N) (mean± SD; Mann-Whitney test).
Apc Controls Cytokine Gene Expression by Lamina Propria Tregs
Unlike conventional T cells, Tregs constitutively retain some NFAT in the nucleus, even in the absence of TCR stimulation (Li et al., 2012; Vaeth et al., 2012). This nuclear NFAT fraction is required to maintain a suppressive phenotype, as it cooper-ates with Foxp3 to drive the Treg transcriptional profile and en-hances Foxp3 expression (Tone et al., 2008; van der Veeken et al., 2013; Wu et al., 2006). Because we showed that APC was necessary for optimal accumulation of NFAT in the nucleus of human T cells activated in vitro, we examined the impact of Apc mutation on NFAT localization in Tregs isolated from the in-testinal lamina propria of pre-cancerous (11-week-old) ApcMin/+
mice. Using high-throughput image analysis with imaging flow cytometry, we assessed the nuclear localization of NFAT in Tregs from wild-type (WT) and ApcMin/+mice, finding a small
Figure 3. NFATC2 and Microtubule Locali-zation
(A–F) Endogenous NFATC2 (red) and microtubules (green) in human primary CD4+
T cells activated on anti-CD3-coated coverslips.
(A) Cell-coverslip contact site. Arrowheads indi-cate NFAT clusters. Scale bar, 3 mm.
(B and C) 3D visualization of NFAT (distance-dependent colored dots) and microtubules (green) in unstimulated (B) or 4-8-20 min stimulated (C) cells.
(D) NFAT-microtubule mean distance per cell (Spearman correlation = 0.11).
(E) Distance of NFAT to coverslip (mean per cell). (F) Number of NFAT dots per cell. Data are representative of three experiments (Kruskal-Wallis test of one-way ANOVA).
(G) NFATC2 (green) and APC (magenta) detection in human primary CD4+ T cells on anti-CD3-coated coverslips). Data are representative of three experiments. Scale bar, 3 mm.
See alsoFigure S3.
but significant change in the cellular dis-tribution of NFAT in mutant Tregs, with a shift away from the nucleus (Figure 5A). Moreover, conventional flow cytometric analysis confirmed a significant reduction in Foxp3 protein levels within ApcMin/+
Treg (Figure 5B). Further investigation into Treg phenotypes revealed a dramatic shift in Treg subtypes populating the in-testine of ApcMin/+mice, with a marked reduction in frequencies of RORgt+Tregs that are induced in response to environ-mental cues and are required for the con-trol of inflammation at mucosal surfaces (Ohnmacht et al., 2015; Yang et al., 2016) (Figure 5C). There was a counter-vailing increase in the frequency of thymus-derived, Heliosbright Treg ( Fig-ure 5D). These findings suggest that the ability to either generate or stably main-tain this induced RORgt+Treg population is impaired without full Apc function.
RORgt+Tregs display potent suppressive activity against in-testinal inflammation, and have been noted to produce IL-10, which is critical to this process (Lochner et al., 2008; Ohnmacht et al., 2015; Rubtsov et al., 2008; Yang et al., 2016). Loss of Treg suppressive function has been shown to contribute to inflamma-tory pathology and the growth of intestinal neoplasms in ApcMin/+ mice, and deficient IL-10 production has been implicated (Chae and Bothwell, 2015; Chung et al., 2014; Dennis et al., 2015; Kim et al., 2006; Serebrennikova et al., 2012). We therefore examined the impact of Apc on Treg production of IL-10, assessing cyto-kine production by flow cytometry. We observed a dramatic reduction in IL-10 production by Tregs in the intestine of ApcMin/+(Figure 5E). Because Tregs are the main source of IL-10-producing T cells in the intestinal lamina propria, this loss of
A
B C D
E
F G H I
J
Figure 4. NFAT-Dependent T Cell Activation under Microtubule Disruption
(A) Number of NFATC2 clusters in Jurkat cells (DMSO or colchicine) on anti-CD3-coated coverslips and observed by confocal microscopy. Scale bar, 3 mm. Data are representative of two experiments (whiskers: 2.5th–97.5th percentile; mean± SD; Mann-Whitney test).
(B and C) NFAT-driven luciferase expression in Jurkat cells (DMSO or colchicine), stimulated with anti-CD3+CD28 Abs (B) or PMA-Iono (C). Data are repre-sentative of four experiments (mean± SD; two-way ANOVA).
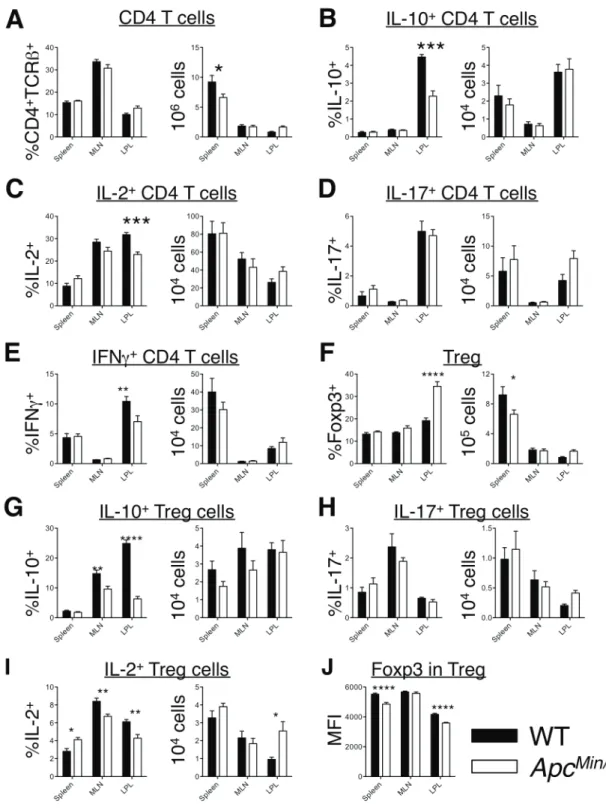
IL-10 was also observed at the level of the entire CD4+T cell pop-ulation (Figure S5B). We also observed a reduction in total CD4+ T cell production of IL-2 and IFNg (Figures S5C and S5E), but did not observe alterations in IL-17 expression at this early time point (11-week-old mice) (Figure S5D). In this line, Treg production of IL-17 was unaffected (Figure S5H).
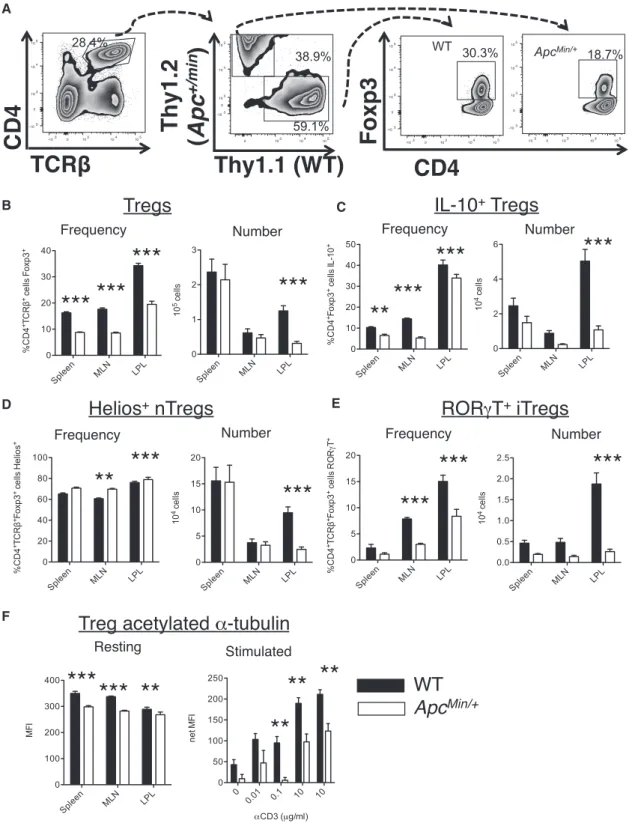
Tregs with Apc mutations have been repeatedly shown to develop distinct phenotypes with a reduced ability to control the inflammatory response in the pre-cancerous intestine (Chae and Bothwell, 2015; Erdman et al., 2005; Gounaris et al., 2009; Serebrennikova et al., 2012). Evidence for a direct effect of Apc in Treg development has been limited (Chae and Bothwell, 2015) since in ApcMin/+mice the mutation could also affect thymic selection and will alter the intestinal microenviron-ment. In order to test whether Apc affects Treg phenotype acqui-sition in a cell-intrinsic manner, we created bone marrow chi-meras in which both WT and ApcMin/+T cells developed in the same milieu, competing for individual niches. Interestingly, in these chimeric mice, CD4+ T cells of WT origin were much
more likely to develop into Foxp3+Tregs in the spleen and lymph nodes as well as the intestinal lamina propria (Figures 6A and 6B). This finding is consistent with the role of NFAT in stabilizing Foxp3 expression. As seen in standard mice, heteroinsufficiency for Apc perturbed the balance between thymic Heliosbright natu-ral Tregs (nTregs) and induced RORgT+IL-10-producing iTregs, with a notable loss of these iTregs among ApcMin/+cells in the in-testine (Figures 6C–6E). Despite developing in exactly the same microenvironment, Tregs arising from ApcMin/+cells exhibited
reduced acetylated a-tubulin, particularly after TCR stimulation (Figure 6F), and reduced IL-17 and IL-2 production (Figures S6G and S6H).
These data indicate that disruption of Apc in murine intestinal Foxp3+ T cells impairs expression of IL-10 and RORgt, and in chimeric mice reduces Treg commitment. This is consistent with impaired NFAT nuclear localization and function, as found in Apc-silenced human T cells.
DISCUSSION
Here, we report a critical role of the polarity regulator APC in TCR signal transduction leading to cytokine gene expression. Impor-tantly, an Apc defect in vivo particularly affects lamina propria Tregs, which display a diminished capacity to produce the anti-inflammatory cytokine IL-10.
We identified APC-regulated microtubule organization as an essential step of NFAT regulation. Importantly, we could visu-alize NFATC2 microclusters juxtaposed with microtubules. Upon
T cell activation, the distance between NFATC2 microclusters and microtubules increased concomitantly with NFATC2 trans-location to the nucleus. Finally, we observed an inhibition of NFAT-driven luciferase gene transcription with colchicine treat-ment upon T cell activation, consistent with findings from neuro-blast cells (Mackenzie and Oteiza, 2007) supporting the impor-tance of microtubules for NFATC2 cellular location. Consistent with a role of microtubules in NFAT translocation to the nucleus, Ishiguro et al., (2011)had shown that NFAT nuclear transport via importin b required tubulin acetylation. In this line, we suggest that microtubules could facilitate NFAT concentration around the nuclear envelope and facilitate its interaction with nuclear pores. This process would depend on APC-dependent microtu-bule organization. Few studies have imaged endogenous NFAT in T lymphocytes, and our work reveals a microcluster distribu-tion of NFATC2 that is not observed when overexpressing the GFP-tagged truncated form of NFAT containing the nuclear localization signal and regulatory serine residues. This suggests that the overexpression of GFP-tagged truncated forms of NFAT, while informative, may only partially recapitulate the regu-lation of endogenous NFAT nuclear translocation. Live imaging of full-length GFP-NFAT appeared particularly challenging since overexpression of this construct was toxic for T cells (S.A.-G., unpublished data).
While APC silencing inhibited NFAT-driven luciferase expres-sion, NF-kB-driven luciferase remained unaltered and colchicine treatment inhibited both NFAT- and NF-kB-driven luciferase expression. This is consistent with reported dynein dependence of NF-kB nuclear translocation (Shrum et al., 2009). In contrast, neither APC silencing nor colchicine altered AP1-driven lucif-erase (Figures 2C and 2F) (E.V.-C., unpublished data). Therefore, the inhibition of IL2 gene transcription by colchicine is likely due to NFAT and NF-kB inhibition. Additionally, some effects of colchicine on early TCR signaling, including TCR synaptic clustering, tyrosine phosphorylation and Erk activation were observed before (Das et al., 2004; Lasserre et al., 2010) that could account for the effect of colchicine on TCR-CD28-induced NFAT activation, but would not affect PMA-Iono activation. These data suggest that different microtubule-driven events control NFAT, NF-kB, and AP1 transcription factor activation. Furthermore, APC silencing may influence IL2 expression through mechanisms other than cytoskeleton reorganization, including reduction of c-Myc and NFAT.
Other proteins use microtubules to translocate from the cyto-plasm to the nucleus. Some of them interact with the dynein mo-tor via their nuclear localization signals. Therefore, microtubule-based active transport could bring proteins to nuclear pores,
(D) IL2 mRNA expression assessed by qRT-PCR in human CD4+
T cells treated with DMSO or colchicine and activated with PMAIono. Data are representative of three experiments (mean± SD; Mann-Whitney test).
(E–G) Western blot analysis (E) of NFAT nuclear/cytoplasmic localization of human primary CD4+
T cells treated with DMSO or colchicine and activated with anti-CD3+anti-CD28 Abs, lysed, fractionated (ZAP-70 cytoplasmic or histone-3 nuclear controls) and quantified (F and G). Data are representative of three experi-ments.
(H and I) NFAT protein and mRNA expression in human CD4+
T cells (DMSO or colchicine) analyzed by (H) western blot and (I) qRT-PCR. Four (H) and three (I) experiments were performed (mean± SD; two-tailed unpaired t test).
(J) Jurkat cells were transfected with expression vectors encoding no gene (empty) or APC-Cter and APC-EB1 schematized on the left. NFAT-driven luciferase expression was analyzed. Data are representative of three experiments (mean± SD; one-way ANOVA).
A
B
C D
E
Figure 5. NFAT Nuclear Localization, IL-10 Production, and iTreg Differentiation of Intestinal Tregs in ApcMin/+Mutant Mice
(A) Nuclear localization of NFAT in lamina propria Tregs (CD4+
TCRb+
Foxp3+
) of WT and ApcMin/+
mice, analyzed by ImageStream (similarity between DAPI and NFAT). Data are representative of two experiments (mean± SD; two-tailed unpaired t test).
facilitating interactions with importins and promoting nuclear translocation (Wagstaff and Jans, 2009). Our results here provide further insight into this general process, indicating that a fine microtubule organization controlled by APC is crucial for NFAT transport to the nucleus or NFAT nuclear localization upon T cell activation.
The Wnt/b-catenin signaling pathway is key for differentiation and growth in various cell systems including thymocytes. APC is part of the b-catenin degradation complex (Stamos and Weis, 2013). APC mutations increase b-catenin cellular levels, deregu-lating cell differentiation and promoting tumor development in epithelial cells, as well as altered thymocyte development ( Gou-nari et al., 2005; McCartney and Na¨thke, 2008). b-catenin is a transcription factor that cooperates with T cell factor-1 to coor-dinate T cell differentiation (Ioannidis et al., 2001). Activation of the TCR leads to b-catenin nuclear stabilization (Lovatt and Bijl-makers, 2010), and a transgenic mouse model of stabilized b-catenin presents reduced LAT and PLCg phosphorylation and cytokine production (Driessens et al., 2011). In this line, APC-silenced cells could behave as cells expressing stabilized b-catenin. However, we observed that APC-silenced displayed no modification of PLCg1 phosphorylation upon TCR activation. In addition, silencing b-catenin was by itself inhibitory for IL2 gene expression and in APC-silenced cells only weakly restored IL2 gene transcription (E.V.-C., unpublished data). This indicates that the effect of APC silencing in T cell activation is unlikely to be entirely due to higher levels of b-catenin.
NFAT cooperates with AP1 and NF-kB to regulate T cell func-tions. NFAT-AP1 interaction regulates the balance between T cell proliferation, T cell anergy and exhaustion (Macia´n et al., 2002; Martinez et al., 2015). Moreover, NFAT regulates Foxp3 expression (Tone et al., 2008) and interacts with Foxp3 to control the transcriptional program of regulatory T cells (Wu et al., 2006). Finally, a fraction of NFAT is constitutively localized in the nu-cleus of Foxp3+T cells (Li et al., 2012). We found that ApcMin/+
intestinal T cells displayed lower levels of total Foxp3 and reduced nuclear NFAT, which together might unbalance cyto-kine gene transcription. This may explain, at least in part, why ApcMin/+ Foxp3+ cells produce IL-10 inefficiently. In further
agreement with our findings in ApcMin/+mice, Gounaris et al. re-ported a reduced percentage of intestinal CD4+Foxp3+cells that produce IL-10 in ApcD468mice. Instead, they found a higher
proportion of cells producing IL-17, proposing that a transition toward pro-inflammatory Th17 cells had taken place (Gounaris et al., 2009). However, neither we nor Chae and Bothwell (2015)found an increased percentage of lamina propria IL-17-producing cells in ApcMin/+mice. These discrepancies in the two different experimental mouse models could be due to differ-ences in age, microbiota, or the state of intestinal inflammation in the animals.
Our data showed a higher proportion of Tregs expressing high levels of Helios and low levels of RORgt in the lamina propria
from ApcMin/+mice, indicative of a nTreg phenotype. Therefore, Apc mutation impairs CD4+T cell differentiation into, or retention of, the iTreg gene program, particularly in lamina propria Treg, in accordance with previous work (Chae and Bothwell, 2015). At the transcriptional level, iTreg generation could be particularly sensitive to NFAT nuclear levels, as iTreg induction in gut-asso-ciated lymphoid tissues is controlled by the non-coding DNA sequence CNS1 at the Foxp3 locus, and CNS1 contains an NFAT-binding site (Zheng et al., 2010). Additionally, our in vitro experiments demonstrate that naive ApcMin/+ T cells fail to
convert into Foxp3+Tregs under suboptimal TCR stimulation, despite responding similarly to TGFb. This suggests that Apc mutations are most likely to affect Treg generation under subop-timal conditions, such as are likely to occur outside the thymus. Tregs play a critical role in the control of cancer development in Apc mutant mouse models, as established by experiments in which transfer of WT, but not Apc mutant CD4+Foxp3+, cells to these mice reduced polyp growth. Moreover, cell-intrinsic loss of a single allele of Apc reduced the ability of Tregs to control cytokine production, and loss of both alleles resulted in a lym-phoproliferative wasting phenotype reminiscent of Foxp3 defi-ciency (Chae and Bothwell, 2015). Therefore, Apc mutant mice appear unable to control cancer-associated intestinal inflamma-tion, as assessed by elevated cytokine transcripts, conversion of T cells to pro-inflammatory phenotypes (IL-17) and increased in-testinal mastocytosis (Akeus et al., 2014; Chae and Bothwell, 2015; Gounaris et al., 2007, 2009). Our data are consistent with an intrinsic developmental change in Tregs possibly due to impaired NFAT-driven transcription, including IL-10 (Wu et al., 2006). This intrinsic genetic defect likely acts in concert with other factors in the intestinal microenvironment to result in Treg impairment, as previously suggested by others (Chae and Bothwell, 2015; Peuker et al., 2016).
In sum, we show that the polarity regulator APC modifies NFAT transcriptional activity, and we propose that this phenomenon could be relevant for Treg anti-inflammatory phenotypes in the ApcMin/+ mice model of colorectal cancer. We propose that
APC could have a dual role in colorectal cancer progression, pro-moting both epithelial transformation and T lymphocyte dysfunc-tion through suboptimal NFAT reguladysfunc-tion.
EXPERIMENTAL PROCEDURES
Antibodies and reagents are described in theSupplemental Experimental Procedures.
Statistical Analysis
Statistical analyses were performed with Prism software (GraphPad). Details about the data presentation, the experimental replication, and the adequate statistical tests used are included in the individual figure legends. Significance symbols are as follows *p < 0.05, ** p < 0.01, *** p < 0.001; ns, non-significant. Mean± SD was plotted unless otherwise specified. No data were excluded from the analysis. Experiment sample sizes were selected based on previous
(B–E) Proportional representation and total numbers of small intestinal lamina propria Foxp3+Tregs in WT and ApcMin/+mice. Foxp3 MFI, and Foxp3+Tregs frequency and total number (B). RORgT+
iTregs (C). Heliosbright
nTregs (D). IL-10-expressing Tregs (E). Data are representative of three experiments (mean± SD; two-tailed unpaired t test).
A
B C
D E
F
Figure 6. Effect of Apc Mutation on Treg Phenotypes in a Mixed Bone Marrow Chimera
(A) Representative flow cytometry plots showing Foxp3 gating among Thy1.1+
WT or Thy1.2+
Apc+/Min
cells in the small intestinal lamina propria. (B) Frequency and total numbers of Foxp3+
Tregs among CD4+
TCRb+
T cells derived from either Thy1.1+
WT cells or Thy1.2+
Apc+/Min
cells. (C) Frequency and numbers of IL-10-producing Tregs.
(D) Frequency and numbers of Heliosbright
nTregs.
experience with the experimental methods, erring on the larger size. Data met the assumptions of the statistical tests. Sample variance was analyzed for samples > 30 with Prism software. Data were analyzed by observers aware of the sample identities. For selected microscopy experiments, data were examined by a second observer unaware of sample identities. All relevant data are available from the authors.
Cells, siRNA, Cell Culture, and Transfection
Jurkat E6.1 cells (referred to as Jurkat) and Jurkat cells stably expressing YFP-SLP-76 (YFP-SLP-76 YFP) have been previously described (Di Bartolo et al., 2007; Lasserre et al., 2011). DLD-1 and HCT-116 human colorectal carcinoma cell lines came from ATCC. Human peripheral blood T cells from healthy volunteers were obtained through the ICAReB core facility at the Institut Pasteur (NSF 96-900 certified, from sampling to distribution, reference BB-0033-00062/ ICAReB platform/ Institut Pasteur, Paris, France/BBMRI AO203/ 1 distribution/ access: 2016, May 19th, [BIORESOURCE]), under the CoSImmGEn pro-tocol approved by the Committee of Protection of Persons, Ile de France-1 (no. 2010-dec-12483). Informed consent was obtained from all subjects. Isola-tion of peripheral blood T cells, cell culture methods, and small interfering RNA (siRNA) transfection is described in theSupplemental Experimental Proced-ures. Isolation of peripheral blood T cells, cell culture methods, and siRNA transfection is described in theSupplemental Experimental Procedures.
Immunofluorescence, Confocal Microcopy, and Image Analysis
Microscopy methods are previously described (Lasserre et al., 2011) and/or detailed in theSupplemental Experimental Procedures.
T Cell Activation
Analyses of protein phosphorylation, tubulin acetylation, intracellular calcium concentration, transcription factor activation by luciferase assays, IL2 and NFAT mRNA measurements by qRT-PCR, and nuclear NFAT detection by cytoplasm/nucleus cell fractionation or by immunofluorescence were per-formed following the standard methods described in theSupplemental Exper-imental Procedures.
ApcMin/+Mice, Mesenteric Lymph Node, and Lamina Propria
Lymphocyte Isolation
Heterozygous C57BL/6J-ApcMin
(ApcMin/+
) mice and matched wild-type con-trols were purchased from the Jackson Laboratory. All mice were bred and maintained under specific pathogen-free barrier conditions. Animal proced-ures were performed under protocols approved by the Boston Children’s Hos-pital Institutional Animal Care and Use Committee. Animals were sacrificed at 11-12 weeks of age. Females were used. Animals were not randomized. Inves-tigators were not blinded to animal allocation during experiments and outcome assessment.
Generation of mixed bone marrow chimeras, intestinal leukocyte isolation, intracellular cytokine staining, and NFAT nuclear localization in intestinal Tregs by ImageStream flow cytometry was performed following the standard methods described in theSupplemental Experimental Procedures.
SUPPLEMENTAL INFORMATION
Supplemental Information includes Supplemental Experimental Materials, six figures, and seven movies and can be found with this article online athttp://dx. doi.org/10.1016/j.celrep.2017.09.020.
AUTHOR CONTRIBUTIONS
S.A.-G. designed and performed the experiments, developed the project, and wrote the manuscript; O.T.B. designed and performed the experiments and contributed to manuscript writing; E.V.-C. designed and performed the
exper-iments and assisted in writing the manuscript; C.C. and F.H. performed the ex-periments, developed the assays, and provided technical support; J.B. and R.L. provided scientific advice; I.d.R.-I. provided expertise and developed the assays; V.d.B. designed and performed experiments, provided expertise, and assisted in writing the manuscript; and A.A. conceived the project, de-signed the experiments, and wrote the manuscript.
ACKNOWLEDGMENTS
This work was supported by grants from ANR (11BSV302501), The People Programme (Marie Sk1odowska-Curie Actions) of the European Union’s Sev-enth Framework Programme (FP7/2007-2013) under a REA grant agreement (no. 317057 HOMIN-ITN), the Institut Pasteur, INSERM, and CNRS (to A.A.) and ARC (PJA-20131200429) (to S.A.-G.). The following fellowships are acknowledged: ARC and ANR postdoctoral fellowships (PDF20101202232 and 11BSV302501 to S.A.-G.); NIDDK K01 career development grant (1K01DK106303-01) (to O.T.B.); ANR (11BSV302501) and Sidaction postdoc-toral fellowships (to E.V.-C.); an ANR fellowship (11BSV302501 to F.H.); ANRS (1121/AO2013-2) and Roux-Institut Pasteur postdoctoral fellowships (to J.B.); ANR (11BSV302501), ANRS (1613/CSS1/AO2010-2), and Roux-Institut Pas-teur postdoctoral fellowships (to R.L.); and an EU Marie Curie Actions HOMIN-ITN predoctoral fellowship (to I.d.R.-I., who is a scholar in the Pas-teur-Paris University [PPU] International PhD program). We thank J.Y. Tinevez, A. Danckaert, P. Roux, A. Salles, E. Perret, and Photonic BioImaging UTechS, Institut Pasteur for image quantification and technical support and the Cytom-etry and Biomarkers UTechS, Institut Pasteur for technical support. We are grateful to I. Na¨thke, I. Newton, M. Bornens, S. Etienne-Manneville, A. Echard, R. Weil, M. Garcı´a-Gracera´, and M. Almena for plasmids, antibodies, reagents, advice, and statistical analysis, G. Eberl for discussions and critical reading of the manuscript, and the ICAReB team for providing primary T cell samples. Received: July 20, 2016
Revised: August 4, 2017 Accepted: September 5, 2017 Published: October 3, 2017
REFERENCES
Ag€uera-Gonzalez, S., Bouchet, J., and Alcover, A. (2015). Immunological Synapse (John Wiley & Sons). http://dx.doi.org/10.1002/9780470015902. a0004027.pub2. http://onlinelibrary.wiley.com/doi/10.1002/9780470015902. a0004027.pub2/full.
Akeus, P., Langenes, V., von Mentzer, A., Yrlid, U., Sjo¨ling, A˚., Saksena, P., Ra-ghavan, S., and Quiding-Ja¨rbrink, M. (2014). Altered chemokine production and accumulation of regulatory T cells in intestinal adenomas of APC(Min/+) mice. Cancer Immunol. Immunother. 63, 807–819.
Beals, C.R., Clipstone, N.A., Ho, S.N., and Crabtree, G.R. (1997a). Nuclear localization of NF-ATc by a calcineurdependent, cyclosporsensitive in-tramolecular interaction. Genes Dev. 11, 824–834.
Beals, C.R., Sheridan, C.M., Turck, C.W., Gardner, P., and Crabtree, G.R. (1997b). Nuclear export of NF-ATc enhanced by glycogen synthase kinase-3. Science 275, 1930–1934.
Be´roud, C., and Soussi, T. (1996). APC gene: database of germline and somatic mutations in human tumors and cell lines. Nucleic Acids Res. 24, 121–124.
Bertrand, F., Esquerre´, M., Petit, A.E., Rodrigues, M., Duchez, S., Delon, J., and Valitutti, S. (2010). Activation of the ancestral polarity regulator protein kinase C zeta at the immunological synapse drives polarization of Th cell secretory machinery toward APCs. J. Immunol. 185, 2887–2894.
(E) Frequency and numbers of RORgT+iTregs.
(F) Expression of acetylated a-tubulin in freshly isolated Foxp3+
Tregs from chimeric mice or after 72 hr stimulation with varying concentrations of aCD3 (splenocytes only). Mean± SD, two-way ANOVA with Bonferroni post-tests matching within individual chimeric mice.
Bunnell, S.C., Hong, D.I., Kardon, J.R., Yamazaki, T., McGlade, C.J., Barr, V.A., and Samelson, L.E. (2002). T cell receptor ligation induces the formation of dynamically regulated signaling assemblies. J. Cell Biol. 158, 1263–1275.
Campi, G., Varma, R., and Dustin, M.L. (2005). Actin and agonist MHC-peptide complex-dependent T cell receptor microclusters as scaffolds for signaling. J. Exp. Med. 202, 1031–1036.
Chae, W.J., and Bothwell, A.L. (2015). Spontaneous intestinal tumorigenesis in Apc (/Min+) mice requires altered T cell development with IL-17A. J. Immunol. Res. 2015, 860106.
Chung, A.Y., Li, Q., Blair, S.J., De Jesus, M., Dennis, K.L., LeVea, C., Yao, J., Sun, Y., Conway, T.F., Virtuoso, L.P., et al. (2014). Oral interleukin-10 alleviates polyposis via neutralization of pathogenic T-regulatory cells. Cancer Res. 74, 5377–5385.
Das, V., Nal, B., Dujeancourt, A., Thoulouze, M.I., Galli, T., Roux, P., Dautry-Varsat, A., and Alcover, A. (2004). Activation-induced polarized recycling tar-gets T cell antigen receptors to the immunological synapse; involvement of SNARE complexes. Immunity 20, 577–588.
Dennis, K.L., Saadalla, A., Blatner, N.R., Wang, S., Venkateswaran, V., Gou-nari, F., Cheroutre, H., Weaver, C.T., Roers, A., Egilmez, N.K., and Khazaie, K. (2015). T-cell expression of IL10 is essential for tumor immune surveillance in the small intestine. Cancer Immunol. Res. 3, 806–814.
Di Bartolo, V., Montagne, B., Salek, M., Jungwirth, B., Carrette, F., Fourtane, J., Sol-Foulon, N., Michel, F., Schwartz, O., Lehmann, W.D., and Acuto, O. (2007). A novel pathway down-modulating T cell activation involves HPK-1-dependent recruitment of 14-3-3 proteins on SLP-76. J. Exp. Med. 204, 681–691.
Driessens, G., Zheng, Y., Locke, F., Cannon, J.L., Gounari, F., and Gajewski, T.F. (2011). Beta-catenin inhibits T cell activation by selective interference with linker for activation of T cells-phospholipase C-g1 phosphorylation. J. Immunol. 186, 784–790.
Elric, J., and Etienne-Manneville, S. (2014). Centrosome positioning in polar-ized cells: common themes and variations. Exp. Cell Res. 328, 240–248.
Erdman, S.E., Sohn, J.J., Rao, V.P., Nambiar, P.R., Ge, Z., Fox, J.G., and Schauer, D.B. (2005). CD4+CD25+ regulatory lymphocytes induce regression of intestinal tumors in ApcMin/+ mice. Cancer Res. 65, 3998–4004.
Etienne-Manneville, S. (2009). APC in cell migration. Adv. Exp. Med. Biol. 656, 30–40.
Etienne-Manneville, S., Manneville, J.B., Nicholls, S., Ferenczi, M.A., and Hall, A. (2005). Cdc42 and Par6-PKCzeta regulate the spatially localized association of Dlg1 and APC to control cell polarization. J. Cell Biol. 170, 895–901.
Gounari, F., Chang, R., Cowan, J., Guo, Z., Dose, M., Gounaris, E., and Kha-zaie, K. (2005). Loss of adenomatous polyposis coli gene function disrupts thymic development. Nat. Immunol. 6, 800–809.
Gounaris, E., Erdman, S.E., Restaino, C., Gurish, M.F., Friend, D.S., Gounari, F., Lee, D.M., Zhang, G., Glickman, J.N., Shin, K., et al. (2007). Mast cells are an essential hematopoietic component for polyp development. Proc. Natl. Acad. Sci. USA 104, 19977–19982.
Gounaris, E., Blatner, N.R., Dennis, K., Magnusson, F., Gurish, M.F., Strom, T.B., Beckhove, P., Gounari, F., and Khazaie, K. (2009). T-regulatory cells shift from a protective anti-inflammatory to a cancer-promoting proinflammatory phenotype in polyposis. Cancer Res. 69, 5490–5497.
Ioannidis, V., Beermann, F., Clevers, H., and Held, W. (2001). The beta-cate-nin–TCF-1 pathway ensures CD4(+)CD8(+) thymocyte survival. Nat. Immunol.
2, 691–697.
Ishiguro, K., Ando, T., Maeda, O., Watanabe, O., and Goto, H. (2011). Cutting edge: tubulin a functions as an adaptor in NFAT-importin b interaction. J. Immunol. 186, 2710–2713.
Kim, B.G., Li, C., Qiao, W., Mamura, M., Kasprzak, B., Anver, M., Wolfraim, L., Hong, S., Mushinski, E., Potter, M., et al. (2006). Smad4 signalling in T cells is required for suppression of gastrointestinal cancer. Nature 441, 1015–1019.
Kroboth, K., Newton, I.P., Kita, K., Dikovskaya, D., Zumbrunn, J., Waterman-Storer, C.M., and Na¨thke, I.S. (2007). Lack of adenomatous polyposis coli
protein correlates with a decrease in cell migration and overall changes in microtubule stability. Mol. Biol. Cell 18, 910–918.
Lasserre, R., Charrin, S., Cuche, C., Danckaert, A., Thoulouze, M.I., de Chau-mont, F., Duong, T., Perrault, N., Varin-Blank, N., Olivo-Marin, J.C., et al. (2010). Ezrin tunes T-cell activation by controlling Dlg1 and microtubule posi-tioning at the immunological synapse. EMBO J. 29, 2301–2314.
Lasserre, R., Cuche, C., Blecher-Gonen, R., Libman, E., Biquand, E., Danck-aert, A., Yablonski, D., Alcover, A., and Di Bartolo, V. (2011). Release of serine/threonine-phosphorylated adaptors from signaling microclusters down-regulates T cell activation. J. Cell Biol. 195, 839–853.
Li, Q., Shakya, A., Guo, X., Zhang, H., Tantin, D., Jensen, P.E., and Chen, X. (2012). Constitutive nuclear localization of NFAT in Foxp3+ regulatory T cells independent of calcineurin activity. J. Immunol. 188, 4268–4277.
Lochner, M., Peduto, L., Cherrier, M., Sawa, S., Langa, F., Varona, R., Rieth-macher, D., Si-Tahar, M., Di Santo, J.P., and Eberl, G. (2008). In vivo equilib-rium of proinflammatory IL-17+ and regulatory IL-10+ Foxp3+ RORgamma t+ T cells. J. Exp. Med. 205, 1381–1393.
Lovatt, M., and Bijlmakers, M.J. (2010). Stabilisation of b-catenin downstream of T cell receptor signalling. PLoS ONE 5, 5.
Ludford-Menting, M.J., Oliaro, J., Sacirbegovic, F., Cheah, E.T., Pedersen, N., Thomas, S.J., Pasam, A., Iazzolino, R., Dow, L.E., Waterhouse, N.J., et al. (2005). A network of PDZ-containing proteins regulates T cell polarity and morphology during migration and immunological synapse formation. Immunity
22, 737–748.
Macia´n, F., Garcı´a-Co´zar, F., Im, S.H., Horton, H.F., Byrne, M.C., and Rao, A. (2002). Transcriptional mechanisms underlying lymphocyte tolerance. Cell
109, 719–731.
Mackenzie, G.G., and Oteiza, P.I. (2007). Zinc and the cytoskeleton in the neuronal modulation of transcription factor NFAT. J. Cell. Physiol. 210, 246–256.
Martinez, G.J., Pereira, R.M., A¨ijo¨, T., Kim, E.Y., Marangoni, F., Pipkin, M.E., Togher, S., Heissmeyer, V., Zhang, Y.C., Crotty, S., et al. (2015). The transcrip-tion factor NFAT promotes exhaustranscrip-tion of activated CD8+
T cells. Immunity 42, 265–278.
McCartney, B.M., and Na¨thke, I.S. (2008). Cell regulation by the Apc protein Apc as master regulator of epithelia. Curr. Opin. Cell Biol. 20, 186–193.
Mogensen, M.M., Tucker, J.B., Mackie, J.B., Prescott, A.R., and Na¨thke, I.S. (2002). The adenomatous polyposis coli protein unambiguously localizes to microtubule plus ends and is involved in establishing parallel arrays of micro-tubule bundles in highly polarized epithelial cells. J. Cell Biol. 157, 1041–1048.
Moser, A.R., Pitot, H.C., and Dove, W.F. (1990). A dominant mutation that pre-disposes to multiple intestinal neoplasia in the mouse. Science 247, 322–324.
Na¨thke, I.S., Adams, C.L., Polakis, P., Sellin, J.H., and Nelson, W.J. (1996). The adenomatous polyposis coli tumor suppressor protein localizes to plasma membrane sites involved in active cell migration. J. Cell Biol. 134, 165–179.
Nelson, S., and Na¨thke, I.S. (2013). Interactions and functions of the adenoma-tous polyposis coli (APC) protein at a glance. J. Cell Sci. 126, 873–877.
Ohnmacht, C., Park, J.H., Cording, S., Wing, J.B., Atarashi, K., Obata, Y., Gaboriau-Routhiau, V., Marques, R., Dulauroy, S., Fedoseeva, M., et al. (2015). Mucosal immunology. The microbiota regulates type 2 immunity through RORgt(+) T cells. Science 349, 989–993.
Okamura, H., Aramburu, J., Garcı´a-Rodrı´guez, C., Viola, J.P., Raghavan, A., Tahiliani, M., Zhang, X., Qin, J., Hogan, P.G., and Rao, A. (2000). Concerted dephosphorylation of the transcription factor NFAT1 induces a conformational switch that regulates transcriptional activity. Mol. Cell 6, 539–550.
Peuker, K., Muff, S., Wang, J., K€unzel, S., Bosse, E., Zeissig, Y., Luzzi, G., Basic, M., Strigli, A., Ulbricht, A., et al. (2016). Epithelial calcineurin controls microbiota-dependent intestinal tumor development. Nat. Med. 22, 506–515.
Real, E., Faure, S., Donnadieu, E., and Delon, J. (2007). Cutting edge: atypical PKCs regulate T lymphocyte polarity and scanning behavior. J. Immunol. 179, 5649–5652.
Rodriguez-Boulan, E., and Macara, I.G. (2014). Organization and execution of the epithelial polarity programme. Nat. Rev. Mol. Cell Biol. 15, 225–242.
Round, J.L., Humphries, L.A., Tomassian, T., Mittelstadt, P., Zhang, M., and Miceli, M.C. (2007). Scaffold protein Dlgh1 coordinates alternative p38 kinase activation, directing T cell receptor signals toward NFAT but not NF-kappaB transcription factors. Nat. Immunol. 8, 154–161.
Rubtsov, Y.P., Rasmussen, J.P., Chi, E.Y., Fontenot, J., Castelli, L., Ye, X., Treuting, P., Siewe, L., Roers, A., Henderson, W.R., Jr., et al. (2008). Regula-tory T cell-derived interleukin-10 limits inflammation at environmental inter-faces. Immunity 28, 546–558.
Serebrennikova, O.B., Tsatsanis, C., Mao, C., Gounaris, E., Ren, W., Siracusa, L.D., Eliopoulos, A.G., Khazaie, K., and Tsichlis, P.N. (2012). Tpl2 ablation pro-motes intestinal inflammation and tumorigenesis in Apcmin mice by inhibiting IL-10 secretion and regulatory T-cell generation. Proc. Natl. Acad. Sci. USA
109, E1082–E1091.
Sharma, S., Findlay, G.M., Bandukwala, H.S., Oberdoerffer, S., Baust, B., Li, Z., Schmidt, V., Hogan, P.G., Sacks, D.B., and Rao, A. (2011). Dephosphory-lation of the nuclear factor of activated T cells (NFAT) transcription factor is regulated by an RNA-protein scaffold complex. Proc. Natl. Acad. Sci. USA
108, 11381–11386.
Shibasaki, F., Price, E.R., Milan, D., and McKeon, F. (1996). Role of kinases and the phosphatase calcineurin in the nuclear shuttling of transcription factor NF-AT4. Nature 382, 370–373.
Shrum, C.K., Defrancisco, D., and Meffert, M.K. (2009). Stimulated nuclear translocation of NF-kappaB and shuttling differentially depend on dynein and the dynactin complex. Proc. Natl. Acad. Sci. USA 106, 2647–2652.
Soares, H., Lasserre, R., and Alcover, A. (2013). Orchestrating cytoskeleton and intracellular vesicle traffic to build functional immunological synapses. Immunol. Rev. 256, 118–132.
Stamos, J.L., and Weis, W.I. (2013). The b-catenin destruction complex. Cold Spring Harb. Perspect. Biol. 5, a007898.
Su, L.K., Kinzler, K.W., Vogelstein, B., Preisinger, A.C., Moser, A.R., Luongo, C., Gould, K.A., and Dove, W.F. (1992). Multiple intestinal neoplasia caused by a mutation in the murine homolog of the APC gene. Science 256, 668–670.
Tanner, S.M., Daft, J.G., Hill, S.A., Martin, C.A., and Lorenz, R.G. (2016). Altered T-cell balance in lymphoid organs of a mouse model of colorectal can-cer. J. Histochem. Cytochem. 64, 753–767.
Tone, Y., Furuuchi, K., Kojima, Y., Tykocinski, M.L., Greene, M.I., and Tone, M. (2008). Smad3 and NFAT cooperate to induce Foxp3 expression through its enhancer. Nat. Immunol. 9, 194–202.
Vaeth, M., Schliesser, U., M€uller, G., Reissig, S., Satoh, K., Tuettenberg, A., Jo-nuleit, H., Waisman, A., M€uller, M.R., Serfling, E., et al. (2012). Dependenceon nu-clear factor of activated T-cells (NFAT) levels discriminates conventional T cells from Foxp3+ regulatory T cells. Proc. Natl. Acad. Sci. USA 109, 16258–16263.
van der Veeken, J., Arvey, A., and Rudensky, A. (2013). Transcriptional control of regulatory T-cell differentiation. Cold Spring Harb. Symp. Quant. Biol. 78, 215–222.
Wagstaff, K.M., and Jans, D.A. (2009). Importins and beyond: non-conven-tional nuclear transport mechanisms. Traffic 10, 1188–1198.
Wu, Y., Borde, M., Heissmeyer, V., Feuerer, M., Lapan, A.D., Stroud, J.C., Bates, D.L., Guo, L., Han, A., Ziegler, S.F., et al. (2006). FOXP3 controls regu-latory T cell function through cooperation with NFAT. Cell 126, 375–387.
Xavier, R., Rabizadeh, S., Ishiguro, K., Andre, N., Ortiz, J.B., Wachtel, H., Mor-ris, D.G., Lopez-Ilasaca, M., Shaw, A.C., Swat, W., and Seed, B. (2004). Discs large (Dlg1) complexes in lymphocyte activation. J. Cell Biol. 166, 173–178.
Yang, B.H., Hagemann, S., Mamareli, P., Lauer, U., Hoffmann, U., Beckstette, M., Fo¨hse, L., Prinz, I., Pezoldt, J., Suerbaum, S., et al. (2016). Foxp3(+) T cells expressing RORgt represent a stable regulatory T-cell effector lineage with enhanced suppressive capacity during intestinal inflammation. Mucosal Im-munol. 9, 444–457.
Yokosuka, T., Sakata-Sogawa, K., Kobayashi, W., Hiroshima, M., Hashimoto-Tane, A., Tokunaga, M., Dustin, M.L., and Saito, T. (2005). Newly generated T cell receptor microclusters initiate and sustain T cell activation by recruit-ment of Zap70 and SLP-76. Nat. Immunol. 6, 1253–1262.
Zeineldin, M., and Neufeld, K.L. (2013). More than two decades of Apc modeling in rodents. Biochim. Biophys. Acta 1836, 80–89.
Zheng, Y., Josefowicz, S., Chaudhry, A., Peng, X.P., Forbush, K., and Ruden-sky, A.Y. (2010). Role of conserved non-coding DNA elements in the Foxp3 gene in regulatory T-cell fate. Nature 463, 808–812.
Cell Reports, Volume
21
Supplemental Information
Adenomatous Polyposis Coli De
fines Treg
Differentiation and Anti-in
flammatory Function
through Microtubule-Mediated NFAT Localization
Sonia Agüera-González, Oliver T. Burton, Elena Vázquez-Chávez, Céline Cuche, Floriane
Herit,
Jérôme
Bouchet,
Rémi
Lasserre,
Iratxe
del
Río-Iñiguez,
Vincenzo
Di Bartolo, and Andrés Alcover
Supplemental Information
Supplemental Figures and Legends
Figure S1 (linked to Figure 1): Effect of APC silencing in early T cell activation events.
A) Generation of SLP76-YFP microclusters in siCont and siAPC Jurkat cells on pseudopsynapses (anti-CD3-coated coverslips, 3 min). Framed regions are zoomed on the right panels. Graph represents number of microclusters per cell (whiskers: min-max,+: mean). Representative experiment of three (mean±SD, Mann-Whitney). Scale bar 3 µm. B) Intensity of SLP76 YFP microclusters (whiskers: min-max, +: mean). Representative experiment of two (mean±SD, Mann-Whitney). C, D) Dynamics of SLP76-YFP microclusters. Kymographs of centripetal microcluster movement were generated and trajectory angles were measured. Representative of two (mean±SD, Mann-Whitney). E-G) Tyr phosphorylation of proximal TCR signaling molecules in siCont and siAPC Jurkat cells activated with soluble anti-CD3+CD28 Abs, p-ZAP70, Tyr319 (E) and p-PLCγ1, Tyr783 (F). E, F) Blots of one representative experiment. G Left) Band intensity (normalized to β-tubulin) of experiment shown. G Right) Mean±SD of three experiments, 2-way ANOVA. H) Intracellular calcium concentration. Jurkat cells (siCont or siAPC) were loaded with the Ca2+
Figure S2 (linked to Figure 2): Impact of heterozygous Apc mutation on T cell activation and differentiation in vitro.
A) Representative flow histograms showing dye dilution in proliferating CD4+ T cells after 72h stimulation with
varying concentrations of anti-CD3+CD28. B) Analysis of c-Myc and acetylated a-tubulin in CD4+ T cells
following activation with anti-CD3+CD28. C) ELISA analysis of secreted IL-10. D) ELISA analysis of IL-10 secreted by WT and Apc+/Min T cells under Foxp3-inducing conditions. E) Impact of heterozygous Apc mutation on
Foxp3 induction in naïve T cells in vitro. Foxp3+ T cells induced under varying concentrations of TGFβ.
Frequencies and total numbers of Foxp3+ T cells recovered are shown. F) Foxp3+ T cells induced under varying
concentrations of TGFβ in the presence of IL-2 (5ng/ml). G) Foxp3+ T cells induced in response to varying
concentrations of anti-CD3 + CD28. H) c-Myc and acetylated a-tubulin expression in Foxp3+ T cells generated in
responses to variable TCR stimulation. Data are presented as the mean±SD of triplicate cultures, and are representative of two independent experiments. Statistical analysis by 2-way ANOVA with Bonferroni post-tests for individual concentrations.
Figure S3 (linked to F2): Effect of APC silencing or APC truncation on NFAT nuclear translocation and NFAT-driven transcription.
A, B) NFATc2 nuclear localization in Jurkat (A), or human primary CD4+ T cells (B). activated with SEE-loaded Raji
cells as antigen presenting cells. Immunological synapses were scored using p-TCRζ staining. Representative of three experiments in A and two in B (mean±SD Mann-Whitney). Scale bar 5 µm. C) HCT-116 and DLD-1 colon carcinoma cells expressing full-length or truncated APC, respectively, were activated with 10 ng/ml PMA and increased concentrations of calcium ionophore (5 min). NFATc2 nuclear localization was measured using a mask based on Dapi nuclear staining. Representative of two experiments. (mean±SD Mann-Whitney test). Scale bar 5 µm. D) HCT-116 and DLD-1 carcinoma cells were analyzed for their capacity to activate NFAT-driven luciferase in response to PMA-Iono activation. Average of three experiments (mean±SD, 2-way ANOVA).
Figure S4 (linked to F2): APC silencing does not alter NFAT dephosphorylation upon T cell activation. Jurkat cells were processed as in Fig. 2J. Densitometry of NFATC2 western blot bands was performed for a distance of 24 pixels (arrow on the right side). A, E) Nuclear and cytoplasmic NFATC2 western blots. B, F) Densitometry histograms of nuclear and cytoplasmic NFATC2 bands revealing higher bands corresponding to phospho-NFAT (P-NFAT, orange) and lower bands corresponding to dephospho-NFAT (DeP-NFAT, green). C, G) Quantification of histograms in panels B and F, respectively.
D, H)
Quantification of three experiments (mean±SD, 2-way ANOVA).Figure S5 (linked to F5): Impact of heterozygous Apc mutation on frequencies and total numbers of cytokine-producing T helper subsets.
A) Percentages and total numbers of CD4+TCRβ+ cells WT vs. ApcMin/+ mice. B) IL-10-expressing T
cells. C) IL-2-producing T cells. D) Th17 cells. E) IFNγ+ cells. F) Tregs. G) IL-10+ Treg. H) IL-17+ Treg. I) IL-2+ Treg. J) Level of Foxp3 expression within Foxp3+ cells. Representative of two experiments.
Figure S6 (linked to F6): Cell-intrinsic effect of Apc mutation on T cell phenotypes in a mixed bone marrow chimera.
A) Origin (Thy1.1+ WT or Thy1.2+ ApcMin/+) and total numbers of CD4+TCRβ+ T cells in mixed bone
marrow chimerae. B) Origin and numbers of CD4-TCRβ+ (CD8) T cells. C) Frequency of IL-2 production
among WT or ApcMin/+ CD4+ T cells, and total numbers of IL-2+ cells of each type. D) Frequency and
numbers of IL-17+ CD4 T cells. E) Frequency and numbers of IL-10+ CD4 T cells. F) Expression of
acetylated α-tubulin in freshly isolated CD4 T cells from chimeric mice, or after 72 h stimulation with varying concentrations of anti-CD3 (splenocytes only). G) Frequency and total numbers of IL-17-producing cells among Foxp3+ cells of Thy1.1+ WT or Thy1.2+ ApcMin/+ origin in mixed bone marrow
chimerae. H) Frequency and numbers of IL-2+ Treg. Mean±SD, statistical analysis by repeated measures
Supplemental videos
Movie S1: 3D reconstruction of confocal microscopy images of APC (Red) and microtubules (Green) of Figure 1C. Jurkat cells were activated for 3 min on anti-CD3-coated coverslips, fixed, stained for anti-β-tubulin (green) and anti- APC (red).
Movie S2: 3D segmentation of NFAT clusters (Colored dots) and microtubules (Green) of Figure 3B (Unstimulated cells). NFAT clusters were colored ranging from violet to red according to their distance to the closest microtubule (colored scale).
Movie S3: 3D segmentation of NFAT clusters (Colored dots) and microtubules (Green) of Figure 3C (4 minutes stimulation).
Movie S4: 3D segmentation of NFAT clusters (Colored dots) and microtubules (Green) of Figure 3C (8 minutes stimulation).
Movie S5: 3D segmentation of NFAT clusters (Colored dots) and microtubules (Green) of Figure 3C (20 minutes stimulation).
Video S6: Microcluster dynamics in siCont SLP-YFP Jurkat cells stimulated on anti-CD3-coated coverslips. Video S7: Microcluster dynamics in siAPC SLP-YFP Jurkat cells stimulated on anti-CD3-coated coverslips.
Supplemental Experimental Procedures
Materials Antibodies
Antibodies used for western blots: mouse IgG1 anti-APC (N-terminal) (Ali-12-28, Abcam) at 1µg/ml, mouse anti-β-tubulin (Sigma) at 1/1000, mouse anti-acetylated-anti-β-tubulin (Ac-anti-β-tubulin) (Lys40, clone 6-11B-1, Sigma) at 0.6 µg/ml,
rabbit anti-phospho-ZAP-70 (pY319) (Cell Signaling) at 1/1000, rabbit anti-phospho-PLCγ1 (Tyr783) (Cell Signaling) at 1/1000, rabbit ZAP-70 (Becton Dickinson) at 1/1000, rabbit PLCγ1 (Cell Signaling) at 1/1000, rabbit anti-SLP76 (ThermoFisher Scientific) at 1/1000, rabbit anti-NFAT1 (Cell Signaling) at 1/1000 and rabbit anti-histone-3 (H3) (Abcam) at 1 µg/ml.
Antibodies used for immunofluorescence: rabbit anti-APC (gift of I. Näthke, University of Dundee) at 1/500, mouse IgG2b anti-β-tubulin (clone KMX-1, Millipore) at 10 µg/ml, rabbit anti-centrin (gift of M. Bornens, Institut Curie) at 1/400, mouse IgG1 anti-NFAT (BD Biosciences) and rabbit anti-NFAT1 (Cell Signaling) at 1/150. Secondary antibodies were: goat anti-rabbit IgG-Cy3 (Jackson Immunoresearch), goat anti-rabbit-FITC (Jackson Immunoresearch), goat anti-mouse IgG2b-FITC (Southern Biotech), goat anti-mouse IgG2b-Cy3 (Jackson Immunoresearch), goat anti-mouse IgG1-FITC (Southern Biotech), goat anti-mouse IgG1-Cy3 (Jackson Immunoresearch) and goat anti-FITC-Alexa 488 (Molecular Probes), all used at 1/100.
Antibodies for activation experiments: mouse IgM CD3 (MEM92, Interchim) at 10 µg/ml, mouse IgG1 anti-CD28 (Affimetrix, eBioscience) 10 µg/ml were used for Jurkat cells. Mouse IgM anti-CD3-biotin (Sigma) at 10 µg/ml, mouse IgG1 anti-CD28-biotin at 10 µg/ml (Sigma) were used for primary human CD4+ T cells. Mouse IgG1 anti-CD3
(UHCT1, Biolegend) 10 µg/ml was used for calcium experiments. Mouse IgM anti-CD3 (MEM92, Interchim) at 10 µg/ml was used for coating coverslips for experiments of pseudosynapses.
Antibodies for mouse lymphocyte staining for flow cytometry analysis: anti-CD45-Alexa Fluor-700 (clone 30-F11, Biolegend) at 1/200, anti-CD4-Brilliant Violet-605 (RM4-5, Biolegend) at 1/200, anti-TCRb-PE-Cy7 (H57-597, Biolegend) at 1/100, anti-Foxp3-APC (clone FJK-16s, eBioscience) at 1/100, anti-Foxp3-PE (clone FJK-16s, eBioscience) at 1/100, anti-IL-17-PerCP-Cy5.5 (TC11-18H10.1, Biolegend) at 1/500, anti-IL-2-PE (JES6-5H4, Biolegend) at 1/300, anti-IL-10-Brilliant Violet-421 (JES5-16E3, Biolegend) at 1/300, anti-RORgt-PE-eFluor610 (clone B2D, eBioscience) at 1/100, anti-Helios-PE (clone 22F6, eBioscience) at 1/33, anti-IFNg-FITC (clone XMG1.2, Biolegend) at 1/500 and anti-IL-4-PE-Dazzle-594 (clone 11B11, Biolegend) at 1/300. Anti-Thy1.1 (clone HIS51, BD Pharmingen) and anti-Thy1.2 (clone 30-H12, eBioscience) at 1/600 were used to discriminate cells in chimeric mice. Additional stainings were performed using anti-c-Myc-PE (clone 9E10, R&D) at 1/20 and rabbit anti-acetyl-α-tubulin (clone D20G3, Cell Signaling) at 1/100 in combination with Zenon Alexa Fluor647 rabbit IgG labeling kit (ThermoFisher Scientific) at 1/200.
Reagents
Colchicine (Sigma) was used at 10 µM for 30 min at 37°C. Streptavidin (Sigma) was used at 10 µg/ml. PMA-Iono experiments: Human cells PMA (phorbol 12-myristate 13-acetate) (Sigma) at 100 ng/ml and calcium ionophore A23187 (Sigma) at 500 ng/ml. Mouse cells: Phorbol 12,13-dibutyrate 500 ng/ml and ionomycin at 500 ng/ml (Tocris Bioscience). Brefeldin A (Sigma-Aldrich) at 500 ng/ml. ProLong Gold Antifade (ThermoFisher) mounting medium. DAPI (Life Sciences).
Methods
Cells, siRNA, cell culture and transfection
Jurkat cells were cultured in RPMI-1640 containing 10% fetal calf serum (FCS). Medium was supplemented with 1 mg/ml G418 (Invitrogen) for SLP-YFP expression. Cell lines were mycoplasma free. For siRNA experiments, small double stranded RNA oligonucleotides targeting APC (siAPC) was 5′-GAG AAU ACG UCC ACA CCU U-3′