HAL Id: inserm-00133031
https://www.hal.inserm.fr/inserm-00133031
Submitted on 26 Feb 2007HAL is a multi-disciplinary open access archive for the deposit and dissemination of sci-entific research documents, whether they are pub-lished or not. The documents may come from teaching and research institutions in France or abroad, or from public or private research centers.
L’archive ouverte pluridisciplinaire HAL, est destinée au dépôt et à la diffusion de documents scientifiques de niveau recherche, publiés ou non, émanant des établissements d’enseignement et de recherche français ou étrangers, des laboratoires publics ou privés.
Quality Evaluation in Medical Visualization: some issues
and a taxonomy of methods
Beatriz Sousa Santos, Jean-Louis Dillenseger
To cite this version:
Beatriz Sousa Santos, Jean-Louis Dillenseger. Quality Evaluation in Medical Visualization: some issues and a taxonomy of methods. Medical Imaging 2005: Visualization, Image-Guided Procedures, and Display;, Apr 2005, San Diego, United States. pp.612-620, �10.1117/12.594549�. �inserm-00133031�
Quality Evaluation in Medical Visualization: some issues and a
taxonomy of methods
Beatriz Sousa Santos
a,b, Jean-Louis Dillenseger
ca
Departamento de Electrónica e Telecomunicações, Universidade de Aveiro, Portugal
bInstituto de Engenharia Electrónica e Telemática de Aveiro, Universidade de Aveiro, Portugal
c
Laboratoire de Traitement du Signal et de l’Image, INSERM, Université de Rennes 1, France
ABSTRACT
Among the several medical imaging stages (acquisition, reconstruction, etc.), visualization is the latest stage on which decision is generally taken. Scientific visualization tools allow to process complex data into a graphical visible and understandable form, the goal being to provide new insight.
If the evaluation of procedures is a crucial issue and a main concern in medicine, paradoxically visualization techniques, predominantly in tri-dimensional imaging, have not been the subject of many evaluation studies. This is perhaps due to the fact that the visualization process integrates the Human Visual and Cognitive Systems, which makes evaluation especially difficult. However, as in medical imaging, the question of quality evaluation of a specific visualization remains a main challenge. While a few studies concerning specific cases have already been published, there is still a great need for definition and systemization of evaluation methodologies.
The goal of our study is to propose such a framework, which makes it possible to take into account all the parameters taking part in the evaluation of a visualization technique.
Concerning the problem of quality evaluation in data visualization in general, and in medical data visualization in particular, three different concepts appear to be fundamental: the type and level of components used to convey to the user the information contained in the data, the type and level at which evaluation can be performed, and the methodologies used to perform such evaluation. We propose a taxonomy involving types of methods that can be used to perform evaluation at different levels.
Keywords: Quantitative Evaluation, Medical Data Visualization, taxonomy
1. INTRODUCTION
The evaluation of procedures is a crucial issue and a main concern in medicine. The same is true for medical imaging, where quality evaluation encompasses all the application domains (diagnostic, planning, intervention, pos-intervention follow-up, etc.), as well as all the stages of imaging (acquisition, reconstruction, segmentation, visualization, etc.). While good accounts on the issues concerning this evaluation can be found 1-5, the main concern has been the evaluation
of diagnosis techniques, in particular, involving the acquisition, reconstruction, segmentation, and interpretation. Yet, visualization techniques, and predominantly in tri-dimensional imaging, have not been the subject matter of much evaluation studies. This is perhaps due to fact that the process of visualization integrates the Human Visual and Cognitive Systems, which makes evaluation especially difficult. Although pioneer work breaking new ground in the evaluation of 3D medical imaging was produced more then fifteen years ago 6, and a some studies have addressed the
quality of 3D visualization of medical data 7-8, this problem, as well as the evaluation in general in medical imaging 9, is
still an open issue and one of the main challenges for the future.
Scientific visualization can be seen as the set of processes to transform complex data into a graphical visible and understandable form, the goal being to provide new insight through visual methods. This research area is leading to quite a lot of visualization methodologies. However, as in medical imaging, the question of the quality evaluation of a specific representation remains one of the main challenges of this research area. Nevertheless, the scientific visualization community seems aware of the importance and need to develop evaluation methodologies, and several
HAL author manuscript inserm-00133031, version 1
HAL author manuscript
panels, workshops, and papers have expressed this concern and put forward some general proposals 10-17. While a few
studies concerning specific cases have already been published, there is still a great need for definition and systemization of evaluation methodologies.
Concerning the problem of quality evaluation in data visualization in general, and in medical data visualization in particular, three different concepts appear to be fundamental: the type and level of components used to convey to the user the information contained in the data (representation of information), the type and level at which evaluation can be performed and the methodologies used to perform such evaluation. In the following sections we will briefly address each of these issues in the scope of the evaluation of visualization techniques, which are central to any visualization process, and propose a taxonomy involving types of evaluation methods that can be used to perform evaluation at different evaluation levels.
2. A MODEL FOR VISUALIZATION AND INFORMATION REPRESENTATION LEVELS A visualization technique is responsible for generating and manipulating a graphic representation from a set of data, allowing investigation through user interaction. Visualization in science, engineering and medicine properly encompasses much more than graphic representation, it involves gaining understanding and insight of the problem solving process and an important point to make is the fact that data fed to a visualization technique is typically sampled from some underlying physical phenomenon which is intended to be visualized and understood, not the data itself. According to Brodlie et al. 18, there are three distinct operations in a visualization technique:
1. the construction of an empirical model from the data that can act as a representation of the physical phenomenon; 2. the selection of some schematic means of depicting the model (mapping);
3. the rendering of the image on a graphics display.
These steps define the basic structure of a visualization technique. The first operation corresponds to the construction of an internal model of the physical entity from the data (for instance, in the case of generating contours from height data, given as a set of scattered points, a continuous function interpolating the data is constructed). This step involves different aspects of mathematics (sampling, interpolation, approximation).
In the second operation, the empirical model is represented as some abstract visualization object*. While several
abstractions can be used, their choice should be made as to learn the most about the underlying phenomenon. This means associating the model with understandable shapes (e.g. a surface). In the last operation, the abstract visualization object is realized as a graphic sequence; the appropriate graphical primitives are generated together with attributes (e.g. specifying how surfaces should be rendered). Finally, the view for the scientist/engineer/doctor is constructed on the display surface.
However, it must not be forgotten that all the mentioned processes involved in the transformation from data to graphics display may introduce error or artifacts not present in the data. This means that:
− great care is always needed to minimize those errors and/or artifacts;
− methods for evaluating error are fundamental in order to achieve the first goal.
We can perhaps conclude that this is, after all, a process similar to many others in engineering where, in order to use models successfully, it is necessary to be able to control the introduced error, i.e. control the approximation.
We believe that the result of each of the three above mentioned operations, involved in any visualization technique, can be considered as three different levels of representation of the phenomenon underlying the data. The first level being the empirical model obtained from the data, the second the schematic means resulting from the chosen mapping (i.e. the abstract visualization object) and the third being the final image rendered on a graphic display.
3. EVALUATION TYPES
Before proceeding, it should be noticed that while we also formulate the question of evaluation in terms of the levels at which it can be performed, these levels should not be confounded with the levels which, according to 2, have gained
* The term “abstract visualization object” is used to describe an object in time and space that is the result of the visualization map, before rendering it
into an image.
acceptance for the hierarchical evaluation in medical imaging and range from the evaluation of the technical efficacy to the efficacy in terms of public health.
When evaluating any visualization technique, in order to obtain a measure its quality, the fundamental question seems to be “how well does the final image represent the underlying phenomenon and helps the scientist/engineer/doctor to understand it?” This question apparently involves two aspects:
A) the evaluation of the representation of the phenomenon by itself (first part of the question).
B) the evaluation of the performance of the user in his task when using the visualization, which implies the understanding of the phenomenon, (second part of the question).
These two aspects correspond to two different evaluation levels (“low level” and “high level”). A great part of the evaluation studies performed in visualization in general 19-29, and in medical imaging 30-36, correspond to a “low level”
evaluation that can be called evaluation of the “technical efficacy”, “intrinsic quality”, or ”technical image quality” as Pommert and Höhne 7 use in the scope of medical volume visualization.
The “high level” evaluation involves assessing the users’ performance at interpretation tasks, which implies an understanding of the underlying phenomena, and thus can be called evaluation of the “semantic efficacy” or, in the scope of medical visualization, “diagnostic image quality”, also according to 7. Some evaluation studies were performed
at this level in visualization 36-39, as well as in medical imaging 6,40-43.
It seems plausible that the evaluation of visualization techniques should be performed at both levels (high and low) for each of the three levels of data representation (1), (2) and (3), mentioned in the previous section. This would result in six different evaluation types, corresponding to the following three pairs of questions:
Hhow well:
A1- does the empirical model approximate the physical phenomenon to be understood? A2- does the abstract visualization object represents the empirical model?
A3- is the visualization object realized through graphic primitives that will produce the final image? And how well does:
B1- the construction of a specific empirical model from the data B2- the selection of a schematic representation shape
B3- the rendered image
help the user to understand the underlying phenomenon (and perform their task) ?
These six different evaluation types seem necessary since evaluations even within the same category (A or B) cannot be performed all at the same level. On the one hand, generally high level evaluation is possible only through human observer studies and low level evaluation can be performed using more objective and quantitative procedures. On the other hand, while this seems to be the case for A1 and A3, more closely related to the “intrinsic quality”, the same doesn’t seem to be true for the low level evaluation of the abstract visualization object (A2). In fact, this second level of representation seems to be the most complex to evaluate, which is due perhaps to the fact that it is the one that gives a larger contribute to the higher level of the fundamental evaluation question. Possibly, the evaluation of this second representation level corresponds to assessing the “semantic quality” of a visualization, i.e., as previously mentioned, some measure of how successful the visualization is in conveying the information contained in the data and thus in helping the user to understand the underlying phenomenon and perform their task.
4. EVALUATION METHODOLOGIES
Evaluating visualization techniques (of data in general and of medical data in particular) confronts researchers with many questions 44-46; however, five fundamental issues that must be precisely defined in order to have an evaluation
methodology are the motivation to perform the evaluation, the type of test data and the kind of methods used, the collected data and the statistical analysis performed in such a study.
1. Motivation
This stage is crucial for several reasons. To begin with, it plays a part in the choice of the precise aspects to evaluate in complex procedures. This is particularly true for visualization since all the components contributing to the final image are widely heterogeneous and must be decomposed and evaluated individually in order to assess their importance in the
general procedure 47. The identification or the isolation of the component determines also the property to be evaluated.
Beyond accuracy and efficiency, which are conventionally evaluated, other features as the precision and repeatability (in interactive techniques) should be evaluated 5,48,49. Furthermore, the motivation should help establish the pertinence of
certain protocols 38. As soon as the evaluation subject is defined, it is necessary to choose the variables (both
independent and independent), as well as the hypothesis.
2. Test data
Basically, two fundamental choices can be made: synthetic or real data 1,3,50, nevertheless, several intermediate types of
data can be used, including synthetic and physical phantoms. Ultimately, the evaluation of a visualization technique should be performed with real data, but it is reasonable to begin by using fully specified and systematically controlled data structures embedded in synthetic data. The use of computer generated data results is flexible and allows the detection of errors and inaccuracies of the visualization technique to be evaluated in a way much easier than using real data. In some applications it may require a lot of modeling and may be only approximated, however it is the only method that allows a complete knowledge of the “ground truth”. Notice that using synthetic data is a way of short-circuiting the error introduced by the first operation in visualization, modeling the underlying phenomenon, since in this situation that phenomenon is completely known. This can be important to perform evaluation at the other representation levels.
No matter what the used test data, these should be clearly defined in order to comply with the needs of reproducibility and verifiability inherent to any scientific endeavor. Moreover, there should be common test data sets widely available to the visualization community, as to allow the comparison among visualization techniques.
3. Evaluation methods
Several alternatives to evaluate the quality of visualizations seem to exist; each being adequate to perform certain types of evaluation (of particular representations and at specific evaluation levels). For reasons that will be presented later, it seems acceptable to consider the possibility of using the following three types of evaluation methods:
- Methods involving human observers: who rate sets of visualizations, allowing the computation of quality measures, as it the case in image quality evaluation 51,52, or ROC studies 53,54;
- Quality indices: widely used in image quality evaluation 55-59, can be obtained directly from some kind of measure that
seem relevant to the quality of the visualization, computed directly from the application of the visualization technique to the data 29;
- Digital observers: that could use models of the Human Visual System (HVS), such as the ones described in 60-62 to
estimate ratings that human observers would attribute to visualizations.
Methods involving observers are perhaps the only ones that allow to assess, in its full extent, the human performance on the evaluation of visualization techniques or on using them to perform a task, since they do not use any model, but the “real system” itself; however they are generally very time consuming, difficult to generalize and usually do not provide an easy way to assess how quality varies with different parameters of the visualization technique 63.
Thus, as it is the case in medical imaging evaluation 64, it should be very interesting to have a digital observer that could,
in some circumstances, substitute for the human observer; its use would have the great advantages of being much faster to apply and less expensive, when compared to the previous methods; yet its applicability would be more limited. Both these types of methods would include the “filtering effect” of the Human Visual System, which is generally most desirable, since all visualizations are meant to be used by a human observer, nevertheless the development of what was called “quality indices” should also be considered, if not for other reasons, at least for the fact that these indices, along with some Human Visual System model, could be the base for the development of “digital observers”.
It should be noticed that methods involving human observers can and should be used to evaluate the performance and validate HVS models, as well as digital observers and that digital observers should be developed based on some adequate quality indices in conjunction with HVS models. Thus, the three types of proposed evaluation methods, along with real and simulated test data, seem to establish an interesting working base to a researcher engaged in the difficult task of developing evaluation methodologies for visualization techniques.
4. Collected Data
These data reflect the dependent variables, however in certain cases the measures represent then only indirectly. It is important to consider the nature of the data (discrete or continuous) and the level of representation (measuring scale) used according to which data can be qualitative (categorical) or quantitative (numerical)65. Categorical data can be
measured solely through nominal or ordinal scales whereas quantitative data can also be measured using interval or ratio scales. The type of data has a direct influence on the statistical methods to be used. Unfortunately, techniques that can only be used with the highest level of representation (e.g. using average and standard deviation) are often misapplied to data that were actually collected using a measuring scale corresponding to a lower representation level (e.g. ordinal data).
5. Statistical Analysis
This last point is critical since in many cases the widely used and well known parametric methods are not applicable. The statistical analysis (good references are 66-68) must be adequate to the type of data (sample size, distribution, nature,
measuring scale, etc), as well as to the type of tasks used in the evaluation. These tasks are generally related to the establishment of statistical hypothesis that will be confirmed or rejected through statistical tests. The choice of the analysis techniques has a great impact on the credibility of the obtained results 69.
5. TAXONOMY FOR EVALUATION METHODS
We present a possible taxonomy of the above described evaluation methods, based on a small number of dimensions that seem adequate to their classification. The adequacy of these evaluation methods to each of the evaluation levels is also addressed.
While we can consider quantitative or qualitative, objective or subjective evaluation methods, it is also possible to have methods that take into consideration the Human Visual System (HVS) and methods that do not. Based on these “dimensions” which seem adequate to the classification of evaluation methods, it is possible to propose a taxonomy. With the purpose of clarifying what are these dimensions, let us define them:
• Qualitative/ Quantitative - related to the type of result yielded by the evaluation method: having a magnitude that can be and is denoted by a numerical expression (quantitative), versus not having (qualitative);
• Subjective/ Objective - related to the way the result is obtained by the evaluation method: through the judgment of human observers (subjective), versus solely from the nature of the data and visualization method, without the intervention of the observer’s judgment (objective);
• Filtered / Not Filtered by the Human Visual System - taking into account the response of the HVS (filtered) versus not taking (not filtered).
It should be noticed that the second and third dimensions must not be confounded; they correspond to different characteristics. An evaluation method may not be subjective in spite of taking into consideration the HVS response; for instance, the methods we have called “digital observers” use models of HVS to compute some results (possibly quantitative albeit it should not be impossible to produce a qualitative result) without the intervention of the judgment of any human observer and thus they are objective evaluation methods.
Another dimension that could be considered in this taxonomy of the proposed methods is related to the type of observer’s perceptual/cognitive processes (of different levels and nature) used in the quality evaluation of visualizations. For instance, if observers were asked to choose from a set of visualizations which one has less noise, jaggies or blur, the type of perceptual/cognitive processes used would be of a different level and nature than when they were asked to give an interpretation of the visualization. These would correspond to evaluate what we could call “visual quality“, and “cognitive quality”, respectively; furthermore the former would be at a lower level than the latter. According to this nomenclature, visual quality would be concerned only with the quality of the image (in the sense which is used in Digital Image Processing), and cognitive quality would be concerned with the information conveyed to the observer by the visualization, concerning the underlying phenomenon. This dimension was included in the taxonomy shown in figure 1, as Visual/ Cognitive, for the sake of completeness; however, due to the complexity of the involved processes, it seems currently exceedingly difficult to develop digital observers to compute predictions concerning “cognitive quality”.
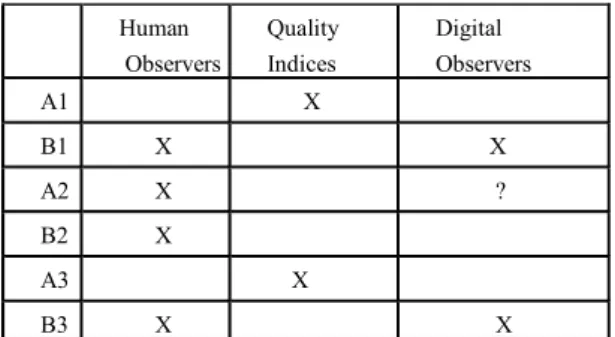
The development of the mentioned methods is expected to involve much research work since no ready to use methods seem to exist currently. Possibly a sensible approach would be to implement first the methods based on human observers, as well as the quality indices, leaving “digital observers” for a later approach, since these methods seem harder to develop (which is due to the complexity of the Human Visual System and consequent complexity of its models). Human Observers Quality Indices Digital Observers A1 X B1 X X A2 X ? B2 X A3 X B3 X X
Figure 1- Taxonomy of evaluation methods (- means not applicable) Figure 2 - Evaluation methods applicable to each evaluation type
Quantit. Subjectiv. HSV filt. Cognitive Qualit. Object. not filt. Visual Methods X X X X Hum. Obs. X X Quality - Indices X X X - Digital X X ? Observers X X X
While we have pointed out several types of methods, it doesn’t seem possible to use all of them in each of the six evaluation types when evaluating a visualization technique.
Evaluation types A1 (corresponding to the question: how well does the empirical model approximates the physical phenomenon?) and A3 (how well is the visualization object realized by graphic primitives that will produce the final image?) seem to be appropriately performed by objective, quantitative, not involving the HVS methods, i.e. methods we would classify as “quality indices” and which would consist in estimating some kind of error.
On the other hand, evaluation types A2 and B2 (corresponding to the questions how well does the abstract visualization object represents the empirical model and helps the user?) apparently can be performed only through methods involving human observers, rating visualizations as in image quality evaluation and using ROC curves, respectively. Theoretically, it could also be performed using “digital observers”, however, as already mentioned, the complexity of the involved cognitive processes and corresponding models, seems to preclude the development of such methods. Finally and systematizing, it can be noticed that evaluation more concerned with what we have called “intrinsic quality” (types A1 and A3) can be performed using quality indices; evaluation more concerned with what we have called “perceived quality” (all other types) can be performed using methods involving observers (either human or digital). While perceived quality has two aspects related with what we have called “visual quality” and “cognitive quality”, the former is more adequately evaluated using methods similar to the ones used in image quality evaluation (ratings obtained using panels of human observers) and the later demanding methods (as ROC curves) which evaluate user performance in executing some task. The evaluation of cognitive quality through digital observers seems out of the question, at least for the moment, due to its complexity.
6. CONCLUSIONS
In this work three concepts that seem to be recurrent whenever thinking of evaluating data visualizations, in medicine, science or engineering, were analyzed. These concepts are: levels of information representation, types of visualization evaluation and evaluation methodologies. Three levels of representation were found; combining those levels with two levels of evaluation, six types of evaluation were defined. To perform all these evaluation types, methodologies are needed. These methodologies involve test data and evaluation methods. Three different types of methods were presented and a taxonomy was proposed. Finally, adequacy of the evaluation methods to the evaluation types was briefly addressed.
While the necessity to develop appropriate evaluation approaches remains a challenge and has a variety of aspects to it that need to be tackled by the visualization community, we believe that efforts in such direction should be more fully embraced and help can be found in the image community in general and the medical image community in particular.
REFERENCES
1. Van Clynenbreugel J., Nuyts, R. Verbeek, M. H. Smet, G. Marchal, P. Suetens, "On the Problem of Validating Computer Assisted Medical Image Interpretation", Contemporary Perspectives in Three-Dimensional Biomedical
Imaging, C. Roux, J.L. Coatrieux (eds.), IOS Press, 1997
2. Buvat I., V. Chameroy, F. Aubry et al., "The need to Develop Guidelines for the Evaluation of Medical Image processing Procedures", Proc. of SPIE 1999, vol.3661, Conf. on Image Proc , San Diego, 1999, pp. 1466-1477 3. Bowyer, K., M. Leow, H. Stiehl, M. Viergever, “Methodology of Evaluation in Medical Image Computing”, Report
of the Dagsthul Seminar 01111, March 2001, http://www.dagstuhl.de/01111/Report (on-line May 2004)
4. Bowyer K. W., "Validation of Medical Image Analysis Techniques", Handbook of Medical Imaging, volume 2:
Medical Image Processing and Analysis, M. Sonka, J. M. Sonka (eds.), chapter 10, 2000, pp. 569-607
5. Jannin, P., J. M. Fitzpatrick, D. Hawkes, X. Pennec, R. Shahidi, M. Vannier, “Validation of Medical Image Processing in Image-Guided Therapy”, IEEE Trans. on Medical Imaging, 21, 12, 2002b, pp. 1445-1449
6. Vannier M. W., T. Pilgram, C. Hildebolt, J. L. Marsh, L. Gilula, "Diagnostic Evaluation of Three Dimensional CT Reconstruction Methods", Proc. Computer Aided Radiology CAR'89, Berlin, 1989, pp. 87-91
7. Pommert, A., K. Höhne, “Evaluation of Image Quality in Medical Volume Visualization: The State of the Art”,
Proc. Medical Image Computer Assisted Intervention MICAI 2002, Part II, Lecture Notes in Computer Science
2489, Springer Verlag, 2003, pp. 598-605
8. Pommert, A., K. Höhne, “Validation of Medical Volume Visualization: A Literature Review”, Proc. Computer
Assisted Radiology and Surgery CARS03, Amsterdam, 2003, pp. 571-576
9. Duncan, J., N. Ayache, “Medical Image Analysis: Progress over Two Decades and the Challenges Ahead”, IEEE
Trans. Pattern Recognition and Machine Intelligence, 22, 1, January 2000, pp.85-106
10. Globus, A., E. Raible, “Fourteen Ways to Say Nothing with Scientific Visualization”, Computer, July 1994, pp. 86-89
11. Uselton, S., G. Dorn, C. Farhat, M. Vannier, K. Esbensen, A. Globus, “Validation, Verification and Evaluation”,
Proc. IEEE Visualization 94, Washington,October 1994, pp. 414-418
12. Globus, A., S. Uselton, “Evaluation of Visualization Software”, NASA Report NAS-95-005, February 1995,
http://www.nas.nasa. gov/Research/Reports/techreports/1995/PDF/nas-95-005.pdf
13. Nielson G., "Challenges in Visualization Research", IEEE Trans. on Visualization and Computer Graphics, 2, 2, 1996, pp. 97-99
14. Rushmeier, H., Barrett, P. Rheingans, S. Uselton, A. Watson, “Perceptual Measures for Effective Visualizations”,
Proc. IEEE/ACM Visualization 97, Phoenix, Arizona, October, 1997, pp 515-517
15. Haase, H., “Mirror, Mirror on the Wall, Who Has the Best Visualization of All?- A Reference Model for Visualization Quality”, Eurographics Workshop on Visualization in Scientific Computing 98, Blaubeuren, Germany, 1998, pp. 117-128
16. Knight, C., “Visualization Effectiveness”, Proc. 2001 International Conference on Imaging Science, Systems and
Technology (CISST2001), Las Vegas, 2001
17. Johnson, C., A. Sanderson, “A Next Step: Visualizing Errors and Uncertainty”, IEEE Computer Graphics &
Applications, 23, 5, September/October, 2003, pp. 6-10
18. Brodlie, K., L. Carpenter, R. Earnshaw, J. Gallop, R. Hubbold, A. Mumford, C. Osland, P. Quarendon, Scientific
Visualization, Techniques and Applications, Springer Verlag, 1992
19. Marschner S. R., R. J. Lobb, "An Evaluation of Reconstruction Filters for Volume Rendering", Proc.
Visualization’94, Washington DC, 1994, pp. 100-107.
20. Möller, T., R. Machiraju, K. Mueller, R. Yagel, “A Comparison of Normal Estimation Schemes”, Proc. IEEE/ACM
Visualization 97, Phoenix, Arizona, October 1997, pp. 19- 26
21. Reinders F., H. Spoelder, F. Post, "Experiment on the Accuracy of feature Extraction", Proc. Eurographics
Workshop Visualization in Scientific Computing’98., Blaubeuren, 1998, pp. 49-58
22. Williams, P., S. Uselton, “Foundations for Measuring Volume Rendering Quality”, NAS-96-021, December 1996,
http://www.nas.nasa.gov/Research/Reports/Techreports/1996/nas-96-021-abstract.html (on line May 2004)
23. Williams, P., S. Uselton, “Metrics and Generation Specifications for Comparing Volume-rendered Images”,
Journal of Visualization and Computer Animation, 10, 1999, pp. 159-178
24. Lindstrom P., G. Turk, "Evaluation of Memoryless Simplification", IEEE Trans. on Visualization and Computer
Graphics, 5, 2, 1999, pp. 98-115.
25. Kwansik, K., C. Wittenbrink, A. Pang, “Maximal Abstract Differences for Computing Direct Volume Rendering Algorithms”, Hewlett Packard Research Lab Technical Report 2000-40,
http://www.hpl.com/techreports/2000/HPL-40.html
26. Meiβner, J. Huang, D. Bartz, K. Mueller, R. Crawfis, “A Practical Evaluation of Popular Volume Rendering Algorithms”, ACM Symposium on Volume Visualization and Graphics, Salt Lake City, 2000, pp. 81-90 27. Meijering, E., W. Niessen, M. Viergever, “Quantitative Evaluation of Convolution-based Methods for Medical
Image Interpolation”, Medical Imaging Analysis, 5, 2001, pp. 111-126
28. Lext J., U. Assarsson, T. Möller, "A Benchmark for Animated Ray Tracing", IEEE Computer Graphics &
Applications, 21, 2, 2001, pp. 221-28
29. Kim, K. C. Wittenbrink, A. Pang, “Extended Specifications and Test Data Sets for Data Level Comparisons of Direct Volume Rendering Algorithms”, IEEE Trans.on Visuualization and Computer Graphics, 7, 4, October-December 2001, pp. 299- 317
30. Tiede U., K.-H. Höhne, M. Boomans, A. Pommert, M. Riemer, G. Wiebecke, "Investigation of Medical 3D Rendering Algorithms", IEEE Computer Graphics & Applications, 10, 2, 1990, pp. 41-53
31. Dillenseger, J.-L., B. Sousa Santos, “Comparison Between Two Three-dimensional Edge Operators Applied in a 3D Navigation Approach”, Proc. Eurographics 98, Lisboa, 1998, pp. 3.7.1, 3.7.2
32. Chalana V., Y. Kim, "A Methodology for Evaluation of Boundary Detection Algorithms on Medical Images", IEEE
Trans. on Medical Imaging, 16, 5, 1997, pp. 642-652.
33. Sun Y., D. L. Parker, "Performance Analysis of Maximum Intensity Projection Algorithm for Display of MRA Images", IEEE trans on Medical Imaging, 18, 12, 1999, pp. 1154-1169
34. Pfister H.-P., B. Lorensen, C. Bajaj, G. Kindlmann, W. Schoeder, L. Sobierajski Avila, K. Martin, R. Machiraju, J. Lee, "The Transfer Function Bake-off", IEEE Computer Graphics & Applications, 21, 3, 2001, pp. 6-22
35. Sousa Santos, B., C. Ferreira, J. S. Silva, A. Silva, L. Teixeira, “Quantitative Evaluation of a Pulmonary Contour Segmentation Algorithm in X-ray CT Images”, Academic Radiology, 11 , 8, 2004, pp. 868-878
36. Healey C. G., J. T. Enns, "Large Datasets at a Glance: Combining Textures and Color in Scientific Visualization",
IEEE Trans. on Visualization and Computer Graphics, 5, 2, 1999, pp. 145-167
37. Rodger J. C., R. A. Browse, "Choosing Rendering Parameters for Effective Communication of 3D Shapes", IEEE
Computer Graphics & Applications, 20, 2, 2000, pp. 20-28.
38. Smallmann H. S., M. St Johns, H. M. Oonk, M. B. Cowen, "Information Availability in 2D and 3D Displays", IEEE
Computer Graphics & Applications, 21, 5, 2001, pp. 51-57
39. Irani P., M. Tingley, C. Ware, "Using Perceptual Syntax to Enhance Semantic Content in Diagrams", IEEE
Computer Graphics & Applications, 21, 5, 2001, pp. 76-85
40. Vannier M., C.F. Hildebolt, L.A. Gilula, et al., "Calcaneal and Pelvic Fractures: Diagnostic Evaluation by Three Dimensional Computed Tomography Scans", Journal of Digital Imaging, 4, 3, 1991, pp. 143-152
41. Levkowitz H., G. T. Herman, "Color Scales for Image Data", IEEE Computer Graphics & Applications, 12, 1, Jan. 1992, pp. 72-80
42. Stanford W., W. E. Erkonnen, M. D. Cassel, B. D. Moran, G. E. Easley, R. L. Carris, M. A. Albanese, "Evaluation of a Computer-Based Program for Teaching Cardiac Anatomy", Investigative Radiology, 29, 2, 1994, pp. 248-252. 43. Jabri K. N., D. L. Wilson, "Human Observer Modelling of Quantitative Image Quality in Temporally Filtered
Image Sequences", Proc. 19th Int. Conf. IEEE/EMBS, Chicago, 1997, pp. 785-787 44. Cochran, W. G., Planning and Analysis of Observational Studies, John Wiley, 1983
45. Dix, A., J. Finley, Abowd G., Russell B., Human Computer Interaction, 3rd Ed., Prentice Hall, 2003
46. Preece, J., Y. Rogers, H. Sharp, D. Benyon, S. Holland, T. Carey, Human Computer Interaction, Addison Wesley, 1994
47. Maeder, A., "Human Understanding Limits in Visualization", International Journal of Pattern Recognition and
Artificial Intelligence, 1997, pp. 229-237.
48. Falcão A., J. K. Udupa, "A 3D Generalization of User-Steered Live Wire Segmentation", Medical Image Analysis, 4, 2000, pp. 389-402.
49. Olabarriaga, S., A. W. Smeulders, “Interaction in the segmentation of medical images: A survey”, Medical Image
Analysis, 5, 2, 2001, 127-142
50. Levkowitz, H., R. Pickett, R. Smith, M. Torpey, “An environment and Studies for Exploring Auditory
Representations of Multi-dimensional Data”, Grinstein, G., H. Levkowitz (eds), Perceptual Issues in Visualization, Springer Verlag, 1995 pp. 47-58
51. Kaukoranta, T., P. Franti, O. Nevalainen, “Empirical Study on Subjective Quality Evaluation of Compressed Images”, Proc. SPIE, vol. 2663, Very High Res. and Quality Imaging, 1996, pp. 88-96
52. Avadhanam, N., R. Algazi, “Prediction and Measure of High Quality in Still Image Coding”, Proc. SPIE, vol. 2663,
Very High Resolution and Quality Imaging, 1996, pp. 100-109
53. Kuendel, H., Evaluating Imaging Technology Using Observer Performance, Tutorial SC357 SPIE Medical Imaging, San Diego, February 2003
54. Selin, Y., Detection Theory, Princeton University Press, Princeton, New Jersey, 1965.
55. Eskicioglu, A., P. Fisher, “Image Quality Measures and Their Performance, IEEE Trans. on Communications, 43, 12, December 1995, pp. 2959-2965
56. Albin, S., G. Rougeron, B. Péroche, A. Trémeau, “Quality Image Metrics for Synthetic Images Based on Perceptual Color Diffrences “, IEEE Trans. on Image Processing, 11, 9, September 2002, pp. 961- 971
57. Avcibas, B. Sankur, K. Sayood, “Statistical Evaluation of Image Quality Measures”, Journal of Electronic Imaging, 11,2, April 2002, pp. 206-223
58. Wang, Z., A. Bovik, “A Universal Image Quality Index”, IEEE Signal Processing Letters, 9, 3, March 2002, pp. 81-84
59. Janssen, R., Computational Image Quality, SPIE Press, 2001
60. Daly, S., “The Visible Differences Predictor: An Algorithm for the Assessment of Image Fidelity”, Digital Images
and Human Vision, A. Watson (ed.), MIT Press, 1993, pp. 179-206
61. Lubin, J., “The Use of Psychophysical Data and Models in the Analysis of Display System Performance”, Digital
Images and Human Vision, A. Watson (ed.), MIT Press, 1993, pp. 163-178
62. Barten, P.G., Contrast Sensitivity of the Human Eye and Its Effects on Image Quality, SPIE Press, 1999
63. Kosara, R., C. Healy, V. Iterrante, D. Laidlaw, C. Ware, “User Studies: Why, How, and When?”, IEEE Computer
Graphics & Applications, 23, 4, July/August 2003, pp. 20-25
64. Barret, H. H., “Objective Evaluation of Image Quality”, 2nd International Summer School in Biomedical Imaging, Berder Island, Brittany, France, June 1996
65. Sharma, S., Applied Multivariate Techniques, John Wiley & Sons, 1996
66. Hoaglin D., F. Mosteller, J. Tukey, Understanding Robust and Exploratory Data Analysis, John Wiley and Sons, 1983
67. Altman, D., Practical Statistics for Medical Research, Chapman & Hall /CRC, 1991 68. Anderson T. W., J. D. Fin, The New Statistical Analysis of Data, Springer, New York, 1996.
69. Marks R. G., E. K. Dawson-Saunders, J. C. Bailar B. B. Dan, J. A. Verran, "Interactions between Statisticians and Biomedical Journal Editors", Statistics in Medicine, 7, 1988, pp. 1003-1011