Publisher’s version / Version de l'éditeur:
Vous avez des questions? Nous pouvons vous aider. Pour communiquer directement avec un auteur, consultez la première page de la revue dans laquelle son article a été publié afin de trouver ses coordonnées. Si vous n’arrivez pas à les repérer, communiquez avec nous à [email protected].
Questions? Contact the NRC Publications Archive team at
[email protected]. If you wish to email the authors directly, please see the first page of the publication for their contact information.
https://publications-cnrc.canada.ca/fra/droits
L’accès à ce site Web et l’utilisation de son contenu sont assujettis aux conditions présentées dans le site LISEZ CES CONDITIONS ATTENTIVEMENT AVANT D’UTILISER CE SITE WEB.
Internal Report (National Research Council of Canada. Institute for Research in Construction), 1996-08-01
READ THESE TERMS AND CONDITIONS CAREFULLY BEFORE USING THIS WEBSITE. https://nrc-publications.canada.ca/eng/copyright
NRC Publications Archive Record / Notice des Archives des publications du CNRC :
https://nrc-publications.canada.ca/eng/view/object/?id=335587d2-38d2-47a9-8f81-7e4ecabde178 https://publications-cnrc.canada.ca/fra/voir/objet/?id=335587d2-38d2-47a9-8f81-7e4ecabde178
NRC Publications Archive
Archives des publications du CNRC
For the publisher’s version, please access the DOI link below./ Pour consulter la version de l’éditeur, utilisez le lien DOI ci-dessous.
https://doi.org/10.4224/20337917
Access and use of this website and the material on it are subject to the Terms and Conditions set forth at Comparison of Some NDT Methods for Determining Concrete Properties
Rainer, J. H.; Marsh, P.; Hoogeveen, T. J.; Pernica, G.; Guan, W.; Hunaidi, O.
National Research Conseil national
institute for lnstitut de Research In recherche en Construction construction
ining Concrete Properties
b . i :> I L ,L (". J ::; I ijt-:.~,) L.,NF<L
lit-,i-:ii\ i.vc?d cji-, :: 0)3
..
1.6-76 iiil:~.i-i.i.3,1 r.ep<-,i,t.by Hains Rainer, Philip Marsh, Ted Hoogeveen, Gerry Pernica, Wei Guan and Osama Al-Hunaidi
Internal Report No. 720
Date of issue: August 1996
This is an internal report of the Institute for Research in Construction. Although not intended for general distribution, it may be cited as a reference in other publications.
COMPARISON OF SOME NDT METHODS FOR DETERMINING
CONCRETE PROPERTIES
Hans Rainer, Philip Marsh, Ted Hoogeveen, Gerry Pernica, Wei Guan and Osama Al-Hunaidi
1. Introduction:
The development of non-destructive (NDT) test methods has made great strides in the last decade. Instruments have been developed that are user-friendly and new techniques have evolved to a point where repeatable results can be expected.
Numerous text books and articles describe the various methods and their applications. When these methods are applied to measure the properties of concrete, however, consistency of results and repeatability has not always been satisfactory. In particular, systematic comparisons among different methods have not been extensive.
The purpose of this series of tests is to compare the test results among four different methods, each based on wave propagation principles through solids. These methods are the ultrasonic-pulse-velocity (UPV) method, the impact-echo (IE) method,
the impulse-response (IR) method, and the Spectrum Analysis of Surface Waves (SASW) method. While each of these methods has it advantages and limitations, enough common characteristics are embodied in each so that some meaningful
comparisons of results should be possible. The theory for these methods can be found in "Handbook for Nondestructive Testing of Concrete", Malhotra, V.M. and Carino, N.J.,
pages 169 and 284.
2. Description of Concrete:
The following describes in detail the pertinent parameters of the concrete
samples:
COMPARISON OF SOME NDT METHODS FOR DETERMINING CONCRETE PROPERTIES
IRC/NRC Canada, Ottawa, August. 1996
2.1
Mix
Design and Strength Properties:I
Parameter2.2 Placement:
The concrete was run through a chute into a bucket which was hoisted to the top of the 2.4 m high forms and the concrete was dropped into the form. Vibration was unnecessary but the concrete was tamped with a piece of 2 x 4 lumber.
2.3 Curing:
The concrete was left in the forms for 3 days. The forms were then stripped and the samples cured in the laboratory.
S11:
The concrete was left in the forms for 2 days before stripping. Thesamples were then cured in the laboratoty for 1 week but subsequently a plastic enclave was placed around the samples and a humidifier installed in order to raise the humidity.
2.4 Freeze-Thaw Test:
S11:
After 28 days of curing, the prisms cast for this batch were placed in thefreeze-thaw cabinet and subjected to 300 cycles of freezing and thawing according to ASTM C666 Procedure A. The prisms passed the test, showing no significant
deterioration or length change after 300 cycles.
COMPARISON OF SOME NDT METHODS FOR DETERMINING CONCRETE PROPERTIES
IRCINRC Csnada. Ottawa, August 1996
3.
Ultrasonic Pulse Velocity and Impact Echo Methods:3.1 Description of samples:
A plan view of samples WSI and S11 are shown in Figures 1 and 2.
Sample "WSI", located outside of Building M20 was tested on May 24, 1996; sample "S11" located inside the structures laboratory of Building M20 was tested on May 30,1996. The latter had been used as a test specimen for strength-enhancing injections at about 20 cm spacings. The test locations for this study were chosen to lie away from these injection points.
Figure 1
COMPARISON OF SOME NDT METHODS FOR DETERMINING CONCRETE PROPERTIES
IRC/NRC Canada. Ottawa, August. 1996
Saw-cut Surface Slab Thickness 0.205111
Figure 2
3.2 Ultrasonic Pulse Velocity
In this method, two ultrasonic transducers are attached to the sample, one acts as a transmitter and the other as a receiver. The travel time of an ultrasonic pulse between the sensors is determined by a processor, called "Pundit", which sends and receives the pulses via the transducers and outputs the travel time in psec.
Before each series of tests, the Pundit was calibrated to 0.1 psec against a standard aluminum bar (26.0 psec).
The transducers (54 kHz sensors, 50 mm diameter) were coupled to the surface of the slabs (slabs WS1 and Sf 1) with Gorptech Ultrasonic coupling gel. The gel was applied to the base of the transducers before each test. The surface of the slab where the tests were performed was scraped with a putty knife to remove major imperfections (i.e. bumps, etc.) to ensure the best possible contact for the transducers.
The measurements through the slabs were done with the transmitter on the top
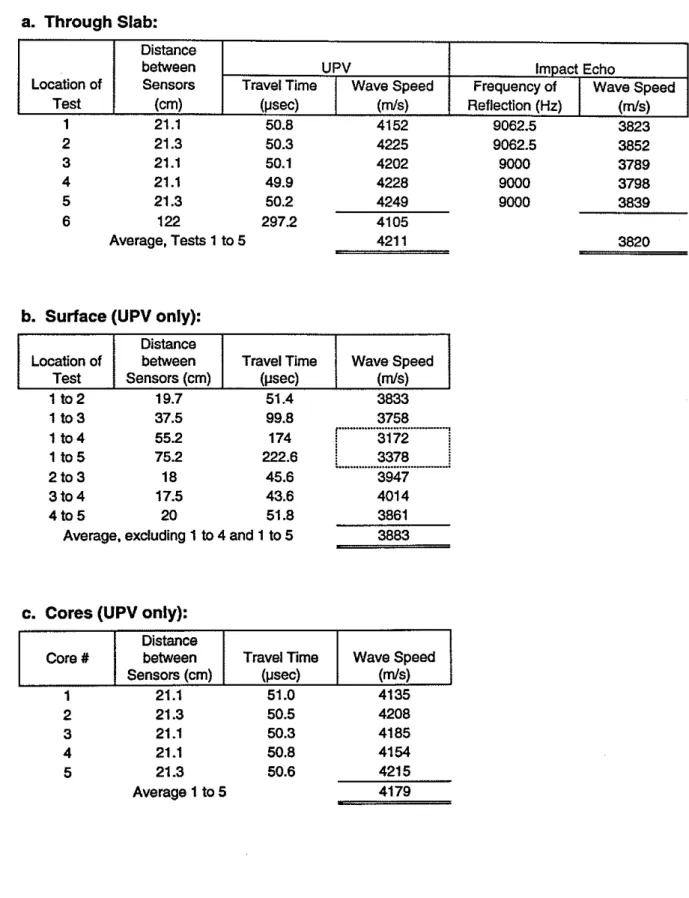
of the slab and repeated at the same locations with the transmitter on the bottom. At each location, the transmitter was moved around slightly to obtain the minimum time and thus to ensure the proper alignment of the two transducers. The results are shown in Table 1 a.
Also surface measurements of wave speed were carried out on sample "WS1" with transducer spacings measured from center to center of the transducers. The results are shown in Table 1 b.
COMPARISON OF SOME NDT METHODS FOR DETERMINING CONCRETE PROPERTIES
IRCrmRC Canada, Ottawa. Augusf. 1996
Thicknesses of the slab were measured with a tape measure as close as
possible to the locations where the measurements were taken, or from the cores taken at these locations.
From the cores taken at the tests locations, UPV and Impact Echo (to be described subsequently) measurements were carried out; the results are shown in Table lc.
3.3 Impact Echo:
In this method, an accelerometer is placed on the surface of the slab to capture the waves generated by the impact of a 112" steel ball adjacent to the accelerometer. The accelerometer was coupled to the surface using petroleum jelly.
The impact echo measurements were carried out at the same locations as the through transmission tests with the Pundit, except no measurement were taken at Location 6 on "WS1" because the 112" ball was too small for this depth of concrete.
Signals were captured with a single channel RlON signal analyzer, then downloaded to a computer and analyzed to obtain Fourier spectra. The results are presented in Figures 3 to 16.
Compression wave propagation speeds were calculated by multiplying the dominant resonant frequency by twice the thickness of the slab. The results are shown in Tables l a and 2a.
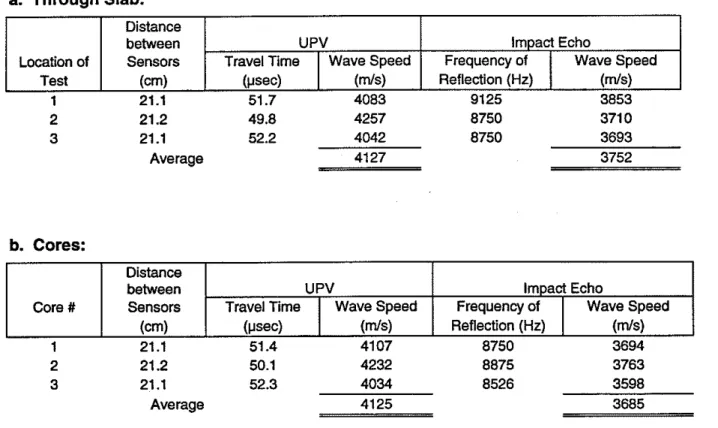
From the cores taken from the slab S11, Impact Echo tests were carried out as described before. The results are shown in Table 2c.
3.4 List of Equipment:
Ultrasonic Pulse Velocity:
"Pundit" C.N.S. Electronics PAM 1 19252
Ultrasonic Transducers #54/8582 & #54/8581 Gorptech Ultrasonic Coupling Gel
COMPARISON OF SOME NDT METHODS FOR DETERMINING CONCRETE PROPERTIES
IRC/NRC Canada, Ottawa, ~ugust. 1996
Im.oact Echo:
Accelerometer PCB 309A SIN 5157
5.34 mVlg
Natural Freq. 120
kHz
Power Supply PCB 480B SIN 742
Signal Analyzer RlON Model SA-77 SIN 0080039
Impactor 112" Steel Ball on Spring Handle Petroleum Jelly
COMPARISON OF SOME NDT METHODS FOR DETERMINING CONCRETE PROPERTIES IRONRC Canada, Ottawa. August 1996
Table 1. Results from Tests on Slab WS1 Average, Tests 1 to 5 a. Through Slab: Location of Test 4 to 5 20 51.8 3861
Average. excluding 1 to 4 and 1 to 5 3883
b. Surface (UPV only):
c. Cores (UPV only):
1 21.1 50.8 4152 9062.5 3823 Distance between Sensors (cm) Location of Test 2 21.3 50.5 4208 3 21.1 50.3 4185 4 21.1 50.8 4154 5 21.3 50.6 421 5 Average 1 to 5
-
4179 1 t o 2 19.7 51.4 3833 1 to3 37.5 99.8 ,...
3758 " 1 t o 4 55.2 174 3172 j 1 to 5 75.2 222.6 i '...
3378i
" 2 to 3 18 45.6 3947 3 to 4 17.5 43.6 401 4 Distance between Sensors (cm) Travel Time (~sec)COMPARISON OF SOME NDT METHODS FOR DETERMINING CONCRETE PROPERTIES I R m R C Canada. Ottawa. August 1996
7 UPV Wave Speed (WS) Core # Travel Time ( V S ~ C ) Impact Echo 1 21.1 51 .O 4135 Travel Time (vsec) Distance between Sensors (cm) Wave Speed (Ws) Frequency of Reflection (Hz) Wave Speed (WS) Wave Speed (Ws)
Table 2. Results from Tests on Slab S11 a. Through Slab: 3 21.1 52.2 4042 8750 3693 Average
-
41 27-
3752 b. Cores: 1 21.1 51.7 4083 9125 3853 Location of Test Impact Echo 3 21.1 52.3 4034 8526 3598 Average 4125 3685 Distance between Sensors (cm) Frequency of Reflection (Hz) UPVCOMPARISON OF SOME NOT METHODS FOR DETERMINING CONCRETE PROPERTIES IRCMRC Canada. Ottawa, August, 1996
8 Wave Speed ( d s ) Travel Time (~sec) Wave Speed ( d s ) 1 21.1 51.4 41 07 8750 3694 2 21.2 50.1 4232 8875 3763 Core # Impact Echo Distance between Sensors (cm) Frequency of Reflection (HZ) . U PV Wave Speed ( d s ) Travel Time ( ~ s e c ) Wave Speed ( d s )
lrnpoct Echo Test on the Bottom of Core #1 of Slob S l 1 2W Time Signoi 1 0 0 -100 Figure 3
Impact Echo Test on the Top of Core # I of Slob 811
I I Time Signol - FFT 30 25 20 1 5 . I 0 r--
.
0 $ 0 ' 5 20 25 30 35 40 15 50 55 BD Figure 4COMPARISON OF SOME NDT METHODS FOR DETERMINING CONCRETE PROPERTIES IRCMRC Canada. Mtawa. August. 1996
I m p a c t Echo Tesf on the Bottom of Core # 2 of Slab S1 1 ZOO 300 -100 2 0 0 1 ( 5 Z 2.5 3 3.5 4 1 . 5 5 5 5 6 6 5 / 7.5 B 8.5 lmsecl
I
FFT Figure 5I m p a c t Echo Test on the Top of Core # 2 of Slob S l l
i 1.5 2 2.5 J 3.5 4 1.5 5 5.5 6 6.5 1 7.5 8 6.5
[msec]
[kHz1
Figure 6
COMPARISON OF SOME NDT METHODS FOR DETERMINING CONCRETE PROPERTIES IRWNRC Canada. Ottawa, August 1996
FFI
-
6"Figure 7
I m p a c t Echo Test an the Top of Core # 3 of Slob 511
100 50 0 -M -100 0 1 2 3 1 5 5 1 B 9 10 1 1 72 13 1 1 1 3 [msecl 1. 39 10 B 20 2 5 50 60 Figure 8
COMPARISON OF SOME NDT METHODS FOR DETERMINING CONCRETE PROPERTIES IRGINRC Canada, Ottawa, August, 1896
Impact Echo Test a t Locotion 1 on Slob 511
200
Figure 9
I r n ~ a c t Echo Test a t Location 2 on Slob 511
m Time Signol
I
o,="z5
/
n
FFTFigure 10
COMPARISON OF SOME NDT METHODS FOR DETERMINING CONCRETE PROPERTIES
IRCNRC Canada. Ottawa, August, 1996
lrnpoct Echo Test a t Locotion 3 o n Slob 511 200 Time Signoi i w - P -100 -200 -300 - 0.75 i 125 1.5 1.75 2 2.25 2.5 2.75 3 5.25 3.5 3.75 1 4.25 4.5 (i 5 10 15 20 25 30 35 40 15 50 55 60 • ,""a > 9 g 6 [kHz1 Figure 11
Test o n Slob Outside near M 2 0 , Locotion 1
[kHz1
Figure 12
COMPARISON OF SOME NDT METHODS FOR DETERMINING CONCRETE PROPERTIES IRCMRC Canada, Ottawa, August, 1996
T e s t on Slab Ouiside near M 2 0 , Location 2
Figure 13
10
Test on Slob Outside near M 2 0 . Location 3
I [meec] 02 - FFT 0 15 - 0 , - - 10 25 10 45 50 55 50 Time sigma, " -20 ( 0 Figure 14 - 2 0 - Time Signal
COMPARISON OF SOME NDT METHODS FOR DETERMINING CONCRETE PROPERTIES IRC/NRC Canada, Ottawa, August, 1996
14
-
-20 -30 2 3 4 5 6 7 B 9 10 l i 12 1 3 14 15 0.75 1.25 1.5 175 2 2.25 2.5 2-75 3 3.25 3.5 3.75 1 4.25 4.5Figure 15
Test on Slab Outside near M20; Location 4
20
10 -
[kHz1
Figure 16
Test on Slab Outside near M 2 0 , Locotion 5
COMPARISON OF SOME NDT METHODS FOR DETERMINING CONCRETE PROPERTIES IRCMRC Canada, Mtawa, August, 1946
15 0 - L -10 -20 - 2 3 1 5 5 7 B 9 30 ii i Z i J 1 1 1 5 [msec] sm0 "I 0.175 0.15 0.125 0.7 0.075 0.05 0.025 15 20 25 30 35 50 55 80 [kHz1 ' 20 T i m e Signal Time Signol
I,
....
4.
Impulse Response
andSASW Tests:
4.1 lmpulse Response:
4.1.1 Method: This method is similar to the impact echo except that the transfer function, rather than only the spectrum of the response, is used to identify the
resonance frequency of the slab thickness. In this way, the input variation in the frequency domain is taken into consideration.
This method is carried out by applying an input at the same location as the
pickup of the response. The input to the test object is applied by using an instrumented hammer that has a force transducer to measure the input force. The response
acceleration is picked up by an accelerometer. The transfer function is defined as:
where H, is the transfer function, Xis the Fourier transfer of input force, Y is the Fourier
transfer of response acceleration, and 'represents the conjugate. The peak frequency,
f,,
in the transfer function indicates the time that the P-wave travels from the impact point to the bottom of the slab and back to the accelerometer at the surface of the slab. The compression velocity V, of the concrete slab is calculated as:v,
= 2f$where t is the thickness of the slab.
4
.
1
.
2
:
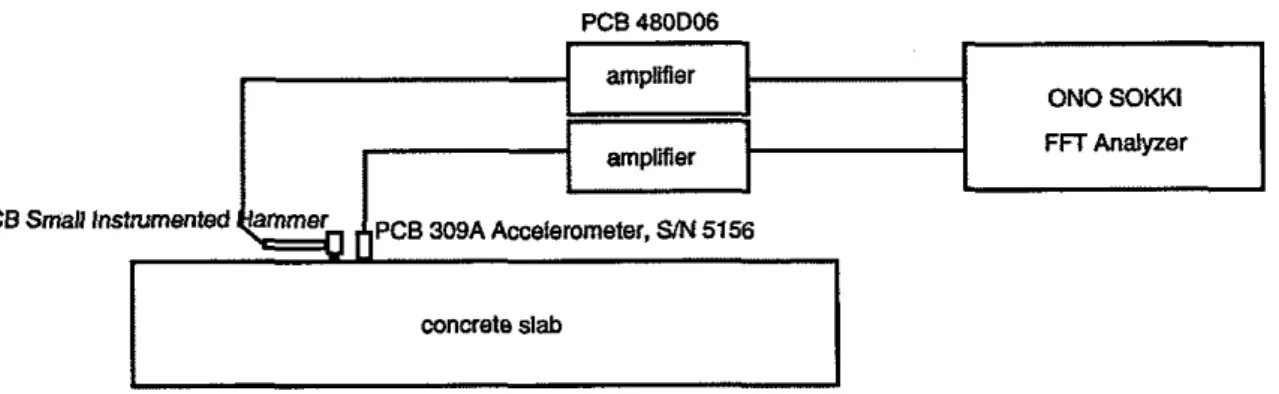
The test was done on May 24,1996 on the concrete slab which was stacked in the campus of NRC, to the north of building M-20 (sample WSI), and on May 29, 1996 on the concrete slab in Structures Lab (sample S11). Themeasurement setup for the test is illustrated in Figure 17.
PCB fnstnrmented PCB 309A Accelerometer, SM 5156
I I
PCB 480D06
concrete slab
I
Figure 17 Measurement Setup of Impulse Response Test
COMPARISON OF SOME NDT METHODS FOR DETERMINING CONCRETE PROPERTIES
IRCMRC Canada. Ottawa. August. 1996
16
ampufier amplfier
ON0 SOKKl
The accelerometer was mounted to the concrete slab directly with Grand & Toy glue stick, at Location 3 as shown in Figure 1. For sample WSl, the impact point was in between Locations 2 and 3, about 1.5 cm from the accelerometer. For sample S11 (Figure 2), the impact points were at Locations 1,2, and 3. A total number of 100 spectra were averaged so that the variation between different impact was minimized. The results are shown in Figures 18a to 18c for test on sample WS1, and Figures 19a to 19c for test on sample S11. The thickness of the slab was measured to be 0.21 1 m for sample WSl at Location 3. For sample S11, the thickness of the slabs is 0.21 1 rn for Location 1, 0.212 m for Location 2, and 0.21 1 m for Location 3. The frequency range used was 0
-
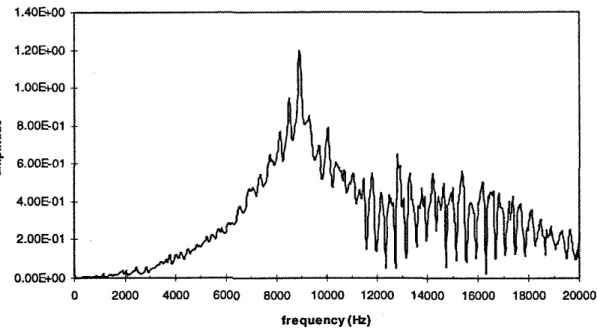
20 kHz.4.1.3 Results: For sample WS1, the transfer function between the input force and response acceleration is given in Figure 18a. The auto spectra of both force and acceleration are also given in Figure 18b and Figure 18c, respectively. The transfer function indicates that the peak happened at frequency 8900 Hz, thus
f,
= 8900 Hz; the compression wave velocity can then be obtained as:<
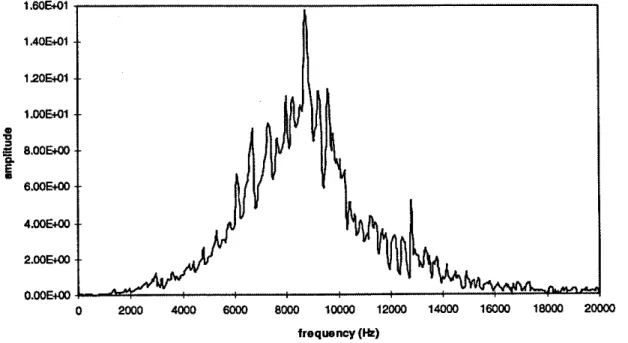
= 2*f, *t = 2'8900'0.2105 = 3747 d sFor sample S11, the transfer functions between the input forces and their
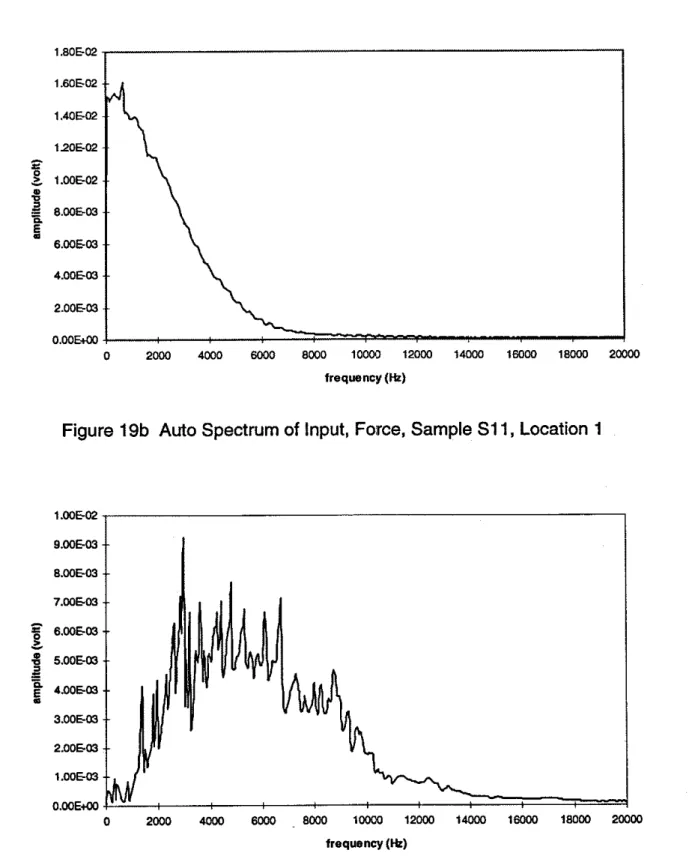
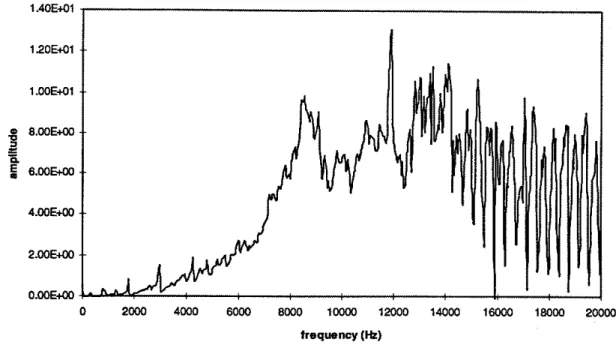
response accelerations are given in Figures 19a, 20a and 21 a for Locations 1,2 and 3, respectively. The auto spectra of both force and acceleration are also given in
Figures 19b, 19c, 20b, 20c, 21 b, and 21c, for Locations 1, 2, and 3, respectively. The transfer functions indicate that the peaks happened at frequencies 8750 Hz, 8550 Hz, and 9200 Hz for Locations 1, 2, and 3, respectively. The compression wave velocities can then be obtained as:
Location 1:
v,
= 2'ct = 2*8750'0.211 = 3693 d s Location 2:v,
= 2"ct = 2*8550R0.212 = 3625 d s Location 3:v,
=
2'Yt = 2'9200*0.2111 = 3884 m/sAverage: 3734 m/s
COMPARISON OF SOME NDT METHODS FOR DETERMINING CONCRETE PROPERTIES
IRC/NRC Canada, Oitaw. August 1996
frequency (Hz)
Figure 18a Frequency Spectrum of Transfer Function, Sample WS1
0 2000 4000 6000 8000 10000 12000 14000 16000 18000 20000
frequency (Hz)
Figure 18b Auto Spectrum of Input, Force, Sample SW1
COMPARISON OF SOME NDT METHODS FOR DETERMINING CONCRETE PROPERTIES
IRUNRC Canada. Ottawa. August. 1996
9.00604 8.OOE-04 7.OOE-04
-
6.OOE-04 9s 5.OOE-04 41 = 5 4.OOE-04 P6
3.ooE-04 2.OOE-04 1 .OOE04 0.ooE+o00 2000 4WO 6000 Boo0 10000 12000 14000 16000 18000 2WOO frequency (Hz)
Figure 18c Auto Spectrum of Response, Acceleration, Sample SW1
Figure 19a Frequency Spectrum of Transfer Function, Sample S11, Location 1
COMPARISON OF SOME NDT METHODS FOR DETERMINING CONCRETE PROPERTIES IRCNRC Canada. Ottawa August 1996
0 2W0 4WO 6000 BWO 10004 12WO 14WO 1M)W 18WO 2WW frequency ( M )
Figure 19b Auto Spectrum of Input, Force, Sample S11, Location 1
r .W&W Q.W&03 8.00&03 7.WE-03
-
6.W&W L 8-
= s.oo&m-
-
4 . o o ~ m * 3.OOE-03 2.ooE-a3 I . w & m O.WE+OU0 2030 4WO 6WO 8WO 1WW 12WO 14WO 1- lWW 20000
frequency (tk)
Figure 19c Auto Spectrum of Response, Acceleration, Sample S11, Location 1
COMPARISON OF SOME NDT METHODS FOR DETERMINING CONCRETE PROPERTIES
IRCMRC Canada, Ottawa. August. 1996
0 2000 4W0 6000 8WO 1WW 12WO 14003 16000 1BOW 20WO frequency (k)
Figure 20a Frequency Spectrum of Transfer Function, Sample S11, Location 2
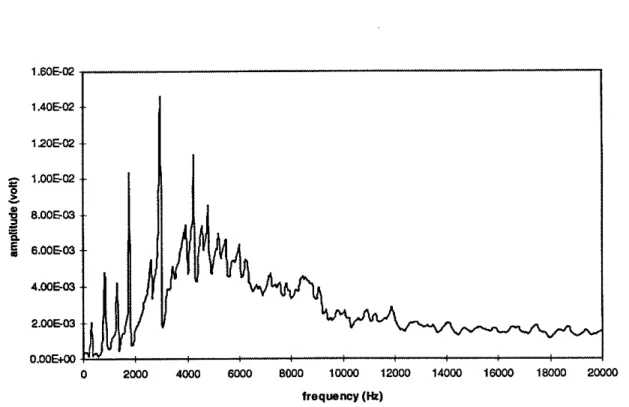
Figure 20b Auto Spectrum of Input, Force, Sample S11, Location 2
COMPARISON OF SOME NDT METHODS FOR DETERMINING CONCRETE PROPERTIES IRCMRC Canada. Mtawa, August. 1996
frequency (tk)
Figure 20c Auto Spectrum of Response, Acceleration, Sample S11, Location 2
Figure 21 a Frequency Spectrum of Transfer Function, Sample S11, Location 3
COMPARISON OF SOME NDT METHODS FOR DETERMINING CONCRETE PROPERTIES IRCINRC Canada. Ottawa. August. 1996
0 2000 4000 60M) 8000 1OWO 12000 1 W 16000 18000 2WM)
frequency ( M )
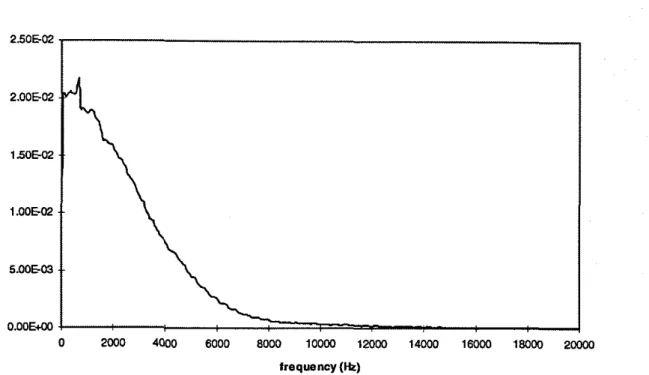
Figure 21 b Auto Spectrum of Input, Force, Sample S11, Location 3
Figure 21c Auto Spectrum of Response, Acceleration, Sample S11, Location 3
COMPARISON OF SOME NDT METHODS FOR DETERMINING CONCRETE PROPERTIES IRCMRC Canada. Ottawa, August. 1996
4.2 Spectrum Analysis of Surface Waves (SASW) Test:
4.2.1 Method: The SASW can be used for evaluating the stiffness gradient of concrete slabs using the dispersion characteristics of surface waves. The SASW method involves the generation of surface Rayleigh waves over a wide range of frequencies usually using an impact device such as hammers or drop weights. Using the dispersion characteristics of surface Rayleigh waves, one can obtain information about the variation of stiffness with depth"].
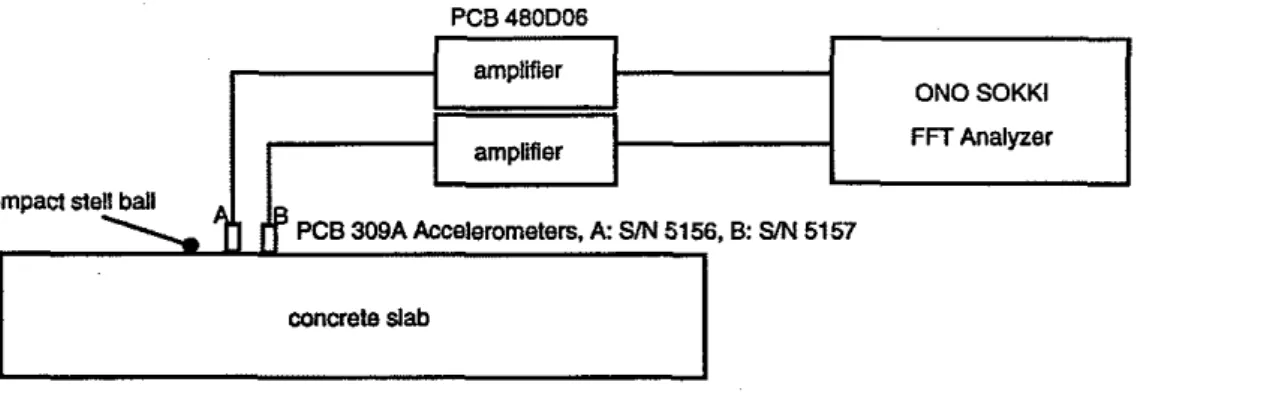
At present, the method has several difficulties in producing reliable stiffness gradient. However, thickness and overall stiffness can be obtained accurately. 4.2.2 Test Procedure: The test was done on May 24, 1996 on the concrete slab sample WS1 stacked to the north of Building M-20 on the campus of NRC. The measurement setup for the test is illustrated in Figure 22.
c@ncrete slab
PCB 480D06
Figure 22 Measurement Setup of SASW Test
amplMer
amplser
For this setup a mechanical impact was applied at the surface of the concrete slab with a steel ball. The resulting vibrations were measured simultaneously at two surface points with accelerometers. Vibrations were then transformed to frequency and the relative phase spectrum was obtained. The thickness of the slab was then found based on the phase spectrum by fitting a straight line on the phase curve.
The accelerometers were mounted directly to the concrete slab with Grand &
Toy glue stick at Locations 3 and 4 as shown in Figure 1. The impact point was at Location 2. The distance between two accelerometers was 0.1 75 m.
Impact stell ball
PCB 309A Accelerometers. A: S/N 5156,B: SM 5157
I
I
-
4.2.3 Results: The phase spectrum between accelerometers A and B is given in Figure 23a, and the coherence in Figure 23b. From the phase curve and fitting
a
straight line it can be calculated that the thickness of the slab WS1 is 0.21 m. This agrees well with the measured thickness of the cores, given in Table lc.
ON0 SOKKl
FFT Analyzer
-
COMPARISON OF SOME NDT METHODS FOR DETERMINING CONCRETE PROPERTIES
IRCINRC Canada. Ottawa. August. 1996
-. .
frequency (Hz)
Figure 23a Phase Spectrum between Accelerometers A and B
COMPARISON OF SOME NDT METHODS FOR DETERMINING CONCRETE PROPERTIES IRUNRC Canada. Ottawa, August 1996
25
frequency (Hz)
Figure 23b Coherence between Accelerometers A and B
1. M.O. Al-Hunaidi. Insights on the SASW Non-Destructive Testing Method.
Canadian Journal of Civil Engineering, Vol.
20,
No. 6, p.940-950,
1993.
COMPARISON OF SOME NDT METHODS FOR DETERMINING CONCRETE PROPERTIES IRCMRC Canada. Ottawa, August 1996
Table 3. Results of Impact Response Test
Sample Location Measured Resonant Freq. Computed Thickness (Hz) Velocity fm) I mlsl WS1 point 3 0.21 1 S11 point I 0.21 1 point 2 0.212 8550 3625
1
S11 point 3 0.21 1 9200 38845. Compression Tests on Cores:
Cores were taken at the locations where Pundit and lmpact Echo tests were conducted on the slabs. A 4" I.D. diamond-studded core bit mounted on a universal core drilling machine was used. Sample cores were wet cut at 350 rpm with an advance rate of 20
-
25 mrnlmin.Core length and diameters were measured. After the appropriate NDT tests were carried out as described before, cores were then capped in accordance with ASTM Standard C617-94 with a lime sulphur capping compound.
Compression tests were performed on the cores in accordance with ASTM
Standard ~ 3 9 - 8 6 . A Riehle hydraulically operated test machine was used at a load rate of 0.25 MPa to load the core samples to failure. The results are shown in Table 4.
COMPARISON OF SOME NDT METHODS FOR OETEFiMlNlNG CONCRETE PROPERTIES
I R m R C Canada. Ottawa. August. 1996
Table 4. Core Strengths for Slabs WS1 and S11
Average 19.42
6. Observations:
6.1 Consistency of Results:
6.1.1 UPV Throuah Slab; The wave speed determined through the slab at
predetermined locations and through the cores taken from the same locations shows great consistency. From Table l a and l c , a point-by-point comparison shows wave speed variations in Slab WS1 between 0.5 and 1.5% of each other. Similarly for slab S l l , Table 2a and 2b show variations between 0.15 and 0.2% among the 5 slab and core measurements.
8.1.2 UPV Surface: Table 1 b shows that the wave speeds for Locations 1 to 4 and 1 to 5 are substantially below the rest of the results. In view of the consistency of the rest of the results these 2 values are not considered reliable. They are associated with the larger distances between the two sensors, which would lead one to deduce that distances beyond about 40 cm do not give consistent results.
6.1.3 l m ~ a c t Echo Throuah Slab: Point-by-point comparisons of results between the slab S11 and the cores taken therefrom, Table 2, show variations between 1.7 and 5%. No comparable results are available for slab WSl and its cores.
For Slab WS1 the variation of IE wave speed among the 5 locations is 0.7%.
COMPARISON OF SOME NDT METHODS FOR DETERMINING CONCRETE PROPERTIES
I R m R C Canada, Ottawa, August 1996
5.1.4 Core Strengths: The strengths of the 5 cores for slab WS1 show great consistency, varying 4% from the highest to the lowest value. For Slab S11 the variation among the 3 samples is substantially larger at about 25%.
6.2 Comparisons Between UPV and Impulse Echo:
A comparison of wave speeds between the impact echo through the slab and UPV, Table la, shows that the impulse echo values are consistently smaller than those from UPV at the same locations. This is also the case for Table 2a and Table 2b. On the other hand, the surface UPV measurements are comparable to those of the impact echo results through the slab. The reasons for this phenomenon have been ascribed to difference in wave lengths for the various methods*.
6.3
Comparison Between Impact Echo and Impulse Responses:The wave speed of 3747 m/s from the impulse response is comparable to the values from the impact echo, presented in Table la. One weak point of the impulse
response method is the limited frequency content of the impact hammer, as shown in Figures 4b, 5b and 6b. This frequency content should be improved, especially for thinner slabs or denser materials, where the frequency peak is expected to be even higher than those investigated here.
6.4 Comparison With SASW Method:
The development of the SASW for applications to slabs is rather new. The SASW thickness determination of 0.21 m being very close to those measured is very promising indeed. Further development of this technique pertaining to concrete slabs is indicated.
6.5 Core Strength Vs.
UPV
and IE:The correlation between core strengths and NDT methods of wave speed is carried out with respect to the surface UPV and the IE only since these two methods give mutually consistent results. As can be seen from Table 1 and Table 4, the
average concrete strength for Slab WS1 of 19.24 MPa can be correlated with an UPV surface wave speed of 3883 m/s or impact echo speed through the slab of 3820 mls, or overall average of 3851 m/s. For Slab S11, while the average strength of 3 samples is slightly higher than for the average of WS1, the variability of the strengths is greater, indicating that Slab S11 is of much less uniform concrete than WSI
.
S11 will therefore not be used to establish a reference value for correlating the strength and wave speed.COMPARISON OF SOME NDT METHODS FOR DETERMINING CONCRETE PROPERTIES
IRCMRC Canada. Ottawa. August. 1996
7. Discussion:
The results of wave speed determinations on slab WS1 indicate that consistent results are obtainable within each of the UPV and IE methods. Since a rather uniform concrete member was being examined, this consistency of results indicates that the method itself gives consistent results. In contrast, Slab S11 was more non-uniform in its strength properties since it had previously been used as a test bed for a strength enhancing injection method that was applied on a grid of drilled holes approximately at 20 x 20 cm. However, this injection material had not penetrated deeply from the drilled holes and thus it was felt that some useful results for this comparison study could still be obtained. But clearly, the sample S11 is much more variable than WS1 and the various wave speed determinations and the strength results confirm this. From the comparisons of results from these two test slabs it is clear that measured variations of wave speed within any given method are the result of real material variations and not a peculiarity or variability of the test method.
7.1 Reference:
2. Olson, L.D., Sack, D.A., and Phelps, G.C. Sonic NDE of Bridges and Other Concrete Structures. Proceedings, Conference on Nondestructive Evaluation of Civil Structures and Materials, Boulder, Colorado, May 11- 13, 1992, p. 279-288.
8. Conclusions:
These NDT tests have demonstrated that consistent wave speeds can be
obtained by the UPV and IE methods in uniform samples of concrete. One limitation for surface UPV measurements that needs to be taken into account is the maximum
distance between the two probes. The limitation of this distance needs to be checked by way of calibration exercises and subsequently heeded. There is good correlation between UPV surface measurements, IE through the slab measurements and impulse response measurements. These values, however, are consistently lower than the UPV through the slab or through the core measurements.
COMPARISON OF SOME NDT METHODS FOR DETERMINING CONCRETE PROPERTIES
IRCMRC Canada. Ottawa, August 1996