Publisher’s version / Version de l'éditeur:
Vous avez des questions? Nous pouvons vous aider. Pour communiquer directement avec un auteur, consultez la première page de la revue dans laquelle son article a été publié afin de trouver ses coordonnées. Si vous n’arrivez pas à les repérer, communiquez avec nous à [email protected].
Questions? Contact the NRC Publications Archive team at
[email protected]. If you wish to email the authors directly, please see the first page of the publication for their contact information.
https://publications-cnrc.canada.ca/fra/droits
L’accès à ce site Web et l’utilisation de son contenu sont assujettis aux conditions présentées dans le site LISEZ CES CONDITIONS ATTENTIVEMENT AVANT D’UTILISER CE SITE WEB.
CIT2000 (Construction Information Technology) [Proceedings], 2, pp. 983-995, 2000-07-01
READ THESE TERMS AND CONDITIONS CAREFULLY BEFORE USING THIS WEBSITE.
https://nrc-publications.canada.ca/eng/copyright
NRC Publications Archive Record / Notice des Archives des publications du CNRC :
https://nrc-publications.canada.ca/eng/view/object/?id=5d11a10d-c653-4393-b235-10d7f2faab7d https://publications-cnrc.canada.ca/fra/voir/objet/?id=5d11a10d-c653-4393-b235-10d7f2faab7d
Archives des publications du CNRC
This publication could be one of several versions: author’s original, accepted manuscript or the publisher’s version. / La version de cette publication peut être l’une des suivantes : la version prépublication de l’auteur, la version acceptée du manuscrit ou la version de l’éditeur.
Access and use of this website and the material on it are subject to the Terms and Conditions set forth at
Whole life building management: occupancy to dismantling Vanier, D. J.
Whole Life Building Management: Occupancy to Dismantling
Dana J. Vanier
National Research Council Canada, Institute for Research in Construction
Abstract
The CIB W78 Workshop on Service Life and Asset Management, as part of the 8th International Conference on the Durability of Building Materials and Components (8DBMC), was held in Vancouver in June 1998. Three "IT Futures" charettes, consisting of day-long intense discussion on a discrete topic, were held in conjunction with the technical presentations; one dealt with the research needs for "Whole Life Building Management". At that time, this charette team decided that further investigation was warranted. This paper is the result of that initial and subsequent work.
The paper stresses the importance of formalized information storage and flow in "Whole Life Building Management". The scope of this domain includes all data, knowledge and information required for managing a building from occupancy to dismantling. The key aspects of the information storage and flow identified during the charette were: (1) the data needs of decision support tools, (2) the development of quality metrics for evaluation; (3) the need for standardization of data and information flow; (4) the strong relationship of whole life management to the concept of intelligent buildings, and (5) the need for continuous data transfer amongst actors in the process. The charette also identified that further research and standardization efforts were required.
“Whole Life Building Management” comprises a significant portion of the funds expended on construction each year. Investigation of the field to date has found a limited number of applications for decision-support in this domain, and did not find any comprehensive solution that addresses the current and future needs for tactical and strategic planning by facility engineers and managers.
This paper is exploratory in nature and encourages the reader to visualize what data might be required for “Whole Life Building Management” and how those data can be used. The paper identifies potential areas of research in the following summary: (1) IT frameworks are required to support storage and flow of data from source to user; (2) data are required to support asset management functions; (3) repository frameworks are needed for large amount of unstructured data; (4) robust systems are required to meet all demands from a wide selection of users; (5) these data must be integrated with service life prediction tools, and (6) industry has to be able to reach a high level of data integration to support clients' needs.
Keywords: asset management, whole life management, life cycle analysis, information
Résumé
Ce document souligne l’importance du stockage et du cheminement officialisés de l’information dans la gestion des bâtiments, à tous les stades. Cela englobe toutes les données, connaissances et informations nécessaires pour gérer les bâtiments, de l’occupation à la démolition ou déconstruction. Les principaux aspects du stockage et du cheminement de l’information qui ont été mis en évidence lors de la charette sont : 1) la nécessité de disposer de données comme outils d’aide à la décision, 2) l’élaboration de mesures de qualité aux fins d’évaluation, 3) le besoin de normalisation en matière de cheminement des données et de l’information, 4) l’étroite relation entre la gestion à tous les stades et le concept de bâtiment intelligent, 5) la nécessité d’un échange continu de données entre les participants au processus. On a aussi souligné le besoin de recherches plus poussées et de plus grands efforts de normalisation. Ce document, qui constitue une exploration du sujet, incite le lecteur à s’interroger sur les données qui permettraient de gérer les bâtiments à tous les stades, ainsi que sur la façon de s’en servir.
1 Introduction
The CIB W78 Workshop on Service Life and Asset Management was held in Vancouver in June 1999 (Lacasse and Vanier, 1999). Many of the workshop delegates were introduced to the concept of an architectural "charette" at this gathering. A charette attempts to develop a solution to a problem using intense interactions among a pool of complementary experts in a short time frame.
The topics for discussion were selected by the general assembly of the 8DBMC Conference and each charette consisted of a one-day intensive problem-solving exercise. One charette discussed product modeling while another focused on process modeling. The charette to be discussed in this paper deals with information technology (IT) needs for life cycle analysis.
The charette participants subsequently selected "Whole Life Building Management" as its theme. The theme was selected to represent the widest variety of names to describe this domain including: life cycle analysis, asset management, facilities management, automated buildings, and property management. “Whole life” was selected as a descriptor to indicate that the theme was more than just life cycle economics. “Building management” was selected in the theme as the discussions should not concentrate solely on maintenance or facilities management but should involve the entire, long-term operational, tactical and strategic management of the building (Gordon and Shore, 1998).
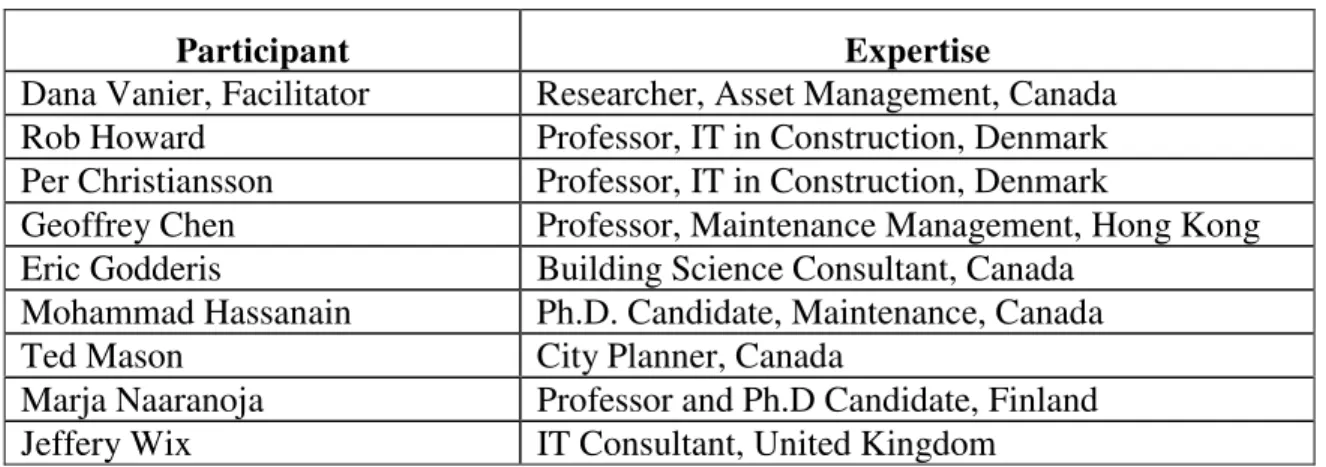
All participants volunteered for a specific charette owning to their related expertise in that domain. The participants in "Whole Life Building Management" charette included the following diverse set of experts shown in Table 1.
Table 1: Charette Teams and Expertise
Participant Expertise
Dana Vanier, Facilitator Researcher, Asset Management, Canada Rob Howard Professor, IT in Construction, Denmark Per Christiansson Professor, IT in Construction, Denmark
Geoffrey Chen Professor, Maintenance Management, Hong Kong Eric Godderis Building Science Consultant, Canada
Mohammad Hassanain Ph.D. Candidate, Maintenance, Canada Ted Mason City Planner, Canada
Marja Naaranoja Professor and Ph.D Candidate, Finland Jeffery Wix IT Consultant, United Kingdom
The results of the three charettes were presented to the Plenary Session of the 8DBMC Conference on June 7, 1999. The scope of “Whole Life Building Management”, as defined by the charette participants, includes all data, knowledge and information needed for managing a building from occupancy to dismantling. The key aspects of “Whole Life Building Management”, as identified during the charette, were: (1) the data needs of decision support tools, (2) the development of quality metrics for evaluation; (3) the need for standardization of data and information flow; (4) the strong relationship of whole life management to the concept of intelligent buildings, and (5) the need for continuous data transfer amongst actors in the process. The charette also identified that further research and standardization efforts were required. The rankings are shown in Table 2.
Table 2: Charette Facets and Rankings
Facet Score
Data for decision support 9 Quality metrics 6 Standards (need for) 6 Intelligent Buildings 5
Data Transfer 4
Research Needs. 4
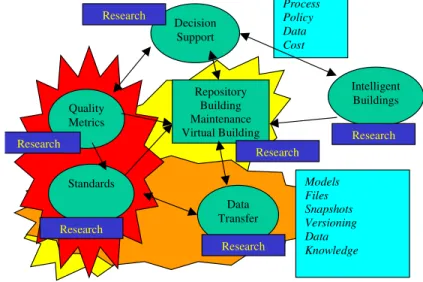
Figure 1 illustrates the thinking of the charette team at the time of the presentation. It displays the need for (1) a “virtual building” as a data repository for all contributing parties; (2) the development of standards for data collection, data storage and for data transfer, and (3) the need for metrics for evaluating quality and performance for building components and systems. Figure 1 also illustrates the close connection between the concepts of the intelligent building and the asset managers’ decision support software.
Process Policy Data Cost Decision Support Quality Metrics Standards Data Transfer Intelligent Buildings Repository Building Maintenance Virtual Building Models Files Snapshots Versioning Data Knowledge Research Research Research Research Research Research
Figure 1: Charette’s View of “Whole Life Building Management”
It was decided at that time by the charette team that further investigation into “Whole Life Building Management” was warranted and that the team should collaborate on finalizing the charette findings in a technical paper at a subsequent forum. This paper is the result of the charette and of subsequent work by the author. The paper recommends research and development to create, test and standardize frameworks for the integration of information technology (IT) in the field of service life and asset management.
2 Background
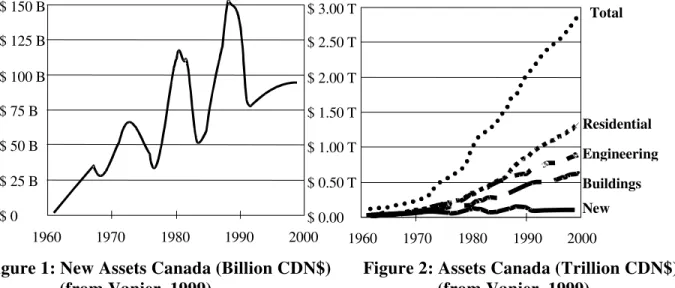
For decades the construction IT research community has focused primarily on design and construction whereas little attention was being devoted to the problems of the "built environment". However, organizations in developed countries such as Canada now have to manage considerable portfolios of assets, as a result of forty years of asset growth, as displayed in current dollars in Figures 1 and 2.
$ 0 $ 25 B $ 50 B $ 75 B $ 100 B $ 125 B $ 150 B 1960 1970 1980 1990 2000 1960 1970 1980 1990 2000 $ 0.00 $ 0.50 T $ 1.00 T $ 1.50 T $ 2.00 T $ 2.50 T $ 3.00 T New Buildings Engineering Residential Total
Figure 1: New Assets Canada (Billion CDN$) Figure 2: Assets Canada (Trillion CDN$)
(from Vanier, 1999) (from Vanier, 1999)
These profiles are representative of countries such as USA and Australia that all experienced significant post-World War II population growth and also experienced the subsequent need for places of employment, housing, and institutions.
As a result of such rapid population growth, Canada, for example (Vanier, 1999), now has an established “built environment” of buildings and infrastructure with a value of more than US$1.97 Trillion (CDN$ equals US$ 0.67 and CDN$ equals 0.67 ECU). A rough ten-fold multiplication (based on the population ratio between Canada and the USA) could estimate the value of the USA “built environment” at US$20 Trillion. Based on comparable population numbers from Australia, these three countries alone could have over US$ 25 Trillion in built assets. The operation, maintenance, repair, and eventual renewal of this "built environment" represent a major, and rapidly growing, cost to the countries’ citizens. In addition, these three economies are continuing to grow at rates comparable to the highest in the past four decades (approximately 3%), implying that the amount of assets could double in twenty years.
Who is going to pay for the maintenance management of this “built environment”? The recent announcements of infrastructure renewal programs in both the USA and Canada are an indication that politicians (and voters) are concerned with the rapidly deteriorating infrastructure; however the proposed remedies may be orders of magnitude too small for the situation. The amount of deferred maintenance in some industry sectors is staggering. A "survey of U.S. higher education facilities conditions issued by the Association of Higher Education Facilities Officers (APPA) concluded that there's a backlog of $26 billion in deferred maintenance, up 27 percent from 1988 estimates" (APPA). The equivalent number for Canada has been reported at CDN$3.6 Billion. In the hospital sector in the USA, there is deferred maintenance equaling 20% of the Capital Replacement Value (CRV), of which 6.7% is deemed urgent (Sawyers, 1997).
2.1 Whole Life Building Management
In essence, “Whole Life Building Management” can be subsumed in the rapidly evolving field of "asset management" (Vanier, 1999; McElroy, 1999). The author has selected the term Service Life Asset Management or SLAM to represent this entire domain because of: (1) the close relationships of building stock to infrastructure assets with regards to materials, service life and maintenance; (2) the proliferation of and confusion amongst terms in this domain (e.g. facility
management, property management, life cycle analysis, life cycle assessment, asset maintenance and building management), and (3) the importance of accurately calculating the service life of components and systems when evaluating their costs, suitability, and functionality (Lacasse and Vanier, 1999).
2.2 Asset Management
Asset management has been described by Vanier (1999) as six "Whats": (1) what do you own; (2) what is it worth; (3) what is its condition; (4) what is the deferred maintenance; (5) what is the remaining service life, and (6) what do you fix first? Each of these “Whats” (these are described in the next section) have their own data requirements.
Asset managers are also responsible for a significant portion of the funds expended each year in the construction industry (Vanier, 1999). As a result asset managers should repeatedly ask themselves if they are managing their properties in the most efficient manner over the service life of the facilities. Unfortunately, investigation of the field to date has found that there are a limited number of techniques for decision-support in this domain and did not find any comprehensive solution addressing the current and future needs for tactical and strategic planning by facility engineers and managers (Vanier, 1999; Yu et al, 2000).
Buildings and infrastructure have long service lives and the asset managers must make decisions in three conflicting planning windows mentioned earlier: operational, tactical and strategic (Gordon and Shore, 1998). The term “conflicting’ is used to identify a significant dilemma for managing structures over a 100 year horizon. Operational planning deals with the upcoming two-year window for an asset: it includes short-term maintenance and management responsibilities. Tactical planning looks at the two to five year time frame and the intermediate needs of the organization. Whereas strategic asset management views an asset as a strategic tool of the organization in the five to twenty year horizon. These three conflicting planning horizons make efficient planning for any asset is demanding task.
To plan any maintenance, repair or renewal work, or to plan any remodeling tasks, asset managers need significant amounts of data to make proper decisions. As can be imagined, modelling, maintaining and using the required data for the asset management domain can be complex, intensive and confusing; in addition, these data must a wide selection of decision support tools that will be developed in the future.
2.3 IT and the SLAM Dilemma
Superficially, SLAM appears to have little to do with the current construction IT research topics identified in recent CIB W78 Workshops (Lacasse and Vanier, 1999), such as 3D or 4D CAD, virtual reality, process modeling, expert systems, product modeling or computer integrated construction. However, all of these sources of data, information and knowledge are required by the asset managers, and therefore the aforementioned IT technologies must be accessible to those dealing with the service life and asset management of the “built environment”.
The author believes that too many decades have passed where the construction industry has been “design-centric”. It is the author’s opinion that this is a result of the necessity for “micro-expediencies” of the post war construction boom (i.e. getting the job done), rather than “multi-facetted, macro-efficiencies” required by today’s strategic planners (i.e. keeping things working). But the research community and their clients should ask a few questions regarding the design and construction: Who is the customer? Who is paying for the design? Who needs the plans?
Who will be encumbered with high life cycle costs? Who has the long-term strategic needs? The answer, of course, is asset owners and their representatives, the asset managers.
3 SLAM and data requirements
This paper is exploratory in nature and the author encourages the reader to visualize what data are required for service life asset management and how those data can be used. It is not the intention of this dissertation to identify potential solutions, but only identify foreseeable problems.
Computers and the Internet will dramatically change how the construction industry operates in the next few years. Technologies such as e-commerce, wireless communications, fibre-optics and the information superhighway, to name a few, will alter respectively our business practices, conventional construction processes, information flows, data collection and technology transfer. Once these technologies are in common usage in other industries the construction industry will have to follow this lead.
One must imagine the scenario where all data are passed electronically and all records are in electronic form whether they are graphical or textual, preliminary or final, sound or video, or anecdotal information or legal texts. This scenario could be envisioned in two to four years in the future or a decade at most. However, there are few standards, techniques and methods in place in the construction industry to handle a completely digital world. Currently, IT standardization, such as STEP (STEP, 2000) or IAI (IAI, 2000), are in the developmental stage (Vanier, 1998) and rarely look beyond the design phase (IAI FM, 2000) or the researchers are looking at a specific type of information such as construction documentation (Rezgui and Cooper, 1998). These problems have already been identified by other researchers (Yu et al, 2000.
In order to present a case for a SLAM IT framework the potential modelling, maintenance and usage for data are identified in terms of the six “Whats”, mentioned earlier. The numerical sequencing of these “Whats” should also be used for any sequencing of SLAM automation; that is, asset managers need models that address the first “What” before they need the subsequent ones.
3.1 What do you own?
This is the first level for the SLAM IT framework, and it is, in the author’s opinion, probably the most difficult to model. This is because of the large number of existing information formats that are currently available, both in hard copy and electronic format. Basically, this level for the SLAM IT framework is best described as an inventory system, and that inventory may alternatively consist of paper drawings or CAD drawings, foam core mockups or 3D models, paper files or document management system records, project letters or emails, photos or jpeg images and video tapes or .mov clips. In addition, there is the age-old construction nemesis of data currency and versioning: design drawings or as-builts.
In fact, the asset manager needs access to most, if not all, information that was used to construct a facility. After all, a building is not a production car that comes with an owner’s manual. The asset, whatever its age, will eventually be refurbished or renewed and detailed design and construction information will be required to implement those changes in the most economical fashion. Therefore, a “virtual building”, described earlier, is needed as a repository for all the existing data.
The type of data currently available to asset managers will change dramatically in the future. Currently, plans and manual records are the major type reference information available to the asset manager, in the future these will be entirely in electronic form. One must not forget to store also the applicable version of the building, fire and plumbing codes in use at the time of construction. To be more specific, in the roofing industry of the future, where the author’s expertise lies (Vanier, 1999), technologies such as wireless moisture sensors, LANDSAT infrared imaging, digital photography and miniaturized weather stations will dramatically increase the volume of useable data to decision makers, while inundating them with megabytes of useless noise.
Where are the current IT frameworks to support storage of this information as well as the framework for the intelligent flow of data from source to user?
3.2 What is it worth?
This is a second level for the SLAM IT framework. As a simple example of the depth of information required for an asset management decision, we can look at the “cost” attribute, a seemingly simple relationship. On the contrary, six terms are used currently in asset management to describe the “worth” of an asset. The historical cost is the original “book value” of the asset. The appreciated historical cost of an asset is the historical cost calculated in current dollars, taking into account annual inflation or deflation. The capital replacement cost is the cost of replacing an asset today. The “performance in use” value is the prescribed value of the actual asset for the user (Lemer, 1998). The deprival cost is the "the cost avoided as a result of having control of an asset" (ANAO, 1996, p. 68). The market value is the value of the property if it were sold on the open market today. One can take the simple view of the cost of an asset to be yet another field of data on the asset record; however, the calculation and the recording of that value or cost is neither simple nor straightforward.
Typically, large organizations store the historical “cost” of assets and can bring this cost forward to present dollars using well-known building economic principles (ASTM E917, 1994), or they calculate the replacement cost based on the area, volume or length of a system or component. They can even integrate these two numbers with the cost of annual maintenance and the forecast costs of capital renewal. However, they do not have the “value” of those assets, but only the cost; and as such, may be skewing their decision-making in favour of assets that have a higher cost and not a higher value to the users.
Typically, asset managers require both value and cost to make educated decisions. Normally these numbers are impossible to find in the proliferation of electronic records and the variety of manual systems. For example in the case of a simple re-roofing project, the asset manager may want to know the original cost (for comparison), the annual maintenance costs (for projections), and the life cycle costs of a specific type of membrane and insulation system (to compare them to a proposed configuration that is more expensive but could have a longer service life and a higher reliability). In this case, the asset manager needs access to both value and cost of the asset.
Again, where can this information be found and how can the asset managers quickly and easily access it?
3.3 What is its condition?
This is a middle level for the SLAM IT framework and the data requirements are becoming more complex and more detailed. The inventory system, described in the first level holds the size,
location, and as-constructed information on the systems and the components, and this can now be amalgamated with the cost information from the second level. Unfortunately, few existing computerized maintenance management systems (CMMS) record actual condition information alongside the inventory data. At an extra cost, your CMMS supplier will gladly develop a condition rating module for you, typically only trouble call information, preventive maintenance inspections, and breakage reports form the information base for the condition of a system or component. Condition information is normally found in complementary databases such as an engineering management system (EMS).
In asset management, there are two types of metrics for rating the condition of a system or component, namely the technical condition index (Shahin et al, 1987) and the facility condition index or FCI (NACUBO, 1990). The FCI is described in the following section.
An Engineered Management Systems or EMS provides a systematic, repeatable and objective metric by which to rank the technical condition of a building system or component (Shahin et al, 1987). Unfortunately, there are relatively few domains where the exhaustive research required to develop the necessary metrics has taken place; for example only MicroROOFER, MicroPAVER and MicroBUILDER now exist currently.
The EMS condition data are normally acquired through visual observations or non-destructive testing. In the case of roofing systems, the physical distresses are classified, counted and measured; from these data a condition rating from 0 to 100 can be calculated (Shahin et al, 1987). Typically, the data are stored in a relational database that hosts both the inventory data about the component, along with the condition information and the relevant repair and costing data. Again, integration with existing inventory databases and corporate legacy systems is difficult to accomplish. In addition, there is also the possibility for a duplication of the inventory data and potential conflicts of data.
Automated data collection increases the amount of data, as well as the frequency of observation, and may inundate the asset manager with data, while provide little useful information. On-line monitoring of the condition using remote sensors, cell phone connections and Internet TCP/IP protocols are becoming more commonplace and less expensive. As in the case above, the asset manager may be collecting more data than can be processed. These problems, however, can be minimized, and the amount of stored data can be reduced through the use of neural networks, expert systems and artificial intelligence.
Are there repository frameworks for this large amount of unstructured data? 3.4 What is the deferred maintenance?
This is another middle level for the SLAM IT framework –where relational database technology can store the necessary information. Computerized maintenance management systems (CMMS) record the inventory data, sometimes alongside the trouble call and word order information, and sometimes integrate to the preventive maintenance inspection results. The organizations’ financial information management system (FIMS) stores the labour costs. The CAD system holds the geometry data, and that responsibility might be shared with the geographical information system (GIS). These shared and overlapping responsibilities illustrate the typical integration problem at this level of SLAM IT framework, for all these sources are required to calculate the deferred maintenance.
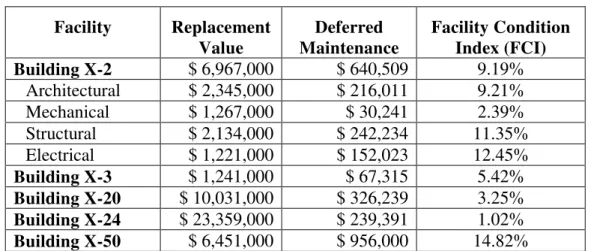
The amount of deferred maintenance in any corporate portfolio can be calculated using these data, as shown in Table 3. The facility condition index (FCI) provides a general impression of the overall state of the individual facilities (NACUBO, 1990), as shown in Table 3. The higher FCI indicates a worsening relative state of the facility. More granular data on specific disciplines can also be displayed if available, as in the example for Building X-2 in Table 3.
This example illustrates some of the problems at this level of SLAM IT; - a number of engineering and financial applications are required to produce the numbers required to prioritize work.
Table 3: Deferred Maintenance Facility Replacement Value Deferred Maintenance Facility Condition Index (FCI) Building X-2 $ 6,967,000 $ 640,509 9.19% Architectural $ 2,345,000 $ 216,011 9.21% Mechanical $ 1,267,000 $ 30,241 2.39% Structural $ 2,134,000 $ 242,234 11.35% Electrical $ 1,221,000 $ 152,023 12.45% Building X-3 $ 1,241,000 $ 67,315 5.42% Building X-20 $ 10,031,000 $ 326,239 3.25% Building X-24 $ 23,359,000 $ 239,391 1.02% Building X-50 $ 6,451,000 $ 956,000 14.82%
In the future, the data integration will be more complex. EMSs, such as MicroROOFER (Shahin et al, 1987) could trigger the creation of work orders when the condition index falls below a pre-established performance metric. Intelligent sensors could also relay condition information to the central repository to trigger inspection or repair. In fact, these data identifying failure or defects should be correlated with the graphical data stored in the CAD system, product model or 3D visualization tool to illustrate visually the location and extent of damage.
How can the SLAM IT framework manage these data while integrating between different applications? There is also the problem that the data might reside on potentially different operating systems, owing to the requirement to integrate with corporate legacy financial systems. In addition, each and every organization must be considered unique, because each organization has evolved independently of others. This implies that each organization will require unique solutions to their integration problems.
Can a system be robust enough to meet all these demands from a wide selection of users? 3.5 What is the remaining service life?
This is the penultimate level for the SLAM IT framework - data have been collected regarding the condition of the system or component, and the costs of previous inspections, maintenance and repair are known from the previous level of the SLAM IT framework. The remaining service life of an asset, system or component is required to perform financial comparisons of the “do nothing”, repair and renew alternatives.
There are different types of service life, such as the technical service life and the economic service life. The “technical” service life can be calculated employing techniques such as Markov chain modeling (Vanier et al, 1999), the factorial method (Arseth and Hovde, 1999) or from life
expectancy tables (HAPM, 1995). All of these methods are data or calculation intensive, or require significant amounts of preprocessed information.
Different data are required to calculate the economic life; for example, databases such as those from R.S. Means (www.rsmeans.com) or Whitestone Research (www.whitestoneresearch.com) could be used to calculate the immediate costs of repairs and to compare these numbers to the costs of renewal. Computer estimating programs also calculate the costs of maintenance, repair and replacement. The life cycle costs (LCC) of these expenditures can be calculated using standard formulae for building economics (ASTM E917, 1994) as shown in Equations (1) and (2). Ct (1+i)t N t=0 PVLCC= åååå Equation (1)
Where PVLCC = present value of life cycle costs
Ct = sum of all relevant costs, occurring in year t
N = length of study
i = the discount rate
PVLCC=IC+PVM+PVR+PVF-PVS Equation (2) Where PVLCC = present value of life cycle costs
IC = initial cost
PVM = PV of maintenance and repair cost PVR = PV of replacement cost
PVF = PV of fuel cost PVS = PV of resale value
To populate data for Equations (1) and (2) is not an easy task; not only is it difficult to obtain all of the costs for future years on projected fuel, maintenance, repair and resale, but it is very difficult to obtain projections on the discount rate to be used. In addition, the user must first approximate the technical service life, as described above.
Decisions regarding the maintenance, repair, renewal or do-nothing alternatives can be made based on this economic analysis. Costing, however, is only one dimension of decision making. One other factor must also be considered, namely risk, this is detailed in the next section.
Can all this information be located and integrated into a service life prediction tool? 3.6 What do you fix first?
This is the highest level for the SLAM IT framework; if the asset manager has reached this level; all the other levels have been implemented and the asset managers can use the existing data to assist them in their decisions to repair, rehabilitate, renew a system or component. They might also exercise the “do nothing” option. In addition, the asset managers can use these data to explore remodeling alternatives. It is time to make decisions about the service life of an asset. As mentioned earlier, there are few tools currently available to assist the asset manager to make these decisions.
A scenario is presented to illustrate choosing “what to fix first”: sensors are in place to capture condition status; the condition information from each facility is uploaded to the central repository; financial expenditures for all previous repair work orders and contracts have been
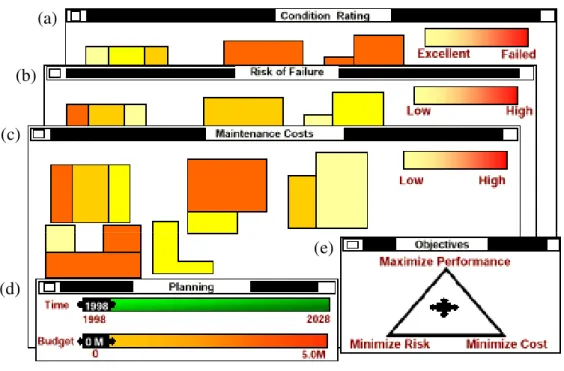
calculated at present value; the future maintenance and repair costs have been estimated based on condition information, and the probabilities of failure and consequences of damage have been projected for current and future years. For example in Figure 1 a view of a portfolio of roofs is displayed in a GIS-like format. Multi-objective optimization can now take (Vanier et al, 1998).
(a)
(b)
(c)
(d)
(e)
Figure 1 Multi-objective optimization
The amount of data required to perform these calculations and display them quickly to the asset manager is phenomenal. The condition rating of the roofs are displayed in Figure 1 (a); the risk of failure (probability of failure ✕ consequence of failure) is included as Figure 1 (b), and the maintenance cost is shown in Figure 1 (c). In Figure 1 (d) the users can move sliders to view the projected state of the portfolio: the bottom slider to estimate the condition based on the forecast budget for maintenance, and the top slider to predict the future conditions, risk or costs for the portfolio based on the selected budget. Using the two-dimensional slider in Figure 1 (e), the users can then weigh their personal preference of performance, risk and costs to perform multi-objective optimization. As can be visualized, there are intensive data calculations required to feed this type of decision support tool.
Will the industry ever be able to reach this level of SLAM integration? 4 Conclusions
As mentioned earlier in this paper, it is not the intention to propose a solution, but to identify potential problems in the development of IT frameworks for service life asset management. This paper discusses the need for IT frameworks by describing the six levels of asset management. The questions identified in the course of this discussion in fact lay out a research scheme in the field of service life and asset management:
• IT frameworks are required to support storage and flow of data from source to user;
• repository frameworks are needed for large amount of unstructured data;
• robust systems are required to meet all demands from a wide selection of users;
• these data must be integrated with service life prediction tools, and
• industry has to be able to reach a high level of data integration to support clients' needs. As can be seen there considerable research remaining in the field of IT for service life asset management. Tools are being developed, but perhaps too slowly. Data repositories are needed for structured and unstructured data. Metrics are required to evaluate performance of inventory assets. Users will be demanding that decision support tools be integrated with corporate databases. Standardization is required on a number of fronts: data collection, data storage and data transfer.
5 References
Arseth, L.I. and Hovde, P.J. (1999) A Stochastic Approach to the Factor Method for Estimating Service life, Proceedings of the Eighth International Conference on Durability of Building
Materials and Components, Vancouver, Canada, May 30-Jun 3, National Research Council
of Canada, Ottawa, Vol. 2, pp. 1247-1256.
ASTM E917 (1994) Standard Practice for Measuring Life-Cycle Costs of Buildings and
Building Systems, American Society for Testing and Materials, Philadelphia PA, 13p.
Gordon, A.R. and Shore, K.R. (1998) Life Cycle Renewal as a Business Process, Innovations in
Urban Infrastructure Seminar of the APWA International Public Works Congress, Las
Vegas, USA, pp. 41-53, (http://www.nrc.ca/irc/uir/apwa/apwa98).
HAPM (1995) LifeSpans of Building Components, Technical Note 6, Housing Association Property Mutual, June, 1995, London (http://www.hapm.co.uk).
IAI (2000) IAI Home Page, http://iaiweb.lbl.gov, April.
IAI FM (2000) Facilities Management, http://iaiweb.lbl.gov/Data/Projects/R3_projects_FM.htm, April.
McElroy R.S. (1999) Update on National Asset Management Initiatives: Facilitating Investment Decision-Making, Innovations in Urban Infrastructure Seminar of the APWA International
Public Works Congress, Denver, U.S.A, pp. 1-10, (http://www.nrc.ca/irc/uir/apwa/apwa99).
Lacasse, M.A. and Vanier, D.J. (1999) Proceedings of the Eighth International Conference on
Durability of Building Materials and Components, Vancouver, Canada, May 30-Jun 3,
National Research Council of Canada, Ottawa, 4 vols., 2954p.
Lacasse, M.A. and Vanier, D.J. (1999) Information Technology in Construction: CIB W78 Workshop, Proceedings of the Eighth International Conference on Durability of Building
Materials and Components, Vancouver, Canada, May 30-Jun 3, National Research Council
of Canada, Ottawa, Vol. 4, pp. 2139-2954.
Lemer, A.C. (1998) Progress Toward Integrated Infrastructure-Assets-Management Systems: GIS and Beyond, Innovations in Urban Infrastructure Seminar of the APWA International
Public Works Congress, Los Vegas, Nevada, USA, pp. 7-24,
Lounis, Z. Vanier, D.J. Lacasse, M.A. and Kyle, B.R (1998) Effective decision-making tools for roofing maintenance management, First International Conference on New Information
Technologies for Decision Making in Construction, Montreal, Canada, pp. 425-436,
(http://www.nrc.ca/irc/fulltext/nrcc42831.pdf).
NACUBO (1990) Managing the Facilities Portfolio, National Association of College and University Business Officers, Washington, DC, 100p.
Rezgui, Y. and Cooper, G. (1998) A Proposed Open Infrastructure for Construction Project Document Sharing, Electronic Journal of Information Technology in Construction, (http://www.itcon.org/19998/2/paper.htm).
Sawyers, J. (1997) Building Condition Management, Canadian Healthcare Engineering Society
Quarterly Journal, Summer/Winter, Canadian Healthcare Engineering Society, North York,
Canada. (http://www.ches.org/chesjournal/journal97/art9701.html)
Shahin, M.Y., Bailey, D.M. and Brotherson, D.E. (1987) Roofer: Membrane and Flashing Condition Indexes for Built-Up Roofs, Technical Report M-87/ADA190368, US Army Construction Engineering Research Laboratory, Champaign, IL, 97p.
STEP (2000) STEP SC4 Home Page, http://www.nist.gov/sc4, April.
Vanier, D.J. (1998) Product Modeling: Helping Life Cycle Analysis of Roofing Systems, The
Life Cycle of Construction IT Innovations: Technology transfer from research to practice,
Proceedings of Conference W78, Stockholm, June, pp. 423-435.
Vanier, D.J. (1999) Why Industry Needs Asset Management Tools, Innovations in Urban
Infrastructure Seminar of the APWA International Public Works Congress, Denver, U.S.A,
pp. 11-25, (http://www.nrc.ca/irc/uir/apwa/apwa99).
Yu K., Froese T., and Grobler, F (2000) A development framework for data models for computer-integrated facilities management, Automation in Construction, 9, pp.145-167.