Publisher’s version / Version de l'éditeur:
Journal of Analytical Atomic Spectrometry, 18, 8, pp. 902-909, 2003
READ THESE TERMS AND CONDITIONS CAREFULLY BEFORE USING THIS WEBSITE. https://nrc-publications.canada.ca/eng/copyright
Vous avez des questions? Nous pouvons vous aider. Pour communiquer directement avec un auteur, consultez la première page de la revue dans laquelle son article a été publié afin de trouver ses coordonnées. Si vous n’arrivez pas à les repérer, communiquez avec nous à PublicationsArchive-ArchivesPublications@nrc-cnrc.gc.ca.
Questions? Contact the NRC Publications Archive team at
PublicationsArchive-ArchivesPublications@nrc-cnrc.gc.ca. If you wish to email the authors directly, please see the first page of the publication for their contact information.
NRC Publications Archive
Archives des publications du CNRC
This publication could be one of several versions: author’s original, accepted manuscript or the publisher’s version. / La version de cette publication peut être l’une des suivantes : la version prépublication de l’auteur, la version acceptée du manuscrit ou la version de l’éditeur.
For the publisher’s version, please access the DOI link below./ Pour consulter la version de l’éditeur, utilisez le lien DOI ci-dessous.
https://doi.org/10.1039/b212545e
Access and use of this website and the material on it are subject to the Terms and Conditions set forth at
A comparison of alkyl derivatization methods for speciation of mercury
based on solid phase microextraction gas chromatography with
furnace atomization plasma spectrometry detection
Grinberg, P.; Campos, R. C.; Mester, Z.; Sturgeon, R.
https://publications-cnrc.canada.ca/fra/droits
L’accès à ce site Web et l’utilisation de son contenu sont assujettis aux conditions présentées dans le site LISEZ CES CONDITIONS ATTENTIVEMENT AVANT D’UTILISER CE SITE WEB.
NRC Publications Record / Notice d'Archives des publications de CNRC:
https://nrc-publications.canada.ca/eng/view/object/?id=8d7075fe-6524-42b9-a989-9adf85c54717
https://publications-cnrc.canada.ca/fra/voir/objet/?id=8d7075fe-6524-42b9-a989-9adf85c54717
A comparison of alkyl derivatization methods for speciation of
mercury based on solid phase microextraction gas chromatography
with furnace atomization plasma emission spectrometry detection{
Patricia Grinberg,
aReinaldo C. Campos,
bZoltan Mester
aand Ralph E. Sturgeon*
aa
Institute for National Measurements Standards, National Research Council of Canada, Ottawa, Ontario, Canada K1A 0R6. E-mail: ralph.sturgeon@nrc.ca
b
Department of Chemistry, Pontifı´cia Universidade Cato´lica do Rio de Janeiro, Rua Marqueˆs de Sa˜o Vicente, 225, 22453-900 Rio de Janeiro-RJ, Brazil
Received 20th December 2002, Accepted 6th May 2003
First published as an Advance Article on the web 19th June 2003
Several derivatizing agents were evaluated for use in speciating mercury in biological samples using solid phase microextraction in conjunction with tandem gas chromatography-furnace atomization plasma emission spectrometry (SPME-GC-FAPES). Following digestion with methanolic potassium hydroxide, the pH of the samples was adjusted and NaCl added when necessary. The mercury species were then derivatized with sodium tetraphenylborate or sodium tetrapropylborate and extracted by SPME using a 100 mm PDMS coated fiber. The derivatized species were then separated by GC and detected by FAPES. All experimental parameters were optimized for best separation and analytical response. Propylation proved to be more sensitive, robust and faster than ethylation or phenylation, leading to procedural detection limits of 0.55 ng g21for methylmercury,
0.34 ng g21for ethylmercury and 0.23 ng g21for inorganic mercury. An intra-day and intra-fiber precision of
typically 2.2% was achieved whereas long-term (4 months) and inter-fiber reproducibility precision was typically 4.4%. The accuracy of the method was validated by the analysis of Certified Reference Materials (DORM-2, DOLT-2 and TORT-2) from the National Research Council of Canada.
Introduction
The attractive feature of using gas chromatographic techniques as speciation tools results from the use of a gas as the mobile phase, which not only enables quantitative transport of the sample to the detector, but also maintains low background. One shortcoming is the need for prior derivatization of a number of organometallic compounds to transform them into volatile and thermally stable species.
Traditional derivatization techniques have been based on the Grignard reaction,1–6 making use of more than 30 commer-cially available Grignard reagents. However, the target species must first be extracted into a non-polar, aprotic solvent and then dried prior to derivatization, rendering sample prepara-tion tedious and time consuming.
Recently, tetraalkylborate compounds have gained great popularity as derivatization reagents for the speciation analysis of organometallic compounds as the reaction is accomplished in aqueous solution. This reduces analysis time and minimizes the use of organic solvents, which is one of their main advantages in comparison to Grignard reactions.
Among tetraalkylborate compounds, sodium tetraethyl-borate (NaBEt4) is the most used.7This compound was first
introduced by Rapsomanikis et al.8 for the derivatization of organolead compounds and it has also been successfully used for mercury9–13 and tin speciation.14–19 Solutions of NaBEt4
are fairly stable but should be freshly prepared before use. A significant limitation of direct aqueous phase ethylation is that ethyllead and ethylmercury species cannot be distinguished from the simple ionic inorganic species.
Phenylation using sodium tetraphenylborate (NaBPh4) was
proposed by Luckow and Russel20 as a means for achieving direct phenylation of Hg21and MeHg1in aqueous solution.
This method was further studied with some applications for the determination of methyl-, ethyl- and inorganic mercury compounds.13,21–25
De Smaele et al.26reported the use of sodium
tetrapropyl-borate (NaBPr4) as a derivatization reagent and it has
subsequently been used for mercury speciation4,11as well as organotin and organolead speciation.27
Both NaBPh4 and NaBPr4 are commercially available
and combine two major advantages: ease of handling for
in-situ derivatization and extraction, and the possibility
of distinguishing between ethyl- and inorganic mercury and lead derivatives. The reagent solutions are also more stable than those of NaBEt4,22,26 making them good
alter-natives for derivatization, especially when used for mercury speciation.
All successful approaches to speciation require the use of a species-selective methodology. Selectivity can be achieved through judicious sample preparation and by combining chromatographic separation with highly specific elemental detection.
Traditional sample preparation methods are typically time consuming and, of necessity, involve several steps which increase the risks of loss or contamination of analytes and employ an extensive amount of organic solvent, the latter no longer being tolerated due to the associated health risks and disposal concerns. As a result, many solvent-free extraction methods, such as solid-phase microextraction (SPME), have been described or recently rediscovered.
SPME was introduced in 199028and interest in this method continues to grow very rapidly. Its application to the determination of volatile organic analytes is well established but its use in organometallic speciation has just begun.29This technique combines extraction, pre-concentration and sample introduction in one step and offers several advantages for sample preparation, including reduced time per sample, less sample manipulation, elimination of organic solvents, reduced
{#Crown copyright Canada 2003.
analyte loss, simplicity, low cost and the possibility of imple-menting an on-line analytical procedure.
Detection systems used for speciation should exhibit exceptional selectivity and sensitivity to the target analyte. The most common chromatographic detectors are universal or selective but, unfortunately, lack the required specificity. For mercury speciation, the most common techniques used include cold vapour (CV) atomic absorption spectrometry (AAS),30–35 cold-vapor atomic fluorescence spectrometry (CVAFS),36–39 inductively coupled plasma mass spectrometry (ICP-MS),4,40–42 microwave induced plasma atomic emission spectrometry (MIP-AES)40,43,44 and furnace atomization plasma emission
spectrometry (FAPES).45–47
FAPES is an atomic emission technique which capacitively links a conventional graphite furnace with a coaxial electrode to which radiofrequency power is applied, thereby generating an atmospheric He plasma within the volume of the graphite tube. The plasma is utilized to excite the atomic vapor produced during a normal graphite furnace atomization cycle. This technique has been shown to provide not only enhanced analytical performance, but also extended lifetime compared with MIP-AES, when coupled with gas chromato-graphic separation techniques.45–47
In previous work,47 a procedure for the determination of methylmercury and inorganic mercury in fish tissue was described using aqueous phase ethylation, SPME extraction and gas chromatography coupled on-line to FAPES. Unfortu-nately, as noted earlier, no differentiation of inorganic mercury and ethylmercury in the sample could be obtained and, in order to alleviate this problem, the use of NaBPh4and NaBPr4as
derivatization reagents for mercury speciation was evaluated and is reported herein.
Experimental
Instrumentation
SPME-GC. A Varian Model 144010-00 (Wallnut Creek, CA, USA) gas chromatograph equipped with a 30 m 6 0.25 mm id fused silica capillary column coated with a 0.25 mm film thickness of DB-5MS (J & W Scientific, Folsom, CA, USA) was used. A split/splitless injector, fitted with a 0.75 mm id liner sleeve (Supelco, Bellefonte, PA, USA) and thermogreen LB-2 Septum (9.5 mm, Supelco), was used in the splitless mode, maintained at 220 uC or at the temperature recommended by the SPME manufacture. Helium was used as a carrier gas at a flow rate of 4.0 ml min21.
Headspace SPME extraction was manually performed using
fibers coated with 100 mm polydimethylsiloxane (PDMS) (Supelco).
FAPES detection system
The FAPES system, described in detail previously,48–50is based
on a 40.68 MHz rf He plasma supported inside a PerkinElmer Model HGA-2200 graphite furnace (Norwalk, CT, USA). A Model RF10L rf generator (Advanced Energy Ind., Fort Collins, CO, USA) provided 20–200 W of rf power to a 1 mm diameter tantalum or stainless steel electrode which was centred along the axis of the graphite tube. This tube was transversely drilled along its length with numerous small holes to permit uniform escape of the GC effluent gas into the plasma source. With this arrangement, the analyte is directly introduced into the most energetic portion of the FAPES discharge for optimum excitation.51
The rf power supply was connected through an AM-5L impedance matching network.
A 0.5-m Varian monochromator (Springvale, Australia), equipped with a Hamamatsu R446 PMT operated at 2550 V, was used for wavelength isolation and intensity measurement. Data were collected and manipulated by an IBM 486 PC using in-house software written in Turbo Pascal version 4.0 (Borland International, Scotts Valley, CA, USA).
The furnace was heated by a PerkinElmer HGA-2200 power supply.
The working wavelength was set using a Hg hollow cathode lamp (Intensitron, PerkinElmer) and a nominal spectral bandwidth of 0.06 nm was used for all intensity measurements. Pyrolytic graphite coated tubes (PerkinElmer, Norwalk, CT, USA) were used throughout.
An Ar external sheath gas was maintained at a flow-rate of 1 l min21and a He internal plasma gas was set at flow-rates
between 20 and 500 ml min21.
The GC effluents were transported to the FAPES via a 35 cm length of 0.25 mm id fused silica tubing housed within a 6 mm id heated copper tube introduced into the GC oven through a heated lateral orifice. Effluents from the column were directed to the center electrode, as described earlier,45and they exited the internal volume of the graphite tube via the dosing hole.
A schematic diagram of the SPME-GC-FAPES system is shown in Fig. 1.
Reagents
Stock solutions (1000 mg l21) of inorganic mercury (Hg21),
methylmercury (MeHg1) and ethylmercury (EtHg1) were
Fig. 1 Schematic of the SPME-GC-FAPES system.
prepared by dissolution of appropriate amounts of mercury(II) chloride (Aldrich, Gold Label, Milwaukee, WI, USA), methyl-mercury chloride (Alfa Aesar, Johnson Matthey, Ward Hill, MA, USA) and ethylmercury chloride (Alfa Aesar) salts, respectively, and stored in the dark at 4 uC. Both MeHgCl and EtHgCl were dissolved in propan-2-ol. Working standards of HgCl2were prepared just before use by serial dilutions of the
1000 mg l21 stock solutions using high-purity, de-ionized,
distilled water (DDW) from a Milli-Q system (Barnsted, Dubuque, IA, USA) acidified to 1% v/v with sub-boiling, quartz distilled HNO3. MeHgCl and EtHgCl were prepared by
serial dilutions of their stock solutions using high-purity methanol.
Sodium tetrapropylborate (NaBPr4) (GALAB, Geesthacht,
Germany) and sodium tetraphenylborate (NaBPh4) (Alfa
Chemicals Inc., Newburyport, MA, USA) were used as derivatization reagents. Aqueous solutions having concentra-tions ranging from 0.2 to 2% (m/v) were prepared. These solutions were kept in the dark at all times at 4 uC (even during measurements) otherwise they decomposed in a single day.
‘‘Buffer’’ solutions (1 mol l21) having pH values between 2
and 8 were prepared by mixing appropriate amounts of acetic acid and sodium acetate (Fisher Chemicals, Fair Lawn, NJ, USA). To obtain a pH of 2 or 8, dilute solutions of HCl and NH4OH were used for final adjustments. High purity NaCl
(Merck, Darmstadt, Germany) was also used to adjust the ionic strength of the reaction media.
All chemicals used were of analytical reagent grade. Industrial grade He and Ar (for FAPES system) and zero grade He (for GC) (Praxair Products Inc., Mississauga, ON) were used throughout.
Samples
Several Certified Reference Materials were used to assess the accuracy of the proposed method: NRCC (National Research Council Canada) DOLT-2 Dogfish Liver, TORT-2 Lobster Hepatopancreas and DORM-2 Dogfish Muscle.
Analytical procedure
Sample preparation was based on the procedure reported by Cai and Bayona.52 Briefly, a nominal 250 mg sub-sample of tissue was accurately weighed into a glass vial and 25 ml of 25% (m/v) methanolic KOH solution were added. The vessel was capped and the sample was shaken for 4 h and then stored at 4 uC until analyzed.
For headspace SPME sampling, 12.5 ml of acetate buffer (pH 5), aliquots of Hg standards or sample digest (200 ml DORM-2 solution, 1 ml DOLT-2 solution, 1 ml TORT-2 solution), 1 ml of derivatization reagent solution (1% (m/v)) and a magnetic stir bar were placed in a 40 ml amber vial (28 6 98 mm). The vial was immediately sealed with a Teflon-lined septum. The mixture was stirred magnetically to ensure the proper mixing of the sample solution and to enhance transfer of the analytes from the solution to the headspace. After a predetermined time, the SPME fiber was introduced into the vial headspace by piercing the septum with the protection needle and exposing the fiber for a given time. The fiber was then retracted into the protection needle, the SPME fiber holder withdrawn and immediately introduced into the GC injector. By exposing the fiber to the heated carrier gas, the analytes were thermally desorbed and transferred to the GC column for separation and transport to the FAPES via a flow of helium. Data collection was manually started a few seconds prior to the insertion of the fiber into the GC injector.
Background correction with this system was limited to sequential measurement of a blank solution and was accom-plished by simple subtraction of the resulting chromatogram from that of the sample. All results reflect the mean of at least 3
independently prepared test samples from which multiple (3–5) replicate samplings of the headspace were undertaken. The presence and rejection of outliers in each set of data was verified using a Dixon test. Relative standard deviation was typically 2%.
Memory effects between samples were verified by analyzing blank solutions. For this, a blank solution was injected after every 3 sample measurements.
Dry weight correction of the results was implemented following measurement of sample moisture content using a separate sub-sample. The procedure used for this purpose is as recommended in the CRM certificate.
It was verified that the amber vial is more prone to contamination from EtHg1 than other Hg species. In order
to overcome this contamination, vials were thoroughly cleaned using a detergent to remove any lipid residues, soaked in 10% (v/v) nitric acid for at least 24 h and thoroughly rinsed with Milli-Q water before redeployment.
Results and discussion
As verified in previous work,47the position of the SPME fiber within the vial does not influence the amount of analyte extracted (at equilibrium) but care should be taken when positioning the fiber near the solution in order to avoid wetting by solution droplets. If moisture reaches the plasma, it can decrease plasma power coupling and/or introduce instability and deteriorate analytical performance.
During the desorption procedure, the SPME fiber should be positioned to a depth of 2–5 cm (measured from the head of the injector) into the GC liner in order to minimize peak tailing. A 40 s desorption time at an injector temperature of 220 uC assured total desorption of the mercury species from the fiber with no memory effects.
The injector was inspected daily in order to clean the liner and change the septum. A reconditioning procedure was implemented following this, consisting of 3 SPME injections of a high concentration standard (50 ng ml21), thereby making
possible a stable and constant response over different days of operation. This performance test was undertaken solely to ensure that the system was operating properly after having been disassembled.
During this work, no degradation of peak shape or column resolution was observed. Daily maintenance of the column entailed heating to 220 uC for 5 min at the end of each workday, in order to remove any accumulation of high-boiling point compounds.
We earlier reported47 detection limits of 1.5 ng g21 for
methylmercury and 0.7 ng g21 for inorganic mercury in
biological tissues following ethylation with SPME-GC-FAPES detection. Unfortunately, no differentiation between inorganic mercury and ethylmercury could be achieved using this approach, as both species are alkylated to HgEt2. Although
ethylmercury has not been reported in marine and fresh water animals,53 its presence has already been noted in polluted environments.54,55Thus, development of analytical methodo-logies that make possible the differentiation and determination of this species will be crucial in the future.
Chromatographic separation
Fast and efficient separation of the propylated mercury species required a heating rate of 15 uC min21to a final temperature of
200 uC (permitting all propylated Hg species to be eluted by 115 uC). The initial temperature was the same as that used for ethylation (40 uC) and after 5 min the full chromatographic run is complete.
Optimum separation with the use of NaBPh4was achieved
using an initial temperature of 80 uC, ramped at 20 uC min21,
species to be eluted by 200 uC). The chromatographic run required about 7 min. A higher transfer line temperature (200 uC) was also necessary to prevent condensation of sample constituents within the capillary column, since the boiling points of phenyl derivatives are higher than the ethyl analogues.13
Using SPME coupled with NaBPh4 derivatization permits
the determination of only MeHg1 and EtHg1, as Hg21 is
converted to diphenylmercury, a compound with low volatility, which is inefficiently extracted by the SPME fiber. Despite a longer SPME equilibration time (about 12 h), no response was obtained. By contrast, it is possible to differentiate all three mercury species using NaBPr4.
Typical chromatograms obtained using the three derivatiza-tion reagents are presented in Fig. 2. It is evident from these data that there is a significant difference in the response achieved with the various derivatization reagents and also for the different species when using the same derivatizing agent. This may arise as a result of several different factors: (a) variations in derivatization efficiency among species when using any given derivatization agent; (b) variation of vapor pressure and liquid phase solubility among the derivatized species; (c) variation in the partition coefficient for uptake of various derivatized species by the SPME fiber; and (d) variation in the degree of atomization/excitation of the species in the FAPES plasma. A Hg0 peak was present in the chromatogram arising from use of all derivatizing agents. As noted before,47 the source of this signal was verified to be thermal decomposition of the derivatized Hg species in the heated injector. No signal for Hg0 is recorded during the
processing of the analytical blank. Additionally, no Hg0signal is detected in the headspace above a solubilized sample that has not been derivatized. The response from Hg0arises from every individual form of Hg tested (i.e., Hg21, MeHg1, EtHg1): Hg0
response is present when sampling derivatized synthetic standards not containing Cl2anions; Hg0
response is obtained from all standards, irrespective of the derivatizing agent used and Hg0 intensity is observed to increase with increase in injector temperature. A linear relationship between the intensity of the Hg0 peak and all other mercury species was obtained for all samples and spikes (not shown), confirming that a constant degree of thermal decomposition occurs. Therefore, the presence of this peak does not impair the accuracy of the technique because a constant mass fraction of the derivatized species is decomposed, leading to the same loss of response from both calibration standards and endogenous analyte.
The Hg0peak is relatively larger for phenylation due to the
necessity of use of a higher temperature during both the derivatization/extraction procedure as well as in the transfer line. The column heating program used for phenylation also uses higher temperatures than that for the other derivatization agents.
Optimization of derivatization and SPME parameters
Propylation and phenylation procedures are more robust than ethylation with respect to several analytical parameters, including pH of reaction medium and long-term stability.
Both propylation and phenylation can be performed over a relatively wide reagent concentration range, from 0.5 to 2% and 1 to 2% (m/v) for NaBPr4and NaBPh4, respectively, with no
influence on the amount of analyte extracted. Similar to NaBEt4, the use of concentrations higher than 2% (m/v) can
lead to self-ignition or degradation of the SPME fiber coating during the extraction procedure: a concentration of 1% (m/v) was thus selected for both derivatizing agents for all further measurements.
One of the most important parameters characterizing SPME extraction is the equilibration time, which is the time required for the amount of analyte extracted to reach a steady-state, within the limits of experimental error, independent of further increases in extraction time. This will depend on the volatility of the compounds to be extracted. An optimal approach to SPME is to allow the analyte to achieve equilibrium between the sample matrix and the fiber coating, otherwise the extraction time and mass transfer conditions have to be strictly controlled to assure good precision. At equilibrium, variations in the extraction time will not affect the amount of analyte extracted by the fiber.28
As was the case for NaBEt4, phase equilibration can be
reached after 10 min for all mercury species studied when using NaBPr4as the derivatizing agent, as shown in Fig. 3A.
The extraction time reflects the time taken for species derivatization, their transport from the liquid phase to the gas phase headspace and extraction by the SPME fiber. In previous work with NaBEt4,47the SPME extraction step was shown to
be extremely fast, it being achieved in about 20 s. With propylation, the integrated response was constant 40 s after initiating the SPME extraction, as shown in Fig. 3B.
In the case of phenylation, the equilibration time is longest (about 30 min) and SPME extraction of the phenylated species into the fiber is slower such that equilibrium is achieved only after 10 min. This characteristic substantially decreases sample throughput using this reagent.
The pH and the salinity are also important factors influencing not only the derivatization yield but also the analyte sorption characteristics. The alkylation of organo-metallic compounds with tetraalkylborates is known to be strongly pH dependent and needs to be separately optimized
Fig. 2 Typical chromatograms using (i) ethylation (2 mg L21MeHg
and Hg21), (ii) propylation (4 mg L21MeHg1, EtHg1and Hg21) and
(iii) phenylation (20 mg L21CH
3Hg1, C2H5Hg1 and Hg21) for (A)
Hg0, (B) MeHg1, (C) EtHg1 and (D) Hg21 calibration standards.
Note: only a portion of the total chromatographic run is displayed.
for each compound. Both derivatization agents can be utilized over a relatively wide pH range, from 4.5 to 6 and 2 to 6 for NaBPr4 and NaBPh4, respectively. In this respect, both
reagents are more robust than NaBEt4, which has to be used
at pH 5. At low pH values, NaBPr4is rapidly decomposed to
BPr3and propane.26
Since the derivatized organometallic species are non-polar, it is expected that the addition of salts to the aqueous samples to increase the ionic strength of the medium will serve to salt out the analyte and lead to an increase in its equilibrium concentration available to the SPME fiber.56With phenylation, a 7.5-fold enhancement in the extraction efficiency was obtained when using a NaCl concentration of 30% (m/v). For propylation, this enhancement was about 1.2-fold. For this reason, a 30% (m/v) NaCl medium was subsequently used for derivatization of all samples and calibration standards.
The effect of increased extraction temperature was also evaluated. Equilibrium between the analyte sorbed onto the SPME fiber coating and that in the sample solution depends on both the solubility of the analyte in the aqueous phase and its sorption affinity for the fiber coating. Thus, increasing the temperature will increase the vapor pressure of the analyte in the headspace but may simultaneously decrease sorption onto the fiber, particularly for highly volatile compounds. With propylation, no improvement in the efficiency of extraction of any species was observed when the temperature was varied from 22 uC to 55 uC. For phenylation, on the other hand, an increase in extraction temperature resulted in an improvement in the integrated response, achieving a maximum (3-fold increase) at a temperature of 55 uC. For both derivatization agents, temperatures higher than 55 uC decreased the integrated response, most likely due to decreased plasma power as a consequence of increased co-extraction of water/ solvent. It was also verified that with increase in the extraction temperature there was a corresponding increase in the Hg0 signal. It appears that some degree of thermal decomposition of the alkylated Hg species occurs in the aqueous phase.57
Optimization of the FAPES system
The spatial distribution and intensity of atomic and molecular emission in FAPES is not only dependent on the sample and matrix, but also the plasma working conditions.
FAPES parameters, such as forward power, sheath gas flow and furnace temperature, were thus optimized for best signal/ noise ratio. Conditions similar to those earlier used for NaBEt4
derivatization47were obtained.
As was noted earlier, the GC effluents are introduced directly
through the body of the center electrode where they are then efficiently excited as soon as they enter the most intense region of the plasma. The efficiency of excitation depends on the FAPES parameters and the temperature of the graphite furnace. Over the course of a work-day, the plasma is continuously on for about 8–9 hours, limiting the choice of materials used for the manufacture of the center electrode. Three different materials (tantalum, stainless steel and molybdenum) were evaluated as electrode substrate. Tantalum showed the best results in relation to peak shape and lifetime. When using stainless steel, a broader peak was observed for all species, although they could still be completely resolved from one another. This material has the advantage that it is easiest to machine and the least expensive. Further studies relating to the use of stainless steel need to be conducted. The molybdenum electrode exhibited the shortest lifetime, about 200 hours (half that of the tantalum electrode), and sagged, making the plasma difficult to ignite and be sustained. This study was therefore conducted with a tantalum electrode.
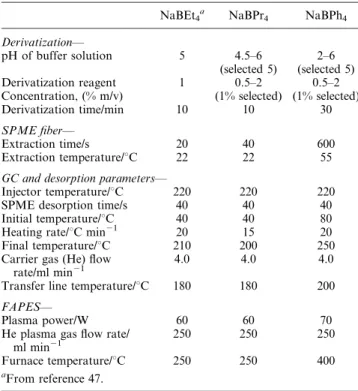
Optimized FAPES parameters are presented in Table 1 along with those for derivatization, SPME and GC para-meters. For purposes of comparison, the operating conditions used with NaBEt4 derivatization47 are also presented for
convenience. Analytical results
Analytical figures of merit, including precision, limits of detection (LOD) and spike recoveries were obtained under optimum conditions and summarized in Table 2.
Calibration graphs for the various organomercury com-pounds were generated using a series of mixed Hg standards. The lack of background drift made possible the subtraction of a constant background signal measured in the absence of analyte. The linearity of response for both derivatizing agents spanned about 3 orders of magnitude, typical for the FAPES source,58extending from the LOD to 150 ng ml21.
The precision of the method was evaluated by measurement of 10 consecutive samples containing both mercury species at concentrations approximately 100-fold higher than their estimated LOD. The results, presented in Table 2, correspond to a pool of data covering a period of 4 months and reflect data convoluted by the effect of inter-fiber reproducibility as well.
Fig. 3 Effect of extraction time on integrated response from (') 4 mg L21MeHg1, (%) 4 mg L21EtHg1and (#) 4 mg L21Hg21signal
using NaBPr4 as derivatizing reagent: (A) fiber injection after the addition of derivatizing agent, (B) injection 10 min after the derivatization reaction is initiated. Response was normalized to the most intense signal. SPME, GC and FAPES parameters are summarized in Table 1. As the RSD of mean data points is typically 2%, no error bars are presented.
Table 1 SPME-GC-FAPES operating conditions
NaBEt4a NaBPr4 NaBPh4
Derivatization—
pH of buffer solution 5 4.5–6 2–6 (selected 5) (selected 5) Derivatization reagent 1 0.5–2 0.5–2 Concentration, (% m/v) (1% selected) (1% selected) Derivatization time/min 10 10 30
SPME fiber—
Extraction time/s 20 40 600 Extraction temperature/uC 22 22 55
GC and desorption parameters—
Injector temperature/uC 220 220 220 SPME desorption time/s 40 40 40 Initial temperature/uC 40 40 80 Heating rate/uC min21 20 15 20
Final temperature/uC 210 200 250 Carrier gas (He) flow
rate/ml min21
4.0 4.0 4.0
Transfer line temperature/uC 180 180 200
FAPES—
Plasma power/W 60 60 70
He plasma gas flow rate/
ml min21 250 250 250
Furnace temperature/uC 250 250 400
For any given fiber, the intra-fiber reproducibility is typically 2%. Degradation of figures of merit arising from use of different fibers is due to the variable quality of the SPME fiber, as any irregularity or inhomogeneity on its surface may result in a significant difference in its extraction characteristics.
The lifetime of each SPME fiber was approximately 100– 150 extractions, irrespective of their use with samples or standards.
Detection limits were calculated based on a 3s criterion, where s is the estimate of the standard deviation of at least 10 repetitive measurements of the blank. The absolute procedural blank for each species was undetectable and limited by baseline noise emitted by the plasma. Enhanced limits of detection were obtained with NaBPr4 compared to both NaBEt447 and
NaBPh4. On a dry weight basis, the estimated procedural
LODs for the determination of MeHg1, EtHg1and Hg21in
dry fish tissues using NaBPr4are 0.55, 0.34 and 0.23 ng g21,
respectively. Corresponding values with NaBPh4are 7.5 and
39.5 ng g21 for MeHg1 and EtHg1, respectively, based on
solubilization of 0.25 g samples in 25 ml with a 200 ml sub-sample transferred to the derivatization vial.
Recovery experiments were performed by comparing the response obtained from spikes of known amounts of both mercury species added to DORM-2 tissue samples, before digestion, with those obtained from deionized water calibration standards. For NaBPr4and NaBPh4, a 30% NaCl medium was
used to enhance response. For both derivatizing agents, recovery of both mercury species is in the range of 94–100%, showing no losses or artifact methylation due to inorganic mercury50,59,60 during the pretreatment procedure. The pre-sence of a Hg0peak due to thermal decomposition results in the same loss of response to both calibration standards and endogenous analyte extracted from the samples. Due to the poor limit of detection obtained with NaBPh4, spikes added to
DORM-2 extracts needed to be more concentrated (about 100-fold) than those added when using NaBPr4. It should be noted
that, in both cases, the concentrations added to the sample are within the linear range of response.
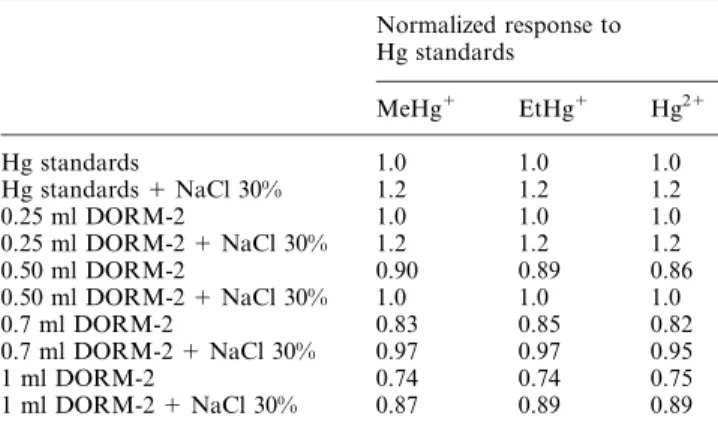
Poor recovery (typically 75%) was obtained for spikes added to samples of TORT-2 and DOLT-2 because larger sample volumes of sample digest needed to be used (1 ml instead of 0.2 ml) during the derivatization/extraction step to ensure a good signal-to-noise ratio. Table 3 summarizes the normalized slope of a standard additions calibration curve prepared from varying volumes of DORM-2 digest, which was subsequently propylated.
It was verified that, in the absence of NaCl, the recovery decreased almost linearly from 100 to 75% as the sample digest volume increased from 0.25 to 1 ml. In the presence of NaCl, the volume of sample digest that can be tolerated to yield complete recovery for all species is increased 2-fold.
Decreased recovery may arise for several reasons: compo-nents of the sample matrix may decrease the derivatization efficiency, decrease the concentration of volatile species in the headspace, or competitively saturate uptake sites on the fiber, preventing optimum extraction of the analyte.
Table 2 Figures of merit
Ethylationa— MeHg1 EtHg1 Hg21 1 EtHg1 PH PA PH PA PH PA Precision (%b) 7.2 4.3 — — 5.9 3.8 LOD/ng ml21 0.46 0.16 — — 0.07 0.06 Procedural LOD/ng g21 4.0 1.5 0.8 0.7 Spike recovery (%c) 95 ¡ 6 98 ¡ 5 — — 97 ¡ 7 99 ¡ 6 Propylation— MeHg1 EtHg1 Hg21 PH PA PH PA PH PA Precision (%b) 8.3 4.8 7.1 3.7 7.3 4.4 LOD/ng ml21 0.09 0.06 0.06 0.03 0.04 0.02 Procedural LOD/ng g21 1.5 0.55 1.3 0.34 1.1 0.23 Spike recovery (%c) 94 ¡ 7 97 ¡ 6 96 ¡ 6 98 ¡ 5 95 ¡ 7 100 ¡ 4 Phenylation— MeHg1 EtHg1 Hg21 PH PA PH PA PH PA Precision (%b) 6.4 5.3 7.3 4.8 — — LOD/ng ml21 1 0.65 5 3.5 — — Procedural LOD/ng g21 17.4 7.5 50.0 39.5 Spike recovery (%c) 96 ¡ 7 97 ¡ 5 98 ¡ 3 99 ¡ 2 — —
aFrom reference 47.bRSD of 10 replicate derivatization measurements at an analyte concentration 100-fold above the LOD.cMean and
stan-dard deviation (n ~ 5).
Table 3 Comparison of Hg recovery with increasing volume of DORM-2 sample digest
Normalized response to Hg standards MeHg1 EtHg1 Hg21 Hg standards 1.0 1.0 1.0 Hg standards 1 NaCl 30% 1.2 1.2 1.2 0.25 ml DORM-2 1.0 1.0 1.0 0.25 ml DORM-2 1 NaCl 30% 1.2 1.2 1.2 0.50 ml DORM-2 0.90 0.89 0.86 0.50 ml DORM-2 1 NaCl 30% 1.0 1.0 1.0 0.7 ml DORM-2 0.83 0.85 0.82 0.7 ml DORM-2 1 NaCl 30% 0.97 0.97 0.95 1 ml DORM-2 0.74 0.74 0.75 1 ml DORM-2 1 NaCl 30% 0.87 0.89 0.89
It is known that the use of an excess of derivatization agent is important when analyzing real samples. The sample constitu-ents can consume the bulk of the derivatization reagent before it reacts with the target species61 but, in this study, it was verified that an increase of derivatization agent concentration was not effective in counteracting the deleterious effects of increased sample matrix.
In order to verify if there is any competition between target and sample constituents for the sites on the SPME fiber, the fiber was first exposed to the headspace in a vial containing pH buffer and 500 ml of sample digest. The fiber was then transferred to a vial containing pH buffer, Hg standards and the derivatization reagent. The same experiment was repeated using the derivatization reagent in the first vial. No difference in response for any Hg species was observed, showing that there is no competition between the analyte and sample constituents for the sites on the SPME fiber.
During the derivatization and SPME extraction of larger sample aliquots, a higher fat content is present. The derivatized Hg species are lipophilic and may be bound to this phase, thereby decreasing their concentration in the aqueous phase and, consequently, their concentration in the headspace. In order to verify this, pure standards of each species would be needed for spike recovery experiments, but most are not commercially available. This experiment was not attempted but, from the above results, the decreased concentration of volatile species in the headpace could be the reason for the decreased recovery observed in the presence of larger volumes of DORM-2 digest.
Both KOH sample solubilization and their subsequent derivatization/SPME extraction can be performed in parallel with the separation of the species by GC, thereby substantially increasing throughput. Sample throughput was about 9 measurements per hour when using NaBPr4, but this value
decrease to 6 for NaBPh4.
The accuracy of the proposed methodology was verified by analyzing several fish certified reference materials. The peak area of the transient signal was used for standard additions quantitation. Results for propylation are summarized in Table 4.
With regard to phenylation, even after optimization of all parameters, a poor detection limit was obtained for both methyl- and ethylmercury, making it impossible to use this method for the analysis of real samples. It should be noted that this conclusion pertains to the SPME-GC-FAPES system and is due to the low volatility of the resulting phenyl derivatives, which lead to their poor extraction and consequent poor figures of merit. Better results can be achieved when using solvent injection. For example, Cai et al.13obtained an absolute limit of detection of about 0.04 ng ml21 when using GC-AFS and
GC-AES for both methyl- and ethylmercury, Palmieri et al.24 reported a limit of quantification of about 0.6 mg g21based on
0.08 g of freeze-fried fish powder when using GC-MIP-AES for methylmercury. Although the presence of solvent in the FAPES system can cause instability of the plasma and sometimes lead to its collapse, even with automatic impedance matching, this problem can be easily circumvented with the use of appropriate GC solvent venting techniques.46
Results presented in Table 4 were obtained using the method of standard additions. Calibration against a standard curve would be possible only if the analyte species concentrations were sufficiently high, such as with DORM-2, that matrix effects could be minimized by taking advantage of high dilution factors. For each measurement, 3 replicate determinations of the analyte in 3 separately digested sub-samples of the material were undertaken.
As shown in Table 3, measured values (corrected to dry mass basis, approximately 5% moisture content) for all CRMs used are in good agreement with certified values.
The reference materials used in this study are certified only for MeHg1and total Hg content. Total Hg corresponds to the
sum of MeHg1, EtHg1 and Hg21. The corresponding
associated precisions were obtained by propagation of random errors.
Fig. 4 shows a typical chromatogram obtained using propylation-headspace SPME, GC separation and FAPES detection for a sample of DOLT-2. Peak identity was verified by comparison of retention times for processed standards. The peak obtained for the Hg species in the sample is slightly broader than those for the standards, possibly due to adsorption/desorption of other sample constituents on the column, or an altered desorption process from the fiber.
A peak for Hg0is present in the chromatogram when using NaBPr4, as is the case for NaBEt4.47It was verified that this
signal is due to thermal decomposition of Hg species (likely in the GC injector) as a constant mass fraction of the derivatized species is decomposed, leading to the same loss of response from both calibration standards and endogenous analyte, independent of sample (spike) concentration.
Conclusion
This study illustrates that SPME-GC-FAPES is a suitable technique for organomercury speciation. The use of NaBPr4
with the proposed system proved to be more sensitive and faster than with NaBPh4, due to the higher volatility of the
propylated species. Use of NaBPh4 did not provide a
sufficiently sensitive approach for speciation analysis of mercury in real samples, although its coupling with detection by atomic fluorescence would eliminate this shortcoming.
Table 4 Analytical results for the determination of mercury species in certified reference materials
NaBPr4a Certified valueb
MeHg1 EtHg1 Hg21 Total Hgc MeHg1 Total Hg
DORM-2 4.37 ¡ 0.07 vLOD 0.25 ¡ 0.01 4.62 ¡ 0.07 4.47 ¡ 0.32 4.64 ¡ 0.26 DOLT-2 0.69 ¡ 0.04 vLOD 1.34 ¡ 0.07 2.03 ¡ 0.08 0.693 ¡ 0.053 2.14 ¡ 0.28 TORT-2 0.16 ¡ 0.02 vLOD 0.13 ¡ 0.01 0.29 ¡ 0.02 0.152 ¡ 0.013 0.27 ¡ 0.068
aMean and standard deviation for three independent standard additions analyses of separately prepared test samples.bUncertainty reflects 95%
confidence interval.cSum of MeHg1, EtHg1and Hg21.
Fig. 4 Typical chromatogram from a derivatized fish tissue (DOLT-2) extract obtained using NaBPr4 as the derivatizing agent and
SPME-GC-FAPES detection of (A) Hg0, (B) MeHg1 and (D) Hg21. All
All derivatization agents are now commercially available. Among them, NaBPh4is the least expensive, but the cost of
NaBPr4 is about 50% higher than that of NaBEt4. Both
NaBPr4and NaBPh4are more stable than NaBEt4, but after a
long storage time (1 month) they also become inactive.22,26
In-situ derivatization and extraction conditions using
NaBPr4are similar to those for NaBEt4; the main advantages
of this reagent over NaBEt4 include the possibility of
determination of all three species of mercury (inorganic, methyl- and ethylmercury) simultaneously, with better limits of detection under more robust conditions. These character-istics make the use of NaBPr4 an attractive alternative for
derivatization of mercury species in biological matrices.
Acknowledgements
P.G. thanks the Brazilian National Research Council and NRC-Canada for financial support while in Canada.
References
1 M. Azenha and M. T. Vasconcelos, Anal. Chim. Acta, 2002, 458(1), 231–239.
2 Y. K. Chau, F. Yang and M. Brown, Anal. Chim. Acta, 1997, 338(1–2), 51–55.
3 H. Emteborg, J. Snell, J. Qian and W. Frech, Chemosphere, 1999, 39(7), 1137–1152.
4 R. G. Fernandez, M. M. Bayon, J. I. Garcia Alonso and A. Sanz Medel, J. Mass Spectrom., 2000, 35(5), 639–646.
5 M. Heisterkamp and F. C. Adams, Fresenius’ J. Anal. Chem., 1998, 362(5), 489–493.
6 Y. Cai, R. Jaffe and R. Jones, Environmental Sci. Technol., 1997, 31(1), 302–305.
7 S. Rapsomanikis, Analyst, 1994, 119, 1429–1439.
8 S. Rapsomanikis, O. F. X. Donard and J. H. Weber, Anal. Chem., 1986, 58, 35–37.
9 L. Lambertsson, E. Lundberg, M. Nilsson and W. Frech, J. Anal.
At. Spectrom., 2001, 16(11), 1296–1301.
10 J. Leenaers, W. Van Mol, H. Goenaga Infante and F. C. Adams,
J. Anal. At. Spectrom., 2002, 17, 1492–1497.
11 N. Demuth and K. G. Heumann, Anal. Chem., 2001, 73(16), 4020– 4027.
12 Y. Cai, S. Monsalud, K. G. Furton, R. Jaffe and R. D. Jones,
Appl. Organomet. Chem., 1998, 12(8–9), 565–569.
13 Y. Cai, S. Monsalud, R. Jaffe and R. D. Jones, J. Chromatogr. A, 2000, 876(1–2), 147–155.
14 S. Aguerre, C. Bancon Montigny, G. Lespes and M. Potin Gautier, Analyst, 2000, 125(2), 263–268.
15 C. Bancon Montigny, G. Lespes and M. Potin Gautier, Analyst, 1999, 124(8), 1265–1270.
16 C. Carlier Pinasseau, G. Lespes and M. Astruc, Talanta, 1997, 44(7), 1163–1171.
17 R. Eiden, H. F. Scholer and M. Gastner, J. Chromatogr. A, 1998, 809(1–2), 151–157.
18 R. Morabito, P. Massanisso and P. Quevauviller, Trends Anal.
Chem., 2000, 19(2–3), 113–119.
19 J. Carpinteiro, I. Rodriguez and R. Cela, Fresenius’ J. Anal.
Chem., 2001, 370(7), 872–877.
20 V. Luckow and H. A. Russel, J. Chromatogr. A, 1978, 150, 187– 194.
21 M. L. Mena, C. W. McLeod, P. Jones, A. Withers, V. Minganti, R. Capelli and P. Quevauviller, Fresenius’ J. Anal. Chem., 1995, 351, 456–460.
22 V. Minganti, R. Capelli and R. De Pellegrini, Fresenius’ J. Anal.
Chem, 1995, 351, 471–477.
23 M. Abuin, A. M. Carro and R. A. Lorenzo, J. Chromatogr. A, 2000, 889(1-2), 185–193.
24 H. E. L. Palmieri and L. V. Leonel, Fresenius’ J. Anal. Chem., 2000, 366(5), 466–469.
25 Y. Cai, S. Monsalud and K. G. Furton, Chromatographia, 2000, 52(1–2), 82–86.
26 T. De Smaele, L. Moens, R. Dams, P. Sandra, J. Van der Eycken and J. Vandyck, J. Chromatogr. A, 1998, 793, 99–106.
27 P. Schubert, E. Rosenberg and M. Grasserbauer, Fresenius’
J. Anal. Chem., 2000, 366(4), 356–360.
28 C. L. Arthur and J. Pawliszyn, Anal. Chem., 1990, 62, 2145–2148. 29 Z. Mester, R. E. Sturgeon and J. Pawliszyn, Spectrochim. Acta,
Part B, 2001, 56(3), 233–260.
30 C. M. Tseng, A. De Diego, F. M. Martin, D. Amouroux and O. F. X. Donard, J. Anal. At. Spectrom., 1997, 12(7), 743–750. 31 R. Fischer, S. Rapsomanikis and M. O. Andreae, Anal. Chem.,
1993, 65, 763–766.
32 B. He, G.-b. Jiang and Z.-m. Ni, J. Anal. At. Spectrom., 1998, 13, 1141–1144.
33 H. Emteborg, H. W. Sinemus, B. Radziuk, D. C. Baxter and W. Frech, Spectrochim. Acta, Part B, 1996, 51(8), 829–837. 34 B. He and G. B. Jiang, Fresenius’ J. Anal. Chem., 1999, 365(7),
615–618.
35 I. Valimaki and P. Peramaki, Mikrochim. Acta, 2001, 137(3–4), 191–201.
36 Y. Cai, R. Jaffe, A. Alli and R. D. Jones, Anal. Chim. Acta, 1996, 334(3), 251–259.
37 L. Liang, M. Horvat, E. Cernichiari, B. Gelein and S. Balogh,
Talanta, 1996, 43(11), 1883–1888.
38 J. Holz, J. Kreutzmann, R. D. Wilken and R. Falter, Appl.
Organomet. Chem., 1999, 13(10), 789–794.
39 E. Ramalhosa, S. R. Segade, E. Pereira, C. Vale and A. Duarte,
J. Anal. At. Spectrom., 2001, 16(6), 643–647.
40 S. Aguerre, G. Lespes, V. Desauziers and M. Potin Gautier,
J. Anal. At. Spectrom., 2001, 16(3), 263–269.
41 C. S. Chiou, S. J. Jiang and K. S. K. Danadurai, Spectrochim.
Acta, Part B, 2001, 56(7), 1133–1142.
42 H. Garraud, M. Robert, C. R. Quetel, J. Szpunar and O. F. X. Donard, At. Spectrosc., 1996, 17(5), 183–185.
43 C. Gerbersmann, M. Heisterkamp, F. C. Adams and J. A. C. Broekaert, Anal. Chim. Acta, 1997, 350(3), 273–285. 44 H. Emteborg, E. Bjorklund, F. Odman, L. Karlsson,
L. Mathiasson, W. Frech and D. C. Baxter, Analyst, 1996, 121(1), 19–29.
45 M. S. Jimenez and R. E. Sturgeon, J. Anal. At. Spectrom., 1997, 12(5), 597–601.
46 W. Frech, J. Snell and R. E. Sturgeon, J. Anal. At. Spectrom., 1998, 13, 1347–1353.
47 P. Grinberg, R. C. Campos, Z. Mester and R. E. Sturgeon,
Spectrochim. Acta, Part B, 2003, 58, 427–441.
48 P. J. Craig, Organometallic Compounds in the Environment,
Principles and Reactions,, Longman, Harlow, 1986.
49 N. S. Bloom, Can. J. Fish. Aquat. Sci., 1989, 46, 1131–1140. 50 K. C. Bowles and S. C. Apte, Anal. Chem., 1998, 70(2), 395–399. 51 V. Pavski, C. L. Chakrabarti and R. Sturgeon, J. Anal. At.
Spectrom, 1994, 9, 1399–1403.
52 Y. Cai and J. M. Bayona, J. Chromatogr. A, 1995, 696, 113–122. 53 M. K. Donais, P. C. Uden, M. M. Schantz and S. A. Wise, Anal.
Chem., 1996, 68, 3859–3866.
54 H. Hintelmann, D. Evans and J. Y. Villeneuve, J. Anal. At.
Spectrom, 1995, 10, 619–624.
55 Y. Cai, G. Tang, R. Jaffe and R. Jones, Int. J. Environ. Anal.
Chem., 1997, 68(3), 331–345.
56 L. Moens, T. DeSmaele, R. Dams, P. VandenBroeck and P. Sandra, Anal. Chem., 1997, 69(8), 1604–1611.
57 L. Yang, Z. Mester and R. Sturgeon, J. Anal. At. Spectrom., 2003, 18, 431–436.
58 R. E. Sturgeon, S. N. Willie, V. T. Luong and S. S. Berman, Anal.
Chem., 1990, 62, 2370–2376.
59 H. Hintelmann, R. Falter, G. Ilgen and R. D. Evans, Fresenius’
J. Anal. Chem., 1997, 358(3), 363–370.
60 H. Hintelmann, Chemosphere, 1999, 39(7), 1093–1105.
61 I. R. Pereiro, A. Wasik and R. Lobinski, J. Anal. At. Spectrom., 1998, 13(8), 743–747.