HAL Id: hal-01560915
https://hal.archives-ouvertes.fr/hal-01560915
Submitted on 12 Jul 2017HAL is a multi-disciplinary open access archive for the deposit and dissemination of sci-entific research documents, whether they are pub-lished or not. The documents may come from teaching and research institutions in France or abroad, or from public or private research centers.
L’archive ouverte pluridisciplinaire HAL, est destinée au dépôt et à la diffusion de documents scientifiques de niveau recherche, publiés ou non, émanant des établissements d’enseignement et de recherche français ou étrangers, des laboratoires publics ou privés.
Mercury(II) Trace Detection Using a Glassy Carbon
Electrode Functionalized by Chemically Prepared Gold
Nanoparticles. Influence of Coating Process on Surface
Reactivity and Analytical Performances
Eugénie Granado, Emelyne Gervais, Guillaume Gotti, Sandrine Desclaux,
Martine Meireles, Pierre Gros, David Evrard
To cite this version:
Eugénie Granado, Emelyne Gervais, Guillaume Gotti, Sandrine Desclaux, Martine Meireles, et al.. Mercury(II) Trace Detection Using a Glassy Carbon Electrode Functionalized by Chemically Pre-pared Gold Nanoparticles. Influence of Coating Process on Surface Reactivity and Analytical Per-formances. International Journal of Electrochemical Science, ESG 2017, vol. 12, pp. 6092-6107. �10.20964/2017.07.44�. �hal-01560915�
O
pen
A
rchive
T
OULOUSE
A
rchive
O
uverte (
OATAO
)
OATAO is an open access repository that collects the work of Toulouse researchers and makes it freely available over the web where possible.
This is an author-deposited version published in : http://oatao.univ-toulouse.fr/
Eprints ID : 18014
To link to this article : DOI: 10.20964/2017.07.44 URL : http://dx.doi.org/10.20964/2017.07.44
To cite this version : Granado, Eugénie and Gervais, Emelyne and Gotti, Guillaume and Desclaux, Sandrine and Meireles, Martine and Gros, Pierre and Evrard, David Mercury(II) Trace Detection Using
a Glassy Carbon Electrode Functionalized by Chemically Prepared Gold Nanoparticles. Influence of Coating Process on Surface Reactivity and Analytical Performances. (2017) International
Journal of Electrochemical Science, vol. 12. pp. 6092-6107. ISSN 1452-3981
Any correspondence concerning this service should be sent to the repository administrator: staff-oatao@listes-diff.inp-toulouse.fr
DOI: 10.20964/2017.07.44
Mercury(II) Trace Detection Using a Glassy Carbon Electrode
Functionalized by Chemically Prepared Gold Nanoparticles.
Influence of Coating Process on Surface Reactivity and
Analytical Performances
Eugénie Granado, Emelyne Gervais, Guillaume Gotti, Sandrine Desclaux, Martine Meireles, Pierre Gros, David Evrard*
Laboratoire de Génie Chimique, Université de Toulouse, CNRS, INPT, UPS, Toulouse, France
*
E-mail: evrard@chimie.ups-tlse.fr
An electrochemical sensor dedicated to Hg(II) trace detection was elaborated based on a gold nanoparticles (AuNPs) modified glassy carbon (GC) electrode. AuNPs were prepared using the Turkevich method and deposited on GC by drop casting. Different protocols including suspension filtration and evaporation temperature control were tested and their influence both on coating morphology and electrochemical activity assessed. From structural characterization, it can be concluded that neither the filtration step nor the drop evaporating temperature have a significant impact on coating morphology at the mesoscale level. However, regarding to the electrochemical activity of the functionalized electrodes, results showed that when some heterogeneities due to (AuNPs) aggregation were present in the coating, the electrochemical activity was reduced. Contrary to what was observed in our previous studies dealing with electrodeposited AuNPs, cycling an AuNPs-GC electrode in H2SO4 lead in all cases to a decrease in active surface area and in a higher density of
surface defects, thus revealing a higher surface reactivity of chemically-synthesized AuNPs. The electrochemical activation procedure was found to influence the analytical performances of the functionalized electrode with respect to Hg(II) assay in the picomolar range, but not in the nanomolar range, as a consequence of a saturated concentration effect. A linear concentration range was obtained between 2 and 12 pM with a normalized sensitivity of 0.296 µA pM-1 min-1 using square wave anodic stripping voltammetry (SWASV) as the detection mode. A limit of detection (LOD) down to 1 pM was reached.
Keywords: Chemically prepared gold nanoparticles; drop-casting; deposit morphology;
1. INTRODUCTION
Since the middle of the 20th century, heavy metals represent a growing environmental [1,2] and health [3,4] problem. They are considered to be a major ecological issue due to their wide dispersion in natural media [5], including fresh and marine waters, air and soils [6]. Heavy metals mainly originate from human activities, namely atmospheric emissions from coal-burning plants, smelters, waste incinerators, process waste from mining, industrial and urban runoff, and so on [7,8]. Once released into the environment, they are a persistent threat for decadal or even longer time scales since they are not biodegradable.
Amongst all heavy metals, mercury (Hg) is of particular interest and global importance. Hg is present in natural media as inorganic and organometallic species, the latter one being the toxic and bioaccumulating methylmercury (MeHg) form [9,10]. Acute MeHg exposure can cause adverse health effects for mammals including humans, such as eyesight problems, trembling, paresthesia or ataxia [11,12]. Chronic MeHg exposure, even at lower levels, has been related to developmental neurotoxicity of the fetus and is thus far considered to be the most critical endpoint [13]. MeHg production relies on the concentration and (bio-)availability of inorganic Hg(II) [14]. Due to the bioaccumulation phenomena, this latter may be dangerous even at very low levels [9,15,16]. Consequently, the World Health Organization has delivered a guideline value of 1 µg L-1 (ca. 5 nM) for drinking water [17]. In Europe, the implementation of the European Water Framework Directive [18] requires all states to monitor hazardous substances in surface, ground and coastal waters throughout Europe. Thus, there is an urgent need for in situ, real-time and highly-sensitive Hg(II) sensors in order to multiply monitoring points dedicated to early warning pollution alert [19].
Hg(II) traces are routinely quantified in analytical laboratories by spectroscopic techniques such as cold-vapor atomic absorption spectrometry or cold-vapor atomic fluorescence spectrometry [20-22]. This latter offers selectivity and quite good sensitivity, reaching 0.2 pM for total Hg(II) [23]. However, these techniques suffer important limitations since they involve expensive material and require complex and time-consuming procedures, thus limiting any in situ or on line and operando analysis. Moreover, rigorous sampling and storage conditions are necessary to avoid any external Hg contamination or speciation changes [24,25].
In this context, electrochemistry affords an interesting alternative due to its manifold advantages over other detection techniques: electrochemical devices are usually cheap, user-friendly, require only few energy and simple procedures. They are also mostly reagentless and well-suited for miniaturization and automatic in situ measurements with minimal sample changes, and quite fast analyses may be achieved with experimental data obtained in real time or with a few minutes time-lag. Finally, limits of detection (LOD) in the pM range can be reached using a combination of a preconcentration step like anodic stripping voltammetry (ASV) and pulsed techniques such as differential pulse (DPV) or square wave voltammetry (SWV) [26,27]. Another strategy for the improvement of the analytical performances concerns electrode surface functionalization. The wide range of possibilities reported in the literature has been recently reviewed [27,28]. Amongst all modifiers, gold nanoparticles (AuNPs) have received a particular attention with respect to Hg(II) trace determination [29-33]. This is mainly due to the fact that Au exhibits a strong affinity for Hg that
enhances the preconcentration effect and to the specific physicochemical properties of nanoparticles (NPs) [34]. These include enhanced diffusion rate of electroactive species based on high effective surface area of NPs, catalytic activity, higher signal-to-noise ratio and unique optical properties [35]. AuNPs may be prepared either via chemical route [36,37] followed by physicochemical deposition onto the electrode surface or by direct electrodeposition [38,39]. In the latter case, AuNPs are often electrodeposited using a given electrochemical method without providing any justification nor checking the influence of the deposit morphology on Hg(II) detection [30-32]. On the contrary, we have recently reported on Hg(II) trace determination on a GC electrode (AuNPs-GC) functionalized by AuNPs deposited using cyclic voltammetry [40], and proved the analytical performances to be strongly correlated to both the density and size of the NPs, the best responses being obtained on AuNPs-GC electrodes exhibiting high density of rather small, spherical-shaped NPs. This was further verified by studying different AuNPs electrodeposition modes, namely constant potential electrolysis (CPE) and potentiostatic double pulse (PDP) [41]. In this latter work, it was shown that the best results in terms of LOD were obtained with AuNPs electrodeposited onto GC by CPE. In order to further optimize the analytical performances, we also examined the physicochemical phenomena which occur at the electrode/solution interface during SWASV and showed that chloride anions adsorption on Au surface was a key parameter [42]. As a consequence, further improvement was brought by adding a chloride desorption step in the analytical procedure and the applicability of the AuNPs-GC electrode to Hg(II) trace analysis in natural waters was demonstrated [43]. In particular, a Hg(II) value of 19 pM was measured using the AuNPs-GC electrode for a submarine groundwater discharge sample, and confirmed by CV-AFS. In the case of chemically prepared AuNPs, the use of soundly chosen, complicated capping ligand such as polystyrenesulfonate doped poly(hydroxymethyl 3,4-ethylenedioxythiophene) [44] or 1,2-bis[5,2-thiolmethyl-sulphide-1,3,4-oxadiazol-2-yl]-ethane [33] is often required to ensure AuNPs stabilization and adsorption onto the electrode surface. In an alternative strategy, Li et al. have taken advantage of the highly porous feature of the specific three-dimensional fibril-like carbon fiber mat substrate (CFME) [32] to adsorb their chemically-prepared AuNPs. Finally, the group of Mandler has operated a pretreatment to indium-tin oxide substrates by dipping the electrodes in polyethylenimine prior to colloidal AuNPs deposition [45]. However, none of these works provide any information correlating the deposits morphology and the analytical performances with respect to Hg(II) trace determination.
In the present work, we explore a simple procedure to functionalize GC electrodes by colloidal AuNPs. These latter were prepared by using the classical method described by Turkevich [46] and refined by Frens [47]. The resulting AuNPs were then filtered and deposited onto GC by simple drop-casting at different temperatures. The corresponding AuNPs-GC electrodes were characterized by CV in H2SO4, Pb underpotential deposition (UPD) and field emission gun scanning electron microscopy
(FEG-SEM), and their response to low Hg(II) concentration examined. In particular, a correlation between the activation step of the AuNPs and the sensitivity of the functionalized electrode was evidenced. Finally, a comparison with our previous results obtained using electrodeposited AuNPs and other reports from the literature was provided.
2. EXPERIMENTAL
2.1. Chemicals and apparatus
All the solutions were prepared using ultra-pure water (Milli-Q Millipore, 18.2 MΩ cm). HAuCl4·3H2O (pro analysis grade) was purchased from Acros Organics. Trisodium citrate
(C6H5Na3O7) anhydrous was obtained from Alfa Aesar. 95 % H2SO4 (normapur grade) was supplied
by VWR Prolabo. 30 % HCl and NaNO3 (suprapur grade) were obtained from Merck. A standard
stock solution of 4.99 ± 0.01 µM Hg(II) was prepared by dilution of 1001 ± 2 mg L-1 Hg(NO3)2 NIST
standard solution (certiPUR grade, Merck) and acidified to pH 2 with concentrated 65 % HNO3
(suprapur grade, Merck), and then used as it for further dilution.
All the electrochemical experiments were performed at room temperature in a classical three-electrode glass cell (Metrohm) by using a µ-Autolab II potentiostat (Metrohm Autolab, Utrecht, Netherlands) interfaced to a personal computer and controlled with GPES 4.9 software package (Metrohm). A Metrohm Ag/AgCl/KCl 3 M electrode, separated from the electrochemical cell by a Teflon PTFE capillary containing a 0.1 M NaNO3 solution and terminated by a ceramic diaphragm (D
type), and a Metrohm glassy carbon (GC) wire were used as reference and counter electrodes, respectively. Working electrodes were GC rotating disk electrodes from Radiometer (3 mm diameter, A = 7.07 mm2) or AuNPs-modified GC (AuNPs-GC). The electrochemical cell was maintained in a Faraday cage in order to minimize the electrical interferences. When necessary, working electrodes were rotated using a rotating system Model EDI 101 interfaced to a CTV 101 speed control unit from Radiometer. When indicated, the solutions were deaerated using a N2 stream for 10 min. A N2
atmosphere was then maintained over the solution during the corresponding experiments.
Total Hg analyses were performed by cold-vapor atomic fluorescence spectrometry (CV-AFS) following a method from the Environmental Protection Agency (EPA-1631) that was extensively described in one of our previous work [43].
2.2. AuNPs synthesis and filtration
Gold nanoparticles were prepared using a previously reported procedure [48], in accordance with the classical method described by Turkevich [46] and refined by Frens [47]. Briefly, 22 mg (8.5×10⁻⁵ mol) of sodium citrate was dissolved in 30 mL of Milli-Q water. The solution was heated under reflux and 20 mL of an aqueous solution of HAuCl4 (9.9 mg, 2.5×10⁻⁵ mol) was quickly added.
The mixture was kept under reflux for 20 min and then cooled to room temperature to afford a ruby red solution. Because nanoparticles are prone to aggregate in suspension even when a stabilizer such sodium citrate is present in solution, for some experiments the suspension was filtered using a 0.45-µm cutoff polyethersulfone membrane filter (VWR) prior to drop-casting in order to assess the influence of the occurrence of aggregation in the suspension on the deposit morphology.
2.3. Electrode preparation and modification
All the working electrodes were carefully polished prior to use. They were first polished by silicon carbide grinding paper (grit 1200) for 10 s. GC surfaces were further polished successively by a 9 µm, 3 µm, 1 µm and 0.25 µm diamond suspension (Presi) on a cloth polishing pad during 2 min for each size. Between each polishing step, the surfaces were cleaned with Milli-Q water. Finally, the electrodes were rinsed in an ultrasonic 96 % ethanol bath (three times for 10 min) and cleaned with Milli-Q water. After drying, the quality of the polishing step was verified by checking the surface state using a Nikon Eclipse LV150 optical microscope.
Electrode functionalization was achieved by using the drop-casting technique. Briefly, 50 µL of the colloidal AuNPs solution was dropped on the GC surface and evaporated overnight either at room temperature or in an oven at 100 °C. All the electrodes were then carefully rinsed using Milli-Q water and then activated by cyclic voltammetry between 0.2 and 1.4 V in a deaerated 0.5 M H2SO4 solution.
2.4. AuNPs characterization
AuNPs were characterized by transmission electronic microscopy (TEM) at the Centre de Microscopie Electronique Appliquée à la Biologie (CMEAB, Toulouse) using a HT 7700 Hitachi equipment with an accelerating voltage of 80 kV. Average diameter measurements were carried out by micrograph analysis with Origin 8, using between 1500 and 3000 nanoparticles for each sample.
Zeta potentials were obtained from electrophoretic measurements on a Malvern Zetasizer Nanoseries ZS90 controlled by integrated software. Calculations were performed using the Smoluchowski model [49,50].
The AuNPs-GC surface was characterized by field emission gun scanning electron microscopy (FEG-SEM) at the CMEAB using a Quanta 250 FEG FEI equipment with an accelerating voltage of 5 kV and a working distance between 3 and 8 mm depending on the sample. Image analysis was carried out using a LGC homemade program for particles counting (density estimation) and average diameter measurement developed using MatLab image processing toolbox software.
Pb underpotential deposition (UPD) experiments were conducted in a 0.01 M HClO4 solution
containing 1 mM Pb(NO3)2. A potential step of -0.4 V was applied for 10 s before stripping from -0.35
V to 0.3 V at 50 mV s-1.
2.5. Stripping voltammetric detection of Hg(II)
The analytical procedure dedicated to Hg(II) trace determination was the same as that reported in previous works from our group [40,41], in order direct comparison to be made. Electrochemical detection and assay of Hg(II) on AuNPs-GC electrodes were performed in a deaerated (N2) 0.01 M
HCl solution by using square wave anodic stripping voltammetry (SWASV) in the following conditions: cleaning potential = 0.80 V, cleaning time = 15 s; preconcentration cathodic potential = 0.00 V, preconcentration time = 300 s; pulse amplitude = 25 mV, step amplitude = 5 mV, frequency = 200 Hz; anodic scan from 0.00 to 0.80 V. During the preconcentration step, the solution was stirred by
means of the rotating working electrode (2000 rpm). A second scan was recorded immediately after the first one using the same conditions except the preconcentration time which was set to 30 s, and considered as a blank. Hg oxidation peak heights were measured from the curves obtained after subtraction of the blank. This procedure, called “subtractive ASV method”, has been previously reported in the literature [51]. It allows the analytical results to be released from background vagaries. It is noteworthy that the subtractive anodic signals recorded with low Hg(II) concentrations were noisy so that the use of a Savitzky-Golay smoothing function was required.
3. RESULTS AND DISCUSSION
3.1. AuNPs synthesis and characterization
Table 1. Physicochemical characterization of AuNPs prepared using the Turkevich method before and
after filtration of the colloidal solution by using a 0.45-µm cutoff polyethersulfone membrane filter.
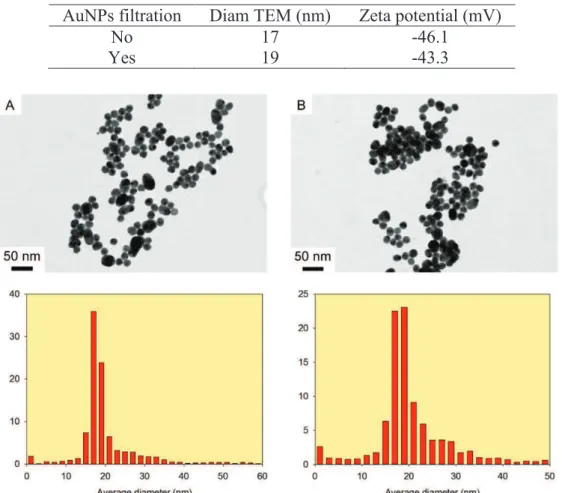
AuNPs filtration Diam TEM (nm) Zeta potential (mV)
No 17 -46.1
Yes 19 -43.3
Figure 1. TEM micrographs and corresponding size distribution of AuNPs prepared using the
Turkevich method and (A) unfiltered, (B) filtered after synthesis.
Figure 1 depicts the TEM micrographs of AuNPs before and after filtration and their corresponding size distribution (Table 1). Micrographs showed a gaussian size distribution of spherical NPs with a 18 nm average diameter in both case. One can notice a very small proportion of ovale objects which could correspond to the aggregation of small nuclei. Zeta potential calculations gave a
value of -46.1 mV and -43.3 mV respectively. Together with the size distribution, these results comfort the idea that the synthesis ensure a dispersion containing a large proportion of spherical NPs stable in solution. Moreover, the filtration step proved not to affect the NPs.
3.2. AuNPs-GC electrodes characterization
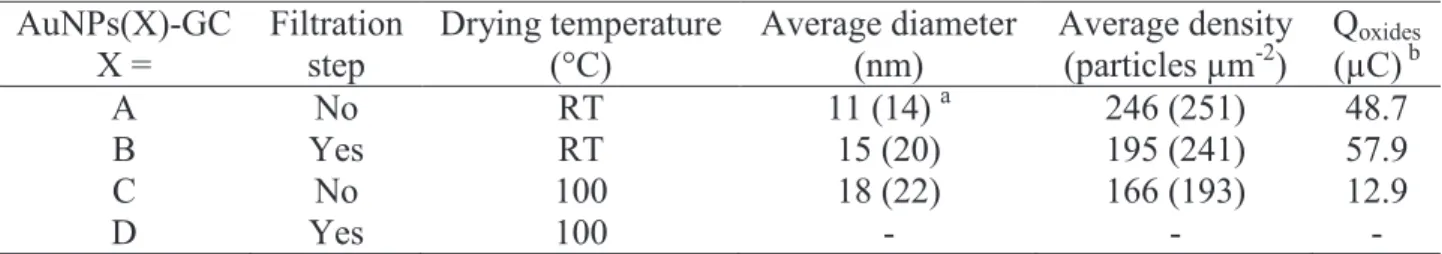
Table 2. Characterization of the AuNPs deposited onto the GC electrode surface by drop-casting.
AuNPs(X)-GC X = Filtration step Drying temperature (°C) Average diameter (nm) Average density (particles µm-2) Qoxides (µC) b A No RT 11 (14) a 246 (251) 48.7 B Yes RT 15 (20) 195 (241) 57.9 C No 100 18 (22) 166 (193) 12.9 D Yes 100 - - - a
Numbers in brackets correspond to values obtained including the dense beads.
b
Qoxides corresponds to the amount of charge consumed during the reduction of Au oxides (peak around
0.9 V) produced by CV in 0.5 M H2SO4 (scan rate: 100 mV s-1).
Figure 2. (A, B, C) FEG-SEM images of (A, C) unfiltered and (B) filtered AuNPs drop-casted onto
GC electrode surface. Temperature used for the deposition: (A, B) room temperature; (C) 100°C. (D) Lead UPD in 0.1 M HClO4 (scan rate: 50 mV s-1).
Once characterized, both unfiltered and filtered AuNPs were deposited onto glassy carbon (GC) electrode substrates by using the drop-casting technique according to two different protocols: in the former one, the colloidal solution drop was left to dry at room temperature overnight; in the second one, the drying step was operated overnight in a stove at a given temperature of 100 °C. For the sake of clarity, the 4 different resulting deposits will be referred to as AuNPs(X)-GC with X = A, B, C and D as stated in Table 2. The AuNPs(X)-GC deposits were characterized by field emission gun scanning electron microscopy (FEG-SEM) and cyclic voltammetry (CV) in a deaerated 0.5 M H2SO4 solution.
Table 2 summarizes the corresponding results.
AuNPs(A) formed a dense deposit onto GC with big beads of NPs, resulting in a non-homogeneous distribution of the deposit over the entire surface (Fig. 2A). Calculations were undertaken including and excluding these bead structures, producing two sets of values (see Table 2 for features). The values obtained for NPs diameter and density were systematically higher while including the bead structures, but remained in the same order of magnitude when compared to the data set for which they are excluded. AuNPs(B)-GC deposits exhibited an almost similar morphology, however with a slightly lower NPs density. Less and smaller beads were observed in this case (Fig. 2B). Contrary to the former two deposits, AuNPs(C)-GC electrode showed significantly lower NPs density and no beads (Fig. 2C). Note that the large, bright objects in the middle of the micrograph are NaCl crystals from salt remaining in solution after NPs synthesis. These different observations may be accounted for considering the high evaporation rate associated with the drying procedure. The deposit lacked homogeneity, especially in the vicinity of the NaCl crystals where AuNPs aggregated. Finally, it has to be noticed that AuNPs(D) which were filtered after synthesis and deposited at 100 °C did not allow any exploitable FEG-SEM image nor voltammogram to be recorded. This experiment was repeated several times with a similar result, the reason for such a behavior remaining unclear to us.
In order to get more information upon AuNPs structuration, Pb underpotential deposition (UPD) experiments were performed in 0.1 M HClO4 on AuNPs(X)-GC (X = A, B, C) (Fig. 2D). All
three stripping voltammograms showed comparable shapes. AuNPs(C)-GC afforded much lower currents than AuNPs(A)-GC and AuNPs(B)-GC, in accordance with the corresponding deposit morphology observed by FEG-SEM: a less dense deposit of bigger NPs is expected to afford a lower active surface area. For all three deposits, a well-defined peak around -0.25 V associated to a shoulder was recorded. This split system is typical of (111)-oriented terraces with different size domains, the peak being commonly associated to wide Au(111) faces, whereas the shoulder is indicative of narrower Au(111) domains. Another broad signal centered around -0.05 V was noticed, which corresponds to Au(110) faces. It has to be noticed that, whatever the deposit to be considered, no signal characteristic of Au(100) faces was recorded in the potential range from -0.2 to -0.1 V. Thus, nor the filtration step neither the drop-casting temperature seemed to have a significant influence on the AuNPs crystallographic structure.
All the deposits were then activated by CV in a deaerated 0.5 M H2SO4 solution. Fig. 3A
depicts the 10th and 60th consecutive cyclic voltammograms (CVs) recorded for AuNPs(X)-GC (X = A, B, C). After 10 cycles, AuNPs(A)-GC exhibited the typical shape for such a CV at potentials higher than 1.1 V, with several oxidation peaks corresponding to the formation of different kinds of Au oxides (solid, blue line). However, another oxidation peak was also noticed at lower potential, ca. 1.05
V. This latter peak, which was significantly smaller than those at higher potentials, was assigned by Angerstein-Kozlowska et al. [52] and the group of Compton [53] to the formation of a sublattice of OH species deposited between specifically adsorbed anions. It is noteworthy that this peak (referred to as “OA1” following the nomenclature proposed by Angerstein-Kozlowska et al.), the appearance of which was random, had never been observed in our previous studies dealing with electrodeposited AuNPs [40,41,43,54]. Since Kolb et al. reported a correlation between OA1 peak current and the density of surface defects [55,56], this latter observation suggested that chemically prepared AuNPs contain more surface defects than electrochemically generated ones. On the backward scan, the characteristic reduction peak of Au oxides located at 0.92 V was recorded, together with a small, ill-defined post-peak around 0.8 V which actually corresponded to the OA1 oxidation peak. This latter result is also in accordance with the report by Angerstein-Kozlowska et al. [52]. The integration of the reduction peak at 0.92 V Qoxides is reported in Table 2. In the same experimental condition, i.e. 10
consecutive scans, AuNPs(B)-GC electrode afforded a similar CV, but most of the time without the presence of OA1 and its associated reduction peak (solid, red line). It has to be noticed that the shape and location of the oxidation peaks at potentials higher than 1.1 V were always different from that recorded on AuNPs(A)-GC, suggesting different AuNPs surface reactivity. As discussed before, for unfiltered suspensions, some large beads were observed in the resulting deposit. We may infer that the presence of these structures modify in some way the surface reactivity. On the backward scan, the typical reduction peak of Au oxides was present, although at a potential slightly more cathodic (ca. 40 mV) than that recorded on AuNPs(A)-GC.
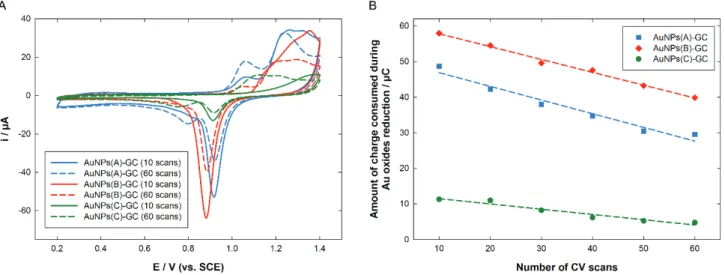
Figure 3. (A) Evolution of the CVs recorded in 0.5 M H2SO4 between 0.2 and 1.4 V at 100 mV s-1 vs.
the number of scans for: (blue) AuNPs(A)-GC; (red) AuNPs(B)-GC; (green) AuNPs(C)-GC. Solid line: 10 scans; dashed line: 60 scans. (B) Evolution of the amount of charge consumed during Au oxides reduction (deduced from integration of the reduction peak around 0.9 V) vs. the number of CV scans.
This latter peak also exhibited systematically higher magnitude (around 19 %, see Qoxides values
in Table 2), indicating a larger active surface area for filtered AuNPs. AuNPs(C)-GC electrode afforded a very different CV (solid, green line). Indeed, only one small, broad peak was noticed in the
region 1.15 – 1.4 V for the formation of Au oxides, with a small reduction peak located at 0.9 V on the backward scan. The corresponding Qoxides value was only 25 % of that of AuNPs(A)-GC. It is worth
noting that the global shape of this CV actually compared better to a bulk Au electrode as reported by the group of Compton [53] than to AuNPs (electro)deposited onto GC. The fact that peak currents were much lower than that of AuNPs(A)-GC and AuNPs(B)-GC was consistent with the FEG-SEM data showing a less dense deposit of bigger AuNPs and confirmed the observation provided by the UPD experiments.
In order to get further information on the three deposits, new series of CV scans were recorded in the same deaerated 0.5 M H2SO4 solution.
Fig. 3A, dashed lines, depicts the 60th scan recorded for each deposit (dashed lines). As can be seen from the comparison between solid and dashed lines for a given deposit, the CV shapes experienced a strong evolution while scanning in acidic medium. For AuNPs(A)-GC, only a single, large peak was recorded around 1.2 V, and the peak current corresponding to OA1 increased. According to Angerstein-Kozlowska et al. [52,57], the increase in OA1 peak current is indicative of a reconstruction process which accompanies the electrooxidation of Au. On the backward scan, the reduction peak around 0.9 V decreased following an almost linear trend of about 60 % (Fig. 3B). This decrease in peak current while cycling is consistent with nanoparticle aggregation and/or Au material loss by Au dissolution that both lead to a decrease in active surface area [58]. As a consequence of the increase of OA1 peak current, the reduction post-peak around 0.8 V also increased. In the case of AuNPs(B)-GC, a similar trend was observed: the oxidation peaks located at potential higher than 1.1 V decreased and the global shape of the CV flattened, whereas a small peak at 1.05 V corresponding to OA1 appeared. On the backward scan, the reduction peak located around 0.9 V decreased of about 45 % (Fig. 3B, red data) while a small post-shoulder corresponding to OA1 oxides reduction appeared. These results compared well with the report by Steven et al. [58] concerning AuNPs of 2.9 and 3.1 nm diameter, which showed a decrease in active surface area while scanning in H2SO4. However, they
significantly differ from the behavior of 4.5 nm diameter AuNPs described in the same work, the electrochemical response of which remained stable over 100 scans in H2SO4. For AuNPs(C)-GC, the
broad oxidation peak shifted to less anodic values and its shape became closer to that observed for AuNPs(A)-GC and AuNPs(B)-GC, whereas the whole peak current remained almost constant. On the backward scan, the reduction peak located at 0.9 V decreased of about 30 % (Fig. 3B, green data) and split, leading to the appearance of a new, broad reduction peak at 0.76 V. Thus, for all three deposits the cycling in H2SO4 proved to have an influence on the surface reactivity. This results contrasts with
what we previously observed in the case of electrodeposited AuNPs [40,41,43], for which the CVs in H2SO4 showed no longer evolution after 10 scans.
Since HSO4- and SO42- anions are known to compete for adsorption with the OH species
involved in Au oxidation [57,59], we also investigated the evolution of the CVs obtained on the different deposits in H2SO4 vs. time. The result for AuNPs(B)-GC is depicted in Fig. 4.
In this case the functionalized electrodes were left in the solution between each scan. Clearly, the evolution of the CVs shape was more marked compared to that observed when cycling continuously. The oxidation peaks located at the highest potentials shifted to lower potential values and their corresponding peak currents decreased, while the OA1 peak strongly increased. This is
indicative of surface rearrangement leading to more surface defects. It is noteworthy that this increase was significantly higher than that recorded upon continuous cycling.
Figure 4. Evolution of the CVs recorded with AuNPs(B)-GC in 0.5 M H2SO4 at 100 mV s-1 vs. time.
On the backward scan, the peak around 0.9 V decreased and the second reduction peak around 0.8 V appeared, the overall peak area remaining nearly constant over the experiment. This latter peak slowly shifted to more cathodic value with time, ca. from 0.77 V to 0.70 V between 1.5 and 4.5 hours. Thus, the way the activation of AuNPs deposits onto GC by scanning in H2SO4 is performed has a
strong impact on the NPs surface reactivity since an evolution of the CVs was noticed vs. both the number of scans recorded and the duration of the dipping in the solution. Keeping in mind that no stabilization of the resulting electrochemical response was obtained even after 100 scans, the activation conditions were expected to strongly impact the analytical performances of the chemically prepared AuNPs deposits towards Hg(II).
3.3. Hg(II) trace determination and assay
The response of AuNPs(X)-GC electrodes (X = A, B, C) towards increasing amounts of Hg(II) was examined in 0.01 M HCl solution, using a SWASV procedure the optimized parameters of which were described in a previous study [41]. For the sake of comparison with this latter work, the AuNPs activation process was performed by running 10 scans in a 0.5 M H2SO4 solution between 0.20 and
1.40 V at a scan rate 100 mV s-1. Fig. 5 depicts the SWASV signals obtained on AuNPs(B)-GC.
The peak observed around 0.67 V corresponded to preconcentrated Hg(0) reoxidation in Hg(II). Compared to our previous results on electrodeposited AuNPs [40,41], the signal was much broader and located at slightly higher potential (ca. 0.1 V anodic shift). Moreover, the peak potential shifted to more anodic values while increasing the Hg(II) amount in the solution, and a pre-peak
shoulder concomitantly appeared around 0.6 V. Both phenomena were not observed in the case of electrodeposited AuNPs [40,41,43].
Figure 5. SWASV responses obtained in a 0.01 M HCl solution for increasing Hg(II) concentrations
(blank subtracted) on a AuNPs(B)- p vs. [Hg(II)] and corresponding
linear regression.
The amperometric response followed a linear trend with respect to Hg(II) concentration up to 3.6 nM, after what it became nearly constant, suggesting a saturation effect of the active surface area of the NPs (Fig. 5, inset). From the slope of the calibration plot, the normalized sensitivity of AuNPs(B)-GC electrode was found to be 0.49 µA nM-1 min-1. This is a little more than twice better than the value obtained in our previous work with electrodeposited AuNPs and using exactly the same experimental conditions (ca. 0.23 µA nM-1 min-1) [41]. Thus, given the AuNPs exhibited similar diameter using both preparation methods but higher density when electrodeposited, this result suggested a much higher reactivity towards Hg(II) in the case of chemically prepared AuNPs. It has to be noticed that varying the AuNPs activation parameters (i.e. total number of CVs in H2SO4) did not
allow any significant change in the amperometric response towards Hg(II) in the nM range to be observed (not shown). AuNPs(A)-GC and AuNPs(C)-GC afforded comparable analytical performances (not shown), which may be surprising since the active surface area of the three deposits were very different (see Qox values in Table 2 and discussion above). This may be accounted for
considering that in this Hg(II) concentration range, the electrode surfaces were all three close to saturation.
These results together with the latter consideration encouraged us to check the amperometric response of the functionalized electrodes in the pM range. The results obtained for AuNPs(A)-GC are given in Figure 6.
In this concentration range, the impact of the activation parameters was much more marked, this latter showing a strong influence both on the linear range and on the normalized sensitivity. It was
not possible to provide error bars in this concentration range due to a slight increase in Hg(0) reoxidation peak current while repeating measurements (not shown). This phenomenon suggests that all the deposited Hg is not redissolved during the stripping step.
Figure 6. Calibration plots obtained in the pM range on AuNPs(B)-GC electrode activated by using
various number of cyclic scans in 0.5 M H2SO4.
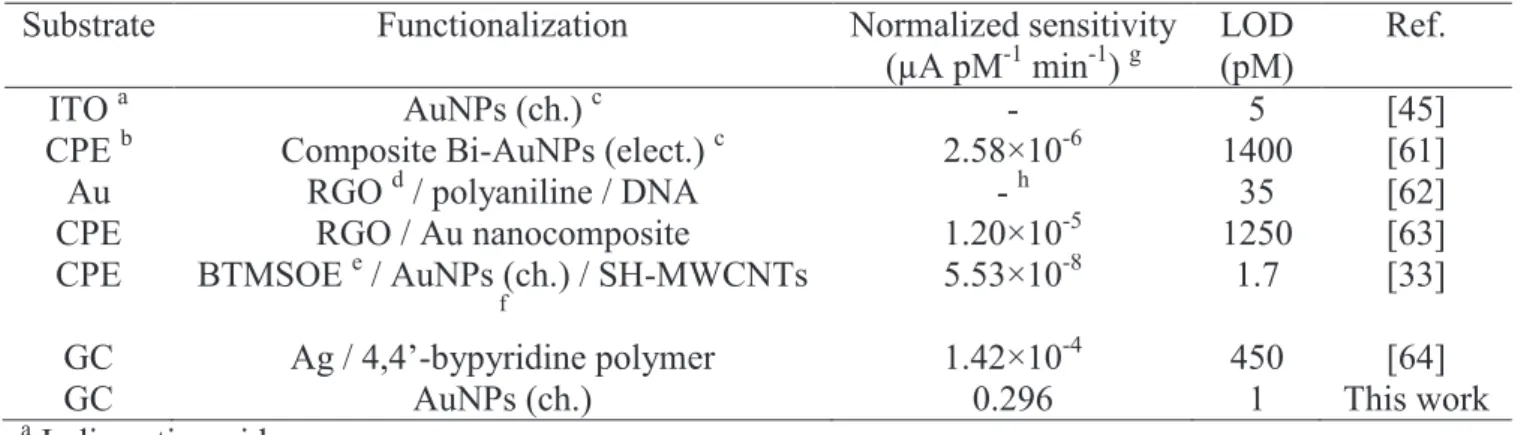
Table 3. Comparison of the analytical performances of electrochemical sensors with respect to Hg(II)
trace detection.
Substrate Functionalization Normalized sensitivity (µA pM-1 min-1) g
LOD (pM)
Ref.
ITO a AuNPs (ch.) c - 5 [45]
CPE b Composite Bi-AuNPs (elect.) c 2.58×10⁻⁶ 1400 [61] Au RGO d / polyaniline / DNA - h 35 [62] CPE RGO / Au nanocomposite 1.20×10⁻⁵ 1250 [63] CPE BTMSOE e / AuNPs (ch.) / SH-MWCNTs
f
5.53×10⁻⁸ 1.7 [33]
GC Ag / 4,4’-bypyridine polymer 1.42×10⁻⁴ 450 [64]
GC AuNPs (ch.) 0.296 1 This work
a
Indium-tin oxide.
b
Carbon paste electrode.
c
(ch.) stands for “chemically prepared AuNPs”; (elect.) stands for “electrochemically generated AuNPs”.
d
Reduced graphene oxide.
e
1,2-bis[5,2-thiolmethyl-sulphide-1,3,4-oxadiazol-2-yl]-ethane.
f
(3-mercaptopropyl) trimethoxysilane-multi-walled carbon nanotubes.
g
The value of the normalized sensitivity was obtained by dividing the slope of the linear response by the preconcentration time.
h
From the analysis of the different calibration plots on Fig. 6, one may invoke a bell-shape influence of the number of activation scan on the amperometric response of AuNPs(A)-GC electrode towards very low Hg(II) concentration. Although the reproducibility of the results was not good enough in order to ascertain and sustain this hypothesis, it is interesting to notice that it could be supported by the observation made on the basis of activation CVs, which showed a decrease in activate surface area upon scanning. The best response in terms of sensitivity was recorded on AuNPs activated in the same conditions than before, i.e. by recording 10 scans in a 0.5 M H2SO4 solution between 0.20
and 1.40 V at a scan rate 100 mV s-1. In this case a linear response was found in the range 2 – 12 pM with a normalized sensitivity of 0.296 µA pM-1 min-1. A limit of detection (LOD) of 1 pM was calculated for a signal-to-noise ratio of 3 [60]. These analytical performances compared favorably with recent reports found in the literature dealing with AuNPs prepared either by electrochemical or chemical route (see comparative features in Table 3).
Indeed, only the works by Ramezani et al. [33] and Ratner et al. [45] allowed a LOD in the few pM range to be reached. It is noteworthy that the common point to these latter two works with the present one is the use of chemically prepared AuNPs, which confirms once again the great reactivity of these nanoobjects.
4. CONCLUSION
In this work, AuNPs were prepared using the Turkevich method, filtered and deposited onto GC by drop-casting either at room temperature or at 100 °C. The results showed that the filtration step, prior to drop-casting did not exhibit a strong influence on the resulting NPs deposits morphology. On the contrary, evaporation rate has a dramatic effect on AuNPs by favoring aggregation phenomema. Activation of the AuNPs by cycling in H2SO4 lead to significant evolution of their reactivity and
decrease in active surface area consistent with NPs growth and/or Au material loss by Au dissolution. With respect to Hg(II) detection, the activation step and more precisely the number of activation scans also showed an influence while measuring Hg(II) in the pM range. Finally, chemically-prepared AuNPs exhibited a better sensitivity than electrogenerated ones, and allowed a LOD down to 1 pM to be reached. However, the results lacked repeatability due to a memory effect, i.e. all the reduced Hg is not reoxidized while stripping. Efforts will now focus on this latter point together with the long-term stability of the interface.
ACKNOWLEDGEMENT
The authors thank the Laboratoire de Génie Chimique for financial support. They are grateful to Dr. Teddy Hezard for his help in MATLAB programming.
References
1. E. Callender, Treatise on Geochemistry, 9 (2004) 67. 2. S. P. Roy, Ecoscan, 4 (2010) 235.
3. J. Musarrat, A. Zaidi, M. S. Khan, M. A. Siddiqui and A. A. Al-Khedhairy, Environ. Pollut., 20 (2011) 323.
4. S. Prabhakar, A. K. Singh and D. S. Pooni, Indian J. Anim Sci., 82 (2012) 244. 5. G. N. Mhatre, Encyclopedia of Environmental Control Technology, 8 (1995) 427. 6. J. O. Nriagu, Nature (London), 338 (1989) 47.
7. O. Lindqvist, J. Power Sources, 57 (1995) 3.
8. P. C. Nagajyoti, K. D. Lee and T. V. M. Sreekanth, Environ. Chem. Lett., 8 (2010) 199. 9. F. M. M. Morel, A. M. L. Kraepiel and M. Amyot, Annu. Rev. Ecol. Syst., 29 (1998) 543. 10. W. F. Fitzgerald and C. H. Lamborg, Geochemistry of mercury in the environment, Pergamon,
Oxford (2007).
11. D. Mergler, H. A. Anderson, L. H. M. Chan, K. R. Mahaffey, M. Murray, M. Sakamoto and A. H. Stern, AMBIO: A Journal of the Human Environment, 36 (2007) 3.
12. M. Sakamoto, K. Murata, A. Kakita and M. Sasaki, A review of mercury toxicity with special
reference to methylmercury, Wiley, (2012).
13. J. E. Sonke, L.-E. Heimbürger and A. Dommergue, Comptes Rendus Geoscience, 345 (2013) 213.
14. D. Cossa, C. Garnier, R. Buscail, F. Elbaz-Poulichet, N. Mikac, N. Patel-Sorrentino, E. Tessier, S. Rigaud, V. Lenoble and C. Gobeil, Biogeochemistry, 119 (2014) 35.
15. R. Eisler, Environ. Geochem. Health, 25 (2003) 325.
16. Q. Wang, D. Kim, D. D. Dionysiou, G. A. Sorial and D. Timberlake, Environ. Pollut., 131 (2004) 323.
17. WHO; World Health Organization, 2008.
18. Directive 2000/60/EC of the European Parliament and of the Council establishing a framework for the Community action in the field of water policy.
19. S. L. Suib, Front. Chem., 1 (2013) 1.
20. N. Bloom, Canadian Journal of Fisheries and Aquatic Sciences, 46 (1989) 1131. 21. N. S. Bloom, M. Horvat and C. J. Watras, Water, Air, Soil Pollut., 80 (1995) 1257. 22. D. Cossa, L.-E. Heimbürger, D. Lannuzel, S. R. Rintoul, E. C. V. Butler, A. R. Bowie, B.
Averty, R. J. Watson and T. Remenyi, Geochim. Cosmochim. Acta, 75 (2011) 4037. 23. K. Leopold, M. Foulkes and P. Worsfold, Anal. Chim. Acta, 663 (2010) 127.
24. C. R. Hammerschmidt, K. L. Bowman, M. D. Tabatchnick and C. H. Lamborg, Limnol.
Oceanogr-Meth., 9 (2011) 426.
25. C. H. Lamborg, C. R. Hammerschmidt, G. A. Gill, R. P. Mason and S. Gichuki, Limnol.
Oceanogr-Meth., 10 (2012) 90.
26. J. Buffle and M.-L. Tercier-Waeber, TrAC, Trends Anal. Chem., 24 (2005) 172. 27. C. Gao and X.-J. Huang, TrAC, Trends Anal. Chem., 51 (2013) 1.
28. L. Pujol, D. Evrard, K. Groenen-Serrano, M. Freyssinier, A. Ruffien-Cizsak and P. Gros, Front.
Chem., 2 (2014) 19.
29. X. H. Gao, W. Z. Wei, L. Yang, T. J. Yin and Y. Wang, Anal. Lett., 38 (2005) 2327.
30. O. Abollino, A. Giacomino, M. Malandrino, G. Piscionieri and E. Mentasti, Electroanalysis, 20 (2008) 75.
31. O. Abollino, A. Giacomino, M. Ginepro, M. Malandrino and I. Zelano, Electroanalysis (New
York), 24 (2012) 727.
32. D. Li, J. Li, X. Jia and E. Wang, Electrochem. Commun., 42 (2014) 30.
33. S. Ramezani, M. H. Mashhadizadeh, S. Jalilian and M. Aghili, Analytical Methods, 7 (2015) 7765.
34. Y. Liu, G. Su, B. Zhang, G. Jiang and B. Yan, Analyst, 136 (2011) 872. 35. C. M. Welch and R. G. Compton, Anal. Bioanal. Chem., 384 (2006) 601.
36. M. Grzelczak, J. Perez-Juste, P. Mulvaney and L. M. Liz-Marzan, Chem. Soc. Rev., 37 (2008) 1783.
37. Z. Wang and L. Ma, Coord. Chem. Rev., 253 (2009) 1607.
38. F. W. Campbell and R. G. Compton, Anal. Bioanal. Chem., 396 (2010) 241. 39. U. S. Mohanty, J. Appl. Electrochem., 41 (2011) 257.
40. T. Hezard, K. Fajerwerg, D. Evrard, V. Colliere, P. Behra and P. Gros, J. Electroanal. Chem., 664 (2012) 46.
41. T. Hezard, K. Fajerwerg, D. Evrard, V. Colliere, P. Behra and P. Gros, Electrochim. Acta, 73 (2012) 15.
42. T. Hezard, L. Laffont, P. Gros, P. Behra and D. Evrard, J. Electroanal. Chem., 697 (2013) 28. 43. L. Laffont, T. Hezard, P. Gros, L.-E. Heimbürger, J. E. Sonke, P. Behra and D. Evrard, Talanta,
141 (2015) 26.
44. L. Ding, J. Zhai, A. M. Bond and J. Zhang, J. Electroanal. Chem., 704 (2013) 96. 45. N. Ratner and D. Mandler, Anal. Chem., 87 (2015) 5148.
46. J. Turkevich, P. C. Stevenson and J. Hillier, Disc. Faraday Soc., 11 (1951) 55. 47. G. Frens, Nature (London), Physical Science, 241 (1973) 20.
48. G. Gotti, D. Evrard, K. Fajerwerg and P. Gros, J. Solid State Electrochem., 20 (2016) 1539. 49. M. V. Smoluchowski, Bull. Int. Acad. Sci. Cracovie, 3 (1903) 184.
50. P. H. Wiersema, A. L. Loeb and J. T. G. Overbeek, J. Colloid Interface Sci., 22 (1966) 78. 51. L. Sipos, H. W. Nürnberg, P. Valenta and M. Branica, Anal. Chim. Acta, 115 (1980) 25.
52. H. Angerstein-Kozlowska, B. E. Conway, A. Hamelin and L. Stoicoviciu, Electrochim. Acta, 31 (1986) 1051.
53. Y. Wang, E. Laborda, A. Crossley and R. G. Compton, PCCP, 15 (2013) 3133. 54. G. Gotti, K. Fajerwerg, D. Evrard and P. Gros, Electrochim. Acta, 128 (2014) 412. 55. M. A. Scheeweiss, D. M. Kolb, D. Liu and D. Mandler, Can. J. Chem., 75 (1997) 1703. 56. D. M. Kolb, Electrochim. Acta, 45 (2000) 2387.
57. H. Angerstein-Kozlowska, B. E. Conway, A. Hamelin and L. Stoicoviciu, J. Electroanal.
Chem., 228 (1987) 429.
58. J. T. Steven, V. B. Golovko, B. Johannessen and A. T. Marshall, Electrochim. Acta, 187 (2016) 593.
59. H. Angerstein-Kozlowska, B. E. Conway, B. Barnett and J. Mozota, J. Electroanal. Chem., 100 (1979) 417.
60. Analytical Methods Committee, Analyst 112 (1987) 199.
61. S. Sahoo, A. K. Satpati and A. V. R. Reddy, RSC Advances, 5 (2015) 25794.
62. Y. Yang, M. Kang, S. Fang, M. Wang, L. He, J. Zhao, H. Zhang and Zhihong Zhanga, Sens.
Actuator B-Chem., 214 (2015) 63.
63. P. K. Sahoo, S. Sahoo, A. K. Satpati and D. Bahadur, Electrochim. Acta, 180 (2015) 1023. 64. A. Chira, B. Bucur, M. P. Bucur and G. L. Radu, New J. Chem., 38 (2014) 5641.