Publisher’s version / Version de l'éditeur:
Vous avez des questions? Nous pouvons vous aider. Pour communiquer directement avec un auteur, consultez la première page de la revue dans laquelle son article a été publié afin de trouver ses coordonnées. Si vous n’arrivez pas à les repérer, communiquez avec nous à [email protected].
Questions? Contact the NRC Publications Archive team at
[email protected]. If you wish to email the authors directly, please see the first page of the publication for their contact information.
https://publications-cnrc.canada.ca/fra/droits
L’accès à ce site Web et l’utilisation de son contenu sont assujettis aux conditions présentées dans le site
LISEZ CES CONDITIONS ATTENTIVEMENT AVANT D’UTILISER CE SITE WEB.
Internal Report (National Research Council of Canada. Institute for Research in Construction), 1992-08
READ THESE TERMS AND CONDITIONS CAREFULLY BEFORE USING THIS WEBSITE. https://nrc-publications.canada.ca/eng/copyright
NRC Publications Archive Record / Notice des Archives des publications du CNRC :
https://nrc-publications.canada.ca/eng/view/object/?id=e2718076-a350-4bc8-b3d4-f5130512072f https://publications-cnrc.canada.ca/fra/voir/objet/?id=e2718076-a350-4bc8-b3d4-f5130512072f
NRC Publications Archive
Archives des publications du CNRC
For the publisher’s version, please access the DOI link below./ Pour consulter la version de l’éditeur, utilisez le lien DOI ci-dessous.
https://doi.org/10.4224/20375195
Access and use of this website and the material on it are subject to the Terms and Conditions set forth at Fire resistance of reinforced concrete columns: experimental studies Wu, H. J.; Lie, T. T.
Internal Report No. 632 Date of issue: August 1992
N a t i i a l Research Conseil national
'1
Council Canada de recherches Canada Institute for lnstitut de, Research in recherche en Construction construction
by H.J. Wu and T.T. Lie
CISTI/ICIST NRC/CNRC: XRC Ser
Rerei ved on: 07-25-93
Internal report : Ins.titute
f o r Besear c h in NI. Ir : ~ r
A%k-M
i or1Canada
This is an internal report of the Institute for Research in Construction. Although not intended for general distribution, it may be cited as a reference in other publications.
FIRE RESISTANCE O F REINFORCED CONCRETE COLUMNS
-
E
X
P
E
R
M
I
E
N
T
A
L
S
T
U
D
I
E
S
ABSTRACT
The results of f r e tests on seven columns, constructed at the Tianjin Fire Research Institute and tested at the National Fire Laboratory of the Institute for Research in Construction, National Research Council of Canada are described The tests were carried out mainly for the purpose of providing data for the verification of methods for the calculation of the fire resistance of reinforced concrete columns, made with materials commonly used in China The columns were made with siliceous and carbonate aggregates. The study variables included column length, dimensions of cross sections and load eccentricity.
RE R I TAN
c
L-
EXPERIMENTAL S T U D I U
1 INTRODUCTION
As a part of a joint research project on the "Fie Resistance Evaluation for Housing (China)" between the Tianjin Fire Research Institute (TFIU) of the Fire Bureau of the Public Security Ministry of China, and the Institute for Research in Construction (IRC), National Research Council of Canada, seven tests were camed out on reinforced concrete columns.
The main purpose of the tests was to provide data for the verification of methods, now being developed, for the calculation of the fire resistance of reinforced concrete columns, made with materials commonly used in China.
In this report, the results of tests on seven siliceous and carbonate aggregate, reinforced concrete columns with various dimensions are described The columns were designed jointly by
TFRI and the National Fire Laboratory (NFL) of IRC and were tested at the NFL.
2 TEST SPECIMENS
In this joint project, ten reinforced concrete columns, having different dimensions,
aggregates and bearing capacities, were fabricated at TFRI. Seven of them were tested at the NFL;
the others will be tested at TFRL This report describes the test results at the NFL.
In order to determine the performance during fue of concrete columns that are widely used in China, design methods and construction techniques, generally adopted in China, as well as building materials commonly used in China, were selected in the design and fabrication of these test columns [I, 2,3].
The seven columns, which had cross sections similar to those tested previously at the NFL [4,5], are described in Table 1. Details of the specimens are given below.
2 . 1 Dimensions
Five columns were 3810 mm long from end plate to end plate. the others were 3500 mm. Five of the columns had square sections of 305 mm. In order to be able to apply an eccentric load, one of the columns had brackets at the ends, consisting of a horizontal steel plate overhang with reinforced concrete underneath. One column had a rectangular a s s section measuring 305 x
457 mm, and one measured 203 x 914 mm.
2 . 2 Materials
The reinforcing steel consisted of deformed bars, usually used in the construction of reinforced concrete structures in China The longitudinal bars were Type II deformed bars, with d i e t e r s of 20 and 22 mm. The yield strength of the steel (a& was 340 MPa and the ultimate strength (q,) was 500
MPa
The tie bars were Type I deformed bars with a diameter of 8 mmDetails of the concrete mixes are given below:
Cement: 425 portland cement, a general purpose cement for the construction of reinforced structures, was used.
Aggregates: Two types of coarse aggregates were used. One was siliceous, the other carbonate. The sizes were from 10 mm to 40 mm. The fine aggregate was siliceous sand.
Concrete Mixes: The concrete mixes were designed to produce a 25 MP strength concrete. Approximate batch quantities were:
Siliceous Concrete Mix: Cement: 304 kg/m3 Aggregate: 1265 kg/m3 Sand: 626 kg/m3 Water: 170 kg/m3
Cement : Water = 1 : 0.56
Cement : Sand : Aggregate = 1 : 2.06 : 4.16 Carbonate Concrete Mix:
Cement: 314 kg/m3 Aggregate: 1306 kg/m3 Sand: 647 kg/m3 Water: 176 kg/m3 Cement : Water = 1 : 0.56
Cement : Sand : Aggregate = 1 : 2.06 : 4.16
Type K chromel-alumel thermocouples were used to measure the temperatures of the concrete and steel reinforcine bars of the columns. The d i e t e r of the thermocou~le wire was 0.8 mm. The exact locations and numbering of the thermocouples are shown in ~ i g u r e s 4,5, 12,
13, 16 and 17.
2 . 3 Fabrication
The columns were cast in forms, made of steel plate and were of the type widely used in
the construction of reinforced concrete structures in China The reinforcement cages were assembled by welding the longitudinal bars to steel end plates. A T-42 welding rod was used. The thermocouples were secured to the reinforcing steel at specified locations after the cage was properly positioned in the form.
The concrete w;is mixed in a general drum mixer. A small internal vibrator was carefully applied to consolidate the concrete. ' h e concrete was cured under damp burlap for 7 days at abbut 20°C. The forms were then stripped and the columns conditioned in the laboratory.
A hole with a diameter of 14 mrn was drilled near one end of the column before testing for measuring the relative humidity at mid-depth of the column.
3 . TEST APPARATUS
The tests were carried out by exposing the columns to heat in a furnace specially built for testing loaded columns. The test furnace was designed to produce the conditions to which a member might be exposed during a
fire;
i.e., temperatures, structural loads and heat transfer. It consisted of a steeL framework supported by four steel columns, with the furnace chamber inside the framework. A photograph of the furnace is shown in Figure 1. The characteristics and the instrumentation of the furnace are described in detail in Ref. 6.3 . 1 Furnace Chamber
The furnace chamber has a floor area of 2642 x 2642 mm and is 3048 mm high. The interior faces of the chamber are lined with a ceramic fibre material that efficiently transfers heat to the specimen. There are 32 propane gas burners in the furnace chamber, arranged in eight columns containing four burners each. The total capacity of the burners is 4700 KW. Each burner can be adjusted individually, which allows for a high degree of temperature uniformity in the furnace chamber. The pressure in the furnace chamber is also adjustable and is set somewhat lower than atmospheric pressure.
3.2 Loading Device
A hydraulic jack with a capacity of 9778 KN and located at the bottom of the furnace chamber, produced the concentric load along the axis of the test column. The jack was. Eccentric loads were applied by means of other hydraulic jacks, one at the top and one at the bottom of the column, located at a distance of 508
mm
from the axis of the column. The capacity of the top jack was 587 KN and that of the bottom jack 489 KN.3 . 3 Instrumentation
The furnace temperatures were measured with the aid of eight chromel-alumel
thermocouples. The junction of each thermocouple was located 305 mm from the test specimen, at various heights of the furnace chamber. The location of the junctions and their numbering are shown in Figure 2. The temperatures measured by eight thermocouples were averaged automatically and the average temperature was used as the criterion for controlling the furnace temperature.
The loads were measured and controlled using hydraulic pressure transducers. The accuracy of measuring and controlling loads was about 4 KN at lower load levels and relatively better at higher loads.
The axial deformation of the test column was determined by measuring the displacement of the conceneic loading jack. The rotation of the end plates of the columns with brackets was determined by measuring the displacement of the plates at a distance of 7 11 mm from the centre of the hinge at the top and at a distance of 1295 mm from the centre of the hinge at the bottom. The displacement
was
measured using transducers with an accuracy of 0.002 mm.4 . TEST CONDITIONS AND PROCEDURES
4 . 1 Restraint Conditions
Six of the seven columns were tested with both ends of the columns fued, i.e., restrained against rotation and horizontal translation. For this purpose, eight 19 mm bolts, spaced regularly
around the column, were used at each end to fasten the end plates to the loadiig head at the top and to the hydraulic jack at the bottom. The seventh column was tested under hinged conditions, i.e., with restraint against horizontal translation only. In this case, the column end plates were bolted to the receiving plates with a roller bearing at each end
4.2 Loading
Six of the seven columns were tested under a concentric load. The seventh column was tested under a concentric main load and a smaller eccentric load at 508 mrn from the centre of the column. The applied loads were calculated and determined according to Refs. 1 and 2 and are given in Table 1.
The load was applied approximately 45 minutes before the start of each test, until a condition was reached at which no further increase of the axial deformation could be measured.
This condition was selected as the initial condition for column axial deformation. The load was maintained constant throughout the test.
4.3 Fire Exposure
During the test, the column was exposed to heating controlled in such a way that the
average temperature in the
furnace
followed as closely as possible the I S 0 834 [7] standard temperame-time curve.This
curve can be given by the following equation:Tf = 345 log10 (8t
+
1) +To where:Tf = furnace temperature ("C)
To = ambient t e m p e m ("C)
t = time (minutes)
The ambient temperature To at the start of the seven tests was approximately 20°C.
4.4 Failure Criterion
The columns were considered to have failed, and the tests were terminated, when the hydraulic jack, which has a maximum speed of 76 mmtmin, could no longer maintain the load.
4.5 Recording of Results
The furnace, concrete and steel t e m p e r a m , as well as the axial deformations of the columns, were recorded at 2 min intervals.
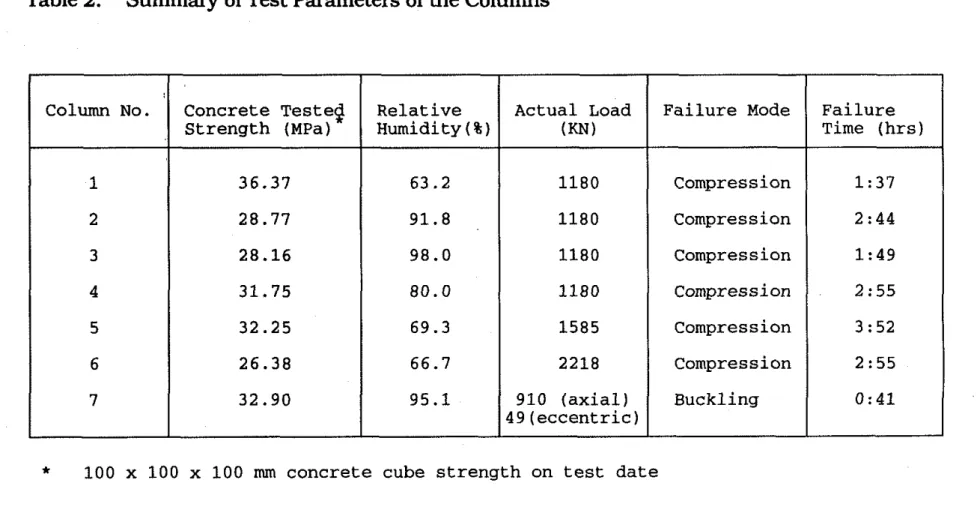
The results of the seven tests are summarized in Table 2, in which column concrete strengths, test conditions, fue resistances and failure modes are given for each column.
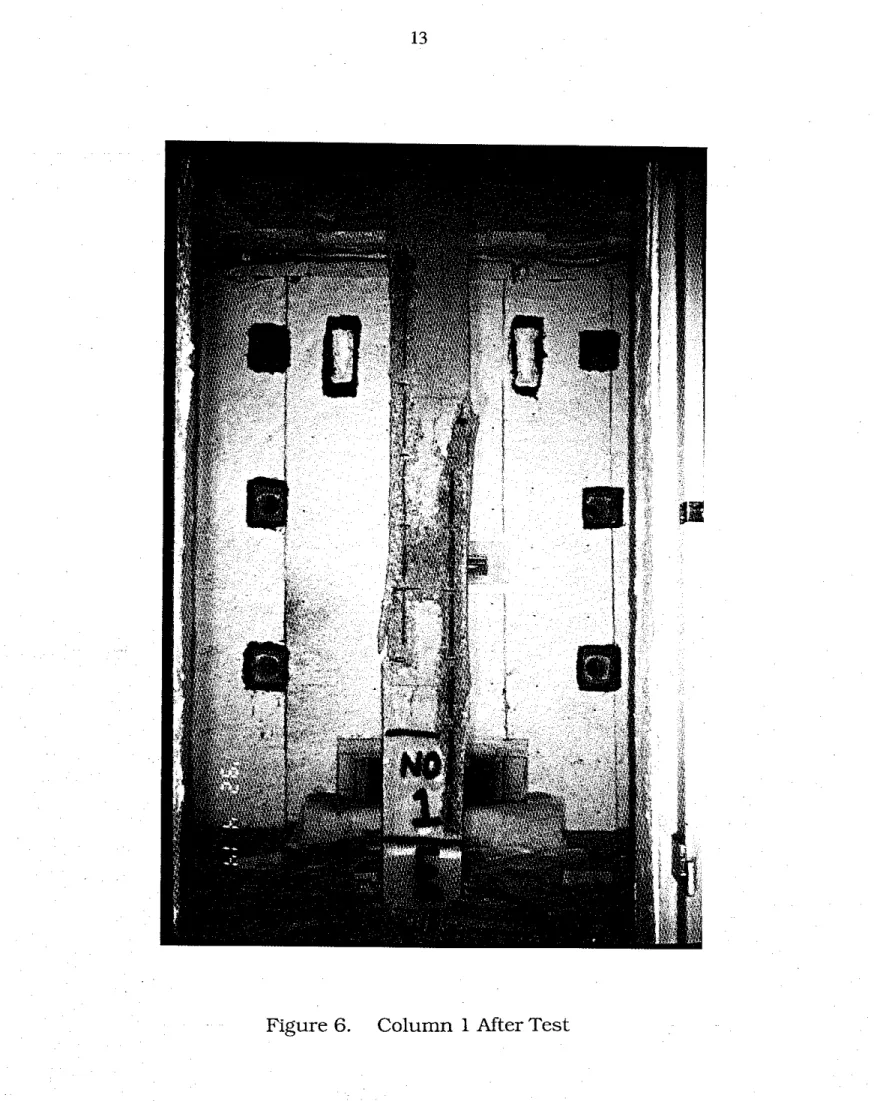
The funace, concrete and steel temperatures recorded during the tests, as well as the axial deformations of the column specimens, are given in Tables 3 to 23. Positive axial deformation values indicate expansion of the column. The photographs of the columns after the tests are given in Figures 6 , 7 , 9 , 10, 14, 18 and 20.
TOD View
Door (East Side)
East Side View TOP
Bottom
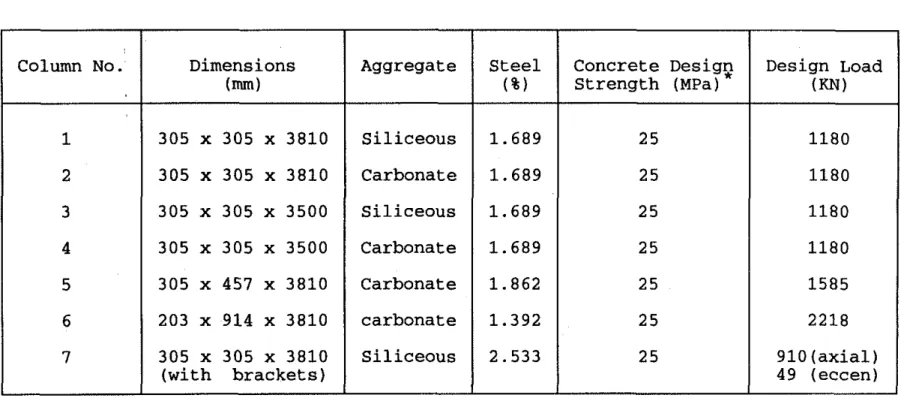
Table
1.Summary of Design Parameters of the Columns
The concrete strength is determined using 100
x
100 x 100 mm concrete cubes according to the Construction Codes of China, and this strength can be converted to the concrete cylinder strength by the equation f,,,=0.83fC,,Column No. 1 2 3 4 5 6 7 Dimensions (mm) 305
x
305x
3810 305x
305 x3810 305x
305x
3500 305x
305 x 3500 305 x 457 x 3810 203 x 914x
3810 305x
305x
3810 (with brackets) Aggregate Siliceous Carbonate Siliceous Carbonate Carbonate carbonate Siliceous Design Load (KN) 1180 1180 1180 1180 1585 2218 glO(axia1) 49 (eccen) Steel ( % ) 1.689 1.689 1.689 1.689 1.862 1.392 2.533 Concrete Desigp Strength (MPa) 2 5 2 5 2 5 2 5 2 5 2 5 25Table
2.
Summary of Test Parameters of the Columns
*
100 x 100 x 100 mm concrete cube strength on test date Column No.-
1 2 3 4 5 6 7 Concrete Testeq Strength (MPa) 36.37 28.77 28.16 31.75 32.25 26.38 32.90 Relative Humidity ( % ) 63.2 91.8 98.0 80.0 69.3 66.7 95.1 Failure Mode Compression Compression Compression Compression Compression Compression Buckling Actual Load (KN) 1180 1180 1180 1180 1585 2218 910 (axial) 49 (eccentric) Failure Time (hrs) 1:37 2:44 1:49 2:55 3:52 2:55 0:415 TEST DESCRIPTIONS AND RESULTS 5.1 Column 1 Cross-Section: 305 x 305 rnrn Length: 3810 mm Aggregate: Siliceous Reinforcement: 1.689% as 4 $22 mm bars
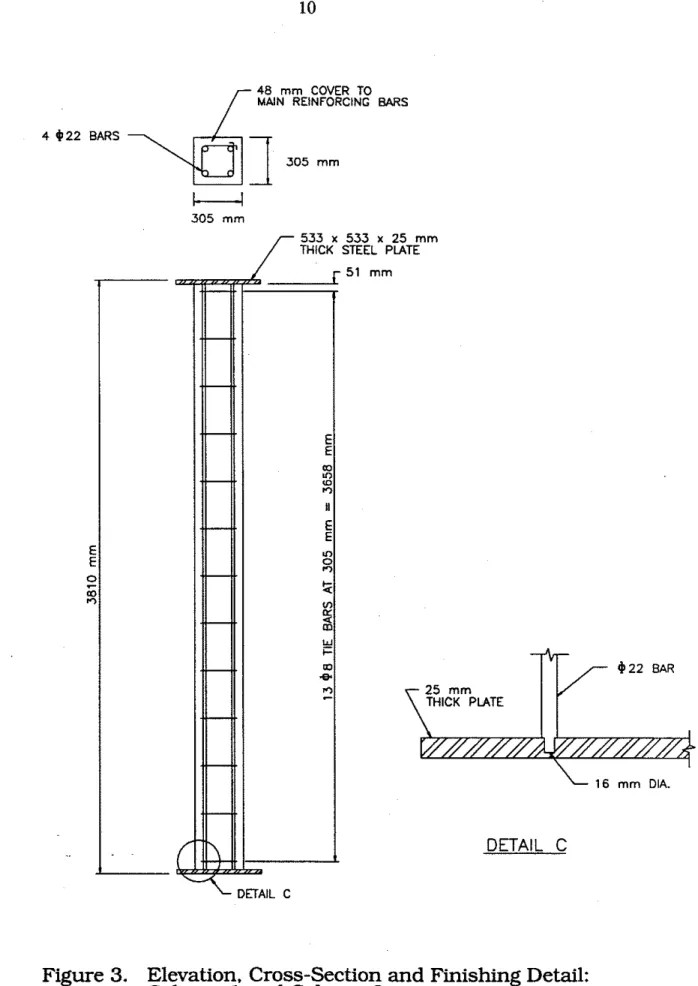
Elevation, Cross-Section and Fishing Detail: Figure 3 Locations of TIC'S on Steel Bars: 13gure 4
Locations of TIC'S at Mid-Height Section: Figure 5 Measured Prouerties
Concrete Cube Suength: 36.37 M P on test date
Relative Humidity: 63.2%
Actual Loading: 1180 KN, Concentric
Test Results
Test Duration: 1 hour 37 minutes
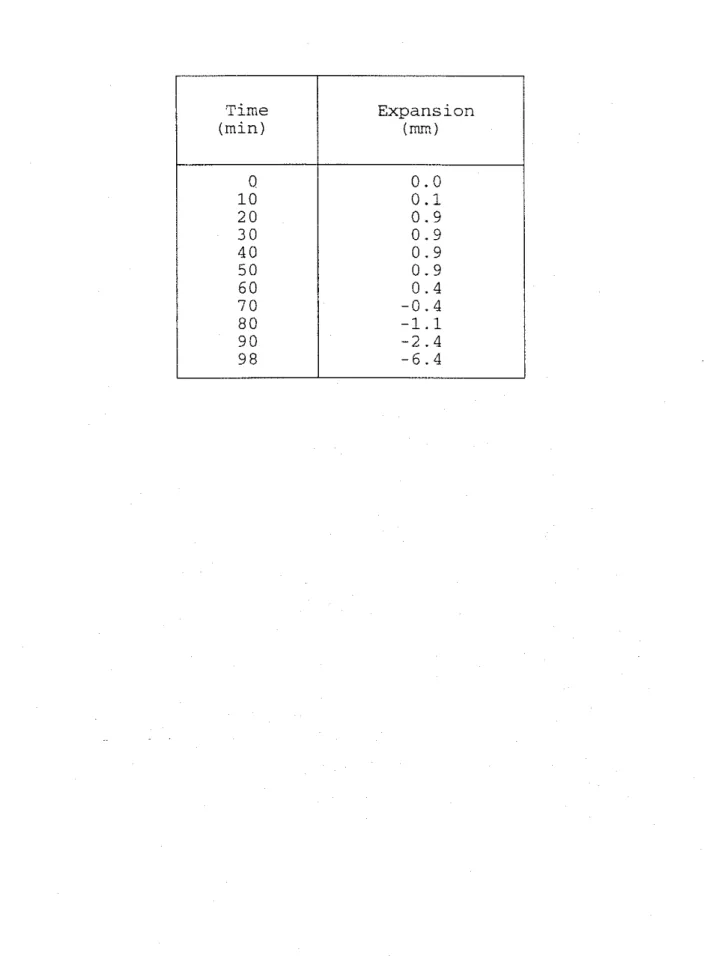
Axial
Deformation: Table 3Steel Bar Temperatures: Table 4
Concrete Temperalum: Table 5
0:40 Small cracks developed on the east face. 1:04 The eolumn began to contract
1:06 Some concrete fell off and a reinforcing bat was visible on the east face. 1:30 Reinforcing bars, about 1 m in length, were visible on the east face at mid-
height
/-
48 MAIN REINFORCING mrn COVER TO BARS'
'"
"
-
3
7
-5 mrn 533 x 533 x 25 rnrn THICK S E E - PLATE rnm '22 BAR 25 mrn THICK PLATE 16 rnrn DIA. DETAIL C DETAIL CFigure 3. Elevation, Cross-Section
and
Finishing
Detail:
Column
1and
Column
2SECTION C-C
m
EAST
-
EAST
Figure
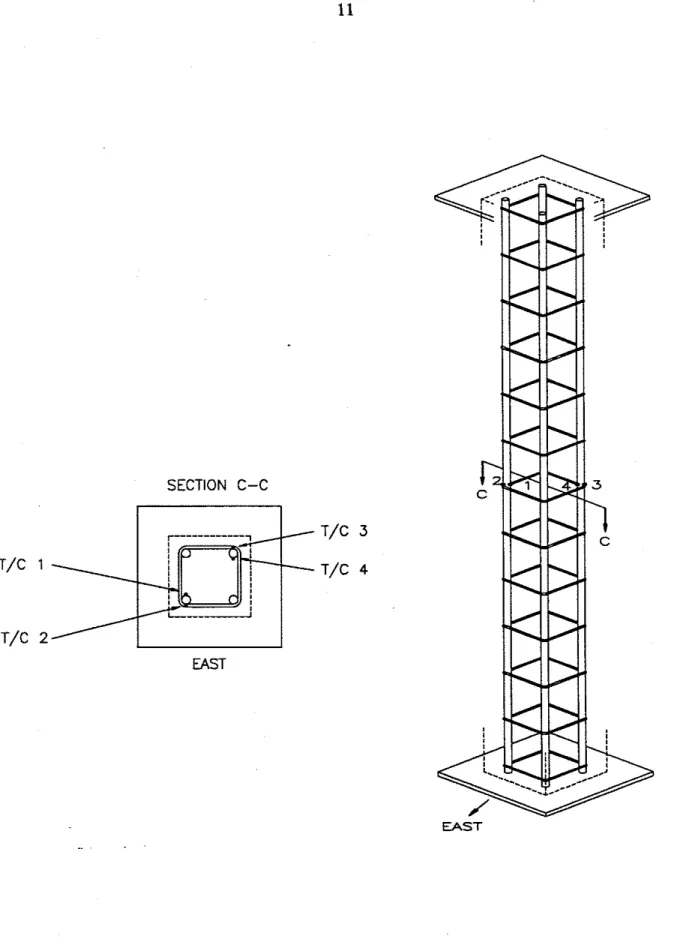
4.Locations of T/C's on Steel
Bars:
305
x
305
mm
Section Columns
25 rnm 7
13 mm
I '
EAST
Figure
5.
Locations of T/C's at Mid-Height Section:
305
x
305
mm
Columns
14
Table 3. Axial Deformation, Column I
T i m e ( m i n )
Expansion (mm)
15
Table
4.Steel
Bar
Temperatures, Column
1Time (min) 0 10 2 0 3 0 4 0 50 60 7 0 80 9 0 98 Temperatures ( ' C ) Measured at Thermocouples # : 1 2 3 4 23 -- 23 2 3 72 -- 6 1 63 109 --- 115 113 129 --- 13 8 153 170 --- 174 192 222 --- 225 231 276 --- 281 288 329 --- 331 339 382 --- 379 385 430 - - - 425 431 469 --- 465 499 Furnace Temperature ( ' C ) 2 0 7 04 812 875 909 948 973 993 1001 1031 1006
Table 5. Concrete Temperatures, Column I
Furnace Temperature ( ' C ) 2 0 704 812 87 5 909 948 973 993 1001 1031 1006 Time (min) 0 10 2 0 3 0 40 50 60 7 0 80 90 98Temperatures ( ' C ) Measured at Thermocouple # :
5 6 7 8 9 10 11 12 13 14 15 24 23 2 3 23 23 2 3 23 2 3 2 3 2 3 2 4 188 108 8 0 3 8 24 23 24 3 6 67 103 148 321 190 114 81 41 2 8 37 83 111 173 273 408 265 154 101 66 48 59 95 134 232 343 467 319 198 110 86 70 78 107 178 281 394 516 362 237 137 102 88 94 124 214 324 441 558 401 274 165 105 98 104 149 250 368 490 593 435 310 193 110 102 106 175 284 407 527 627 471 346 222 123 103 111 204 319 449 571 668 510 383 254 148 102 119 233 360 516 648 700 543 416 279 167 102 132 259 400 571 706
5 . 2 Column 2 Specimen Properties Cross-Section: 305 x 305 mm Length: 3810 mm Aggregate: Carbonate Reinforcement: 1.689% as 4 @22 mm bars
Elevation, Cross-Section and Finishing Detail: Figure 3 Locations of TIC'S on Steel Bars: Figure 4
Locations of TIC'S at Mid-Height Section: Figure 5 Measured Prouerties
Concrete Cube Strength: 28.77 MP on test date Relative Humidity: 91.8%
Actual Loading: 1180 KN, Concentric Test ResulQ
Test Duration: 2 hours 44 minutes Axial Deformation: Table 6
Steel Bar Temperatures: Table 7
Concrete Temperatures: Table 8 Observations
1:00 SmaU cracks developed on the column faces. 1:50 The column began to contract
2:49 Cracks on the left of the east face extended.
Table 6. Axial Deformation. Column 2
Time (min)
Expansion
20
Table
7.Steel
Bar
Temperatures, Column
2Time (rnin) Temperatures ( ' C ) Measured at Thermocouples # : 1 2 3 4 Furnace Temperature ( ' C )
Table
8.
Concrete Temperatures, Column
2 Furnace Temperature ( ' C ) 2 0 6 9 0 7 7 8 8 2 9 8 7 0 8 9 5 9 1 8 9 3 2 9 5 0 9 6 5 9 8 0 9 9 1 1 0 0 3 1 0 1 3 1 0 2 7 1 0 3 5 1 0 4 3 1 0 3 2 Time (min) 0 1 0 2 0 3 0 4 0 5 0 6 0 7 0 8 0 9 0 1 0 0 1 1 0 1 2 0 1 3 0 1 4 0 1 5 0 1 6 0 1 6 4Temperatures ( ' C ) Measured at Thermocouple # :
5 6 7 8 9 1 0 11 1 2 1 3 1 4 1 5 1 9 1 9 1 9 1 9 1 9 1 9 1 8 1 8 1 9 1 9 2 1 1 3 7 8 2 5 3 2 3 1 9 1 9 2 0 3 1 7 4 1 1 2 2 1 7 2 5 3 1 2 9 111 5 1 2 7 2 1 3 6 8 3 1 1 8 2 1 3 3 6 6 3 3 8 1 9 9 1 2 1 7 7 4 6 3 4 5 9 1 0 3 1 7 0 2 9 5 4 6 1 4 0 5 2 5 6 1 6 3 9 1 6 4 5 1 7 7 111 2 2 6 3 6 1 5 3 0 4 5 5 3 0 3 2 0 5 1 0 3 7 9 6 8 9 3 1 3 3 2 6 9 4 1 1 5 8 1 4 9 5 3 4 1 2 4 1 1 0 7 9 4 8 8 1 0 5 1 5 3 3 0 4 4 4 9 6 1 6 5 2 7 3 7 3 2 7 4 1 2 5 1 0 4 1 0 1 1 0 9 1 8 2 3 4 0 4 8 5 6 4 8 5 5 5 4 0 4 3 0 7 1 5 0 1 0 5 1 0 6 1 1 7 2 1 3 3 7 4 5 1 5 6 7 2 5 7 8 4 3 3 3 3 8 1 7 8 1 2 1 1 0 5 1 3 0 2 4 3 4 0 4 5 4 2 6 9 4 6 0 0 4 6 0 3 6 8 2 0 5 1 3 8 1 0 5 1 5 1 2 7 1 4 3 3 5 6 7 7 1 4 6 2 0 4 8 5 3 9 6 2 3 2 1 6 1 1 0 5 1 7 3 2 9 9 4 6 0 5 8 8 7 3 4 6 4 0 5 0 9 4 2 2 2 5 8 1 8 7 1 1 3 1 9 5 3 2 5 4 8 9 6 0 8 7 5 2 6 5 9 5 3 2 4 4 8 2 8 5 2 1 3 1 2 8 2 1 9 3 5 1 5 0 8 6 2 6 7 6 8 6 7 7 5 5 3 4 7 2 3 1 1 2 4 0 1 6 3 2 4 5 3 7 7 5 3 0 6 4 3 7 8 6 6 9 4 5 7 3 4 9 5 3 3 6 2 6 6 1 9 4 2 7 0 4 0 1 5 5 0 6 5 8 8 0 1 7 0 9 5 9 2 5 1 7 3 6 1 2 7 6 2 2 0 2 9 6 4 2 4 5 6 9 6 7 4 8 1 6 7 1 4 5 9 9 5 2 5 3 7 0 3 1 1 2 3 0 3 0 6 4 3 3 5 7 6 6 8 0 8 2 3
5.3 Column 3
Cross-Section: 305 x 305 mm
Length: 3500 mm Aggregate: Siliceous
Reinforcement: 1.689% as 4 422 mm bars
Elevation, Cross-Section and Finishing Detail: Figure 8 Locations of TIC'S on Steel Bars: Figure 4
Locations of TIC'S at Mid-Height Section: Figure 5 Measured Properties
Concrete Cube Strength: 28.16 M P on test date
Relative Humidity: 98%
Actual Loading: 1180 KN, Concentric Test Results
Test Duration: 1 hour 49 minutes Axial Deformation: Table 9
Steel Bar Temperatures: Table 10 Concrete Temperanuts: Table 11
Observations
0:34 Small cracks developed on the east face.
0:46 Small cracks extended on the east face. 1:15 Some concrete crushed on the east face.
1:23 Concrete near the lower quarter point on the east face protruded. 1:40
Maximum
cracks on the east face reached 3 cm.48 mm COVER TO MAIN REINFORCING BARS
533 x 533 x 2 5 rnm
THICK STEEL PLATE
Figure 8. Elevation. Cross-Section
andFinishing Detail:
Column 3
andColumn
4Table
9. AxialDeformation,
Column 3Time (min)
Expansion (mm)
26
Table 10. Steel
Bar
Temperatures, Column 3Time (min) Temperatures ( ' C ) Measured at Thermocouples # : 1 2 3 4 Furnace Temperature ( ' C )
Table
1 1.Concrete Temperatures, Column 3
Furnace Temperature ( ' C ) 2 0 706 823 879 926 955 967 995 1 0 1 5 1 0 3 2 1 0 4 3 1 0 6 5 - Time (min) 0 1 0 2 0 3 0 4 0 50 6 0 7 0 8 0 9 0 1 0 0 1 0 9Temperatures ( ' C ) Measured at Thermocouple # :
5 6 7 8 9 1 0 11 1 2 1 3 1 4 1 5 2 9 2 6 2 3 2 0 1 9 1 9 1 9 2 0 2 3 2 6 2 9 1 9 9 1 0 9 7 8 3 6 2 1 1 9 2 0 3 5 8 8 1 0 7 1 6 2 343 1 8 3 1 1 9 7 9 3 8 2 5 3 5 85 1 1 7 1 6 3 285 444 2 5 9 1 4 8 1 0 2 5 9 44 60 99 1 4 4 2 3 2 365 514 3 1 9 1 9 8 1 0 9 7 9 6 4 7 9 1 0 4 1 8 5 2 8 1 420 565 367 2 4 2 1 3 3 97 8 2 9 1 1 0 5 2 1 6 3 1 8 4 6 0 609 409 2 8 2 1 6 4 111 9 7 9 8 1 0 6 237 3 4 8 494 6 4 9 4 4 8 3 1 8 1 9 2 1 1 3 1 1 0 1 0 5 1 3 5 2 6 8 3 7 9 526 686 486 353 2 2 1 1 1 6 1 0 8 1 0 5 1 6 7 3 0 1 4 1 2 552 7 2 0 524 3 8 9 2 5 1 1 2 4 1 0 6 1 0 5 1 9 7 3 3 4 443 580 7 5 2 5 6 0 426 2 8 2 1 4 3 1 0 3 111 2 2 8 3 7 0 483 634 7 7 5 589 454 3 0 8 1 6 0 1 0 3 1 1 8 255 403 523 6 8 1
5 . 4 Column 4
Cross-Section: 305 x 305 mm
Length: 3500 mm Aggregate: Carbonate
Reinforcement: 1.689% as 4 422 mm bars
Elevation, Cross-Section and Finishing Detail: Figure 8 Locations of TIC'S on Steel Bars: Figure 4
Locations of TIC'S at Mid-Height Section: Figure 5 d Properties
Concrete Cube Strength: 31.75
MP
on test date Relative HumidiQ: 80%Actual Loading: 1180
KN,
ConcentricTest Duration: 2 hours 55 minutes
Axial Deformation: Table 12 Steel Bar Temperatures: Table 13 Concrete Temperatures: Table 14 Observations
050 Small cracks were visible on the east face. 1:34 Small cracks extended.
1 5 0 The column began to contract
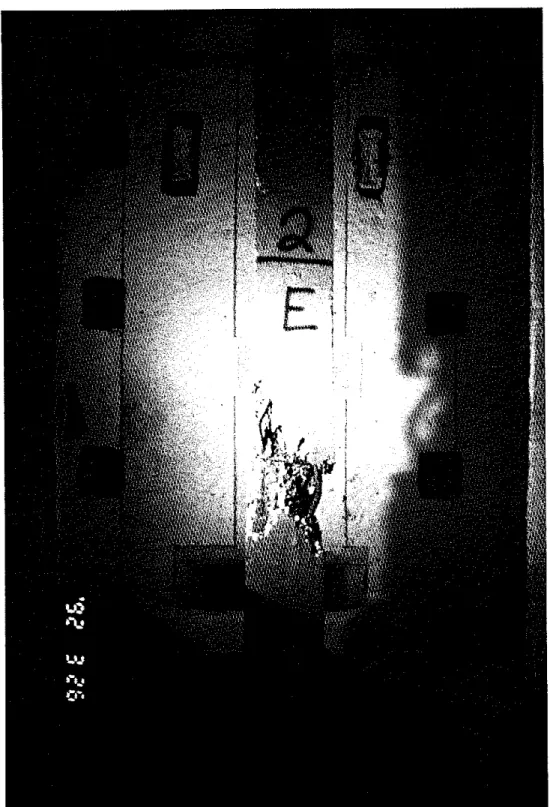
25.5 Large cracks developed on the east face and the column failed in compression (Figure 10).
Table 12. Axial Deformation, Column 4
Time (min)
Expansion (mm)
3 1
Table 13. Steel
Bar
Temperatures. Column 4Time (min) Temperatures ( ' C ) Measured at Thermocouples # : 1 2 3 4 Furnace Temperature ( ' C )
Table
14.Concrete Temperatures, Column
4 Furnace Temperature ( 'C) 2 0 705 812 882 918 938 965 989 1026 1040 1060 1054 1068 1081 1101 1099 1112 1128 1133 Time (min) 0 10 2 0 3 0 40 50 60 7 0 80 9 0 100 110 120 130 140 150 160 170 174Temperatures ('C) Measured at Thermocouple # :
5 6 7 8 9 10 11 12 13 14 15 2 1 17 16 16 15 15 16 16 16 16 17 224 107 74 3 0 16 16 16 2 1 3 8 85 114 384 191 115 69 3 0 19 2 5 54 108 125 201 490 275 149 108 7 0 32 49 85 110 187 291 567 355 207 110 106 5 2 66 97 130 252 363 621 413 258 140 105 7 1 81 107 164 304 419 659 457 302 171 105 90 96 119 192 344 463 692 494 339 202 108 100 107 136 221 377 496 723 528 373 231 117 105 109 157 252 408 526 749 559 404 260 129 105 116 180 282 437 553 772 586 434 288 147 106 122 205 311 464 577 792 610 461 316 168 112 136 231 338 489 598 811 632 487 344 191 119 157 258 365 514 619 831 654 512 369 214 129 182 285 392 537 639 849 675 536 394 237 148 205 311 417 559 658 866 695 559 419 261 174 230 336 442 581 676 882 713 580 442 286 203 255 360 466 600 694 897 731 601 465 311 232 281 384 489 619 710 902 738 609 473 322 242 291 393 497 627 717
5.5 Column 5
Cross-Section: 305 x 457 mm
Length: 3810 mrn Aggregate: Carbonate
Reinforcement: 1.862% as 8 @20 mm bars
Elevation, Cross-Section and Finishing Detail: Figure 11
Locations of TIC'S on Steel Bars: Figure 12
Locations of TIC'S at Mid-Height Section: Figure 13 Measured Properties
Concrete Cube Strength: 32.25 MP on test date
Relative Humidity: 69,3%
Actual Loading: 1585
KN,
ConcentricTest Duration: 3 hours 52 minutes
Axial Deformation: Table 15 Steel Bar Temperature% Table 16 Concrete Temperatures: Table 17
1:00 Small cracks developed on the column faces.
2:40 The column began to contract. 3:10 Small cracks extended.
f
4 8 m m COVER TO MAIN REINFORCING BARS8 $ 2 0 BARS --/
457 m m
8 6 4 x 533 x 38 m m THICK STEEL PLATE
y 3 8 m m THICK PLATE
p'20wR
14 m m DIA.
DETAIL C
Figure
1 1.Elevation, Cross-Section
andFinishing Detail:
Column
5
Figure
12.
Locations of
T/C's
on Steel Bars:
Column 5
Figure 13.
Locations of T/C's
at Mid-Height
Section:
Column
5
12 rnrn T/C#
13 rnrn 1 3 rnrn 25 rnrnAT 38 rnrn2r 51 rnrn .. 14 15 1 6 1 7 1 8 1 9 2 0 T / C #I
AT 9 9 -T-+
10 111
-'r 12 I I 1 3 I 76 rnrn..
---
1- -
- + -38
Table 15. Axial Deformation, Column 5
Time (min)
Expansion
Table
16.Steel Bar Temperatures, Column
5 Time (min) Temperatures ( ' C ) Measured at Thermocouples # : 1 2 3 4 5 6 7 8 Furnace Temperature ( ' C )Table
17.Concrete Temperatures, Column
5
Furnace Temperature ( 'C) 2 0 712 803 867 909 937 964 997 1020 1029 1044 1058 1077 1087 1097 1108 1118 1127 1134 1144 1151 1159 1165 1173 1174 Time (min) 0 10 2 0 3 0 40 50 60 70 80 90 100 110 120 130 140 150 160 170 180 190 200 210 220 230 232Temperatures ('C) Measured at Thermocouple # :
9 10 11 12 13 14 15 16 17 18 19 20 22 21 21 21 21 21 32 21 21 21 21 22 151 109 66 27 21 21 34 21 26 65 100 195 318 177 119 99 41 23 33 37 64 119 154 347 431 270 164 107 81 78
--
59 93 146 230 448 510 344 231 111 104 97- -
76 105 208 303 524 562 397 279 121 105 103- -
90 111 256 359 581 598 438 320 151 106 104 - - 104 133 298 404 625 626 471 354 186 106 105 87 109 161 336 443 661 650 500 384 216 108 105 90 122 191 371 478 693 673 525 410 240 114 104 93 140 221 401 509 720 693 547 434 262 124 104 95 160 247 429 536 744 712 567 455 283 140 104 96 182 274 455 561 766 730 584 475 302 155 105 99 203 300 479 583 786 748 601 493 320 170 109 105 224 325 503 604 806 765 617 510 337 184 115 117 246 349 524 624 824 781 632 527 355 200 130 132 269 373 545 644 840 797 647 543 372 218 154 154 291 396 565 662 857 811 661 558 390 238 180 175 314 417 584 680 873 825 675 573 407 258 202 194 336 441 602 698 889 838 687 587 424 278 222 212 357 463 619 714 904 849 699 600 441 297 242 230 377 483 635 729 917 861 711 614 458 316 261 247 398 503 651 744 931 872 723 626 474 334 281 263 417 520 665 759 944 883 736 639 490 352 300 278 436 536 679 773 957 886 738 642 493 354 304 930 744 - - - 98 775 ---5.6 Column 6 Soecimen Properties Cross-Section: 203 x 914 mm Length: 3810 mm Aggregate: Carbonate Reinforcement: 1.392% as 8 $20 mm bars
Elevation, Cross-Section and Finishing Detail: Figure 15 Locations of TIC'S on Steel Bars: Figure 16
Locations of T/C's at Mid-Height Section: Figure 17
Measured Pro~erties
Concrete Cube Strength: 26.38 M P on test date
Relative Humidity: 66.7%
Actual Loading: 2218 KN, Concentric Test Re&
Test Duration: 2 hours 55 minutes Axial Deformation: Table 18 Steel Bar Temperam: Table 19 Concrete Temperatures: Table 20
1:20 Small cracks were visible to theright of the east face. 2:00 More small cracks developed.
2% A-crack about 20 cm in length was visible on the east face at mid-height. 235 Small cracks were also visible on the north face.
238 A large crack 30 cm in length and 1 cm in width was visible on the south face. 2:55 The column failed in compression (Figure 18).
48 m m COVER TO MAIN REINFORCING BARS
3
203 mm8 Q 2 0 BARS
,
I 914 rnm1016 x 533 x 2 5 mrn
THICK STEEL PLATE
rnm
721-
7 a 2 0 BAR 2 5 mrn THICK PLATE1 Y
14 rnm D l k DETAIL CFigure
15.
Elevation, Cross-Section and Finishing Detail:
SECTION A-A
I I
SECTION B-B
SECTION C-C
7
Figure 16. Locations of T/Cts on Steel Bars:
Column 6
Figure
17.Locations of T/C's at Mid-Height Section:
Column
6
46
Table 18. Axial Deformation, Column 6
Time (min)
Expans ion
Table
19.Steel
Bar
Temperatures, Column
6 Time :min) Temperatures ( ' C ) Measured at Thermocouples # : 1 2 3 4 5 6 7 Furnace Temperature ( ' C )Table 20. Concrete Temperatures, Column 6
Furnace Temperature ( ' C ) 2 0 7 0 3 8 0 1 8 7 3 9 1 1 9 4 4 9 6 8 9 9 4 1 0 1 6 1 0 3 2 1 0 4 8 1 0 6 8 1 0 7 2 1 0 8 8 1 0 9 3 1 1 0 8 1 1 1 7 1 1 2 7 1 1 2 9 Time (min) 0 1 0 2 0 3 0 4 0 5 0 6 0 7 0 8 0 9 0 1 0 0 1 1 0 1 2 0 1 3 0 1 4 0 1 5 0 1 6 0 1 7 0 1 7 6Temperatures ( ' C ) Measured at Thermocouple # :
9 1 0 11 1 2 1 3 1 4 1 5 1 6 1 7 1 8 1 9 2 0 2 1 2 3 2 0 1 8 1 7 1 7 1 7 1 7 1 7 1 7 1 7 1 8 1 8 1 9 2 1 8 1 2 1 8 6 3 4 1 9 1 9 1 8 1 9 2 0 2 5 4 4 7 9 1 0 6 3 7 9 2 3 7 1 3 2 9 0 3 9 4 0 4 2 4 1 4 7 7 3 1 0 5 1 2 2 1 9 8 4 8 5 3 3 4 1 9 1 1 1 6 7 7 7 7 8 1 7 9 7 9 9 7 1 1 7 1 2 5 2 8 0 5 5 6 4 0 1 2 4 4 1 2 9 1 2 1 1 1 2 1 2 5 1 2 0 1 0 6 111 1 1 3 1 4 3 3 1 7 6 0 2 4 5 1 2 9 1 1 3 9 1 2 6 1 2 8 1 2 5 1 2 5 1 2 2 1 2 2 1 4 6 2 0 8 3 8 7 6 4 2 4 9 5 3 3 6 1 7 8 1 2 2 1 2 5 1 2 0 1 2 3 1 2 5 1 4 1 1 9 6 2 7 4 4 4 7 6 7 2 5 2 9 3 7 4 2 1 4 1 2 3 1 3 1 1 2 1 1 2 9 1 3 1 1 7 0 2 5 2 3 3 0 4 9 4 7 0 7 5 6 4 4 0 9 2 4 5 1 3 2 1 5 2 1 2 9 1 4 3 1 5 0 2 1 5 3 0 4 3 8 3 5 3 6 7 3 9 5 9 3 4 4 5 2 8 0 1 8 3 1 9 2 1 5 8 1 7 1 1 9 1 2 6 3 3 5 4 4 3 2 5 7 3 7 6 2 6 2 2 4 7 9 3 1 6 2 2 1 2 2 9 1 9 5 2 0 7 2 3 7 3 0 9 4 0 1 4 7 8 6 0 5 7 9 5 6 4 9 5 1 0 3 5 0 2 5 6 2 6 3 2 3 1 2 4 5 2 7 9 3 5 3 4 4 4 5 1 8 6 3 4 8 1 4 6 7 4 5 3 9 3 8 3 2 9 1 2 9 6 2 6 6 2 8 2 3 1 9 3 9 2 4 8 3 5 5 3 6 6 0 8 3 7 6 9 7 5 6 5 4 1 4 3 2 4 3 2 7 3 0 1 3 1 8 3 5 6 4 2 9 5 1 7 5 8 3 6 8 5 8 5 3 7 1 8 5 8 9 4 4 3 3 5 5 3 5 7 3 3 4 3 5 1 3 9 1 4 6 3 5 4 7 6 1 0 7 0 8 8 7 5 7 4 1 6 1 1 4 7 0 3 8 4 3 8 5 3 6 4 3 8 2 4 2 2 4 9 3 5 7 4 6 3 3 7 2 8 8 8 7 7 6 1 6 3 2 4 9 6 4 1 1 4 1 1 3 9 3 4 1 1 4 5 2 5 2 1 5 9 8 6 5 4 7 4 6 9 0 4 7 7 9 6 5 2 5 2 0 4 3 5 4 3 5 4 1 9 4 3 7 4 8 2 5 4 5 6 1 8 6 7 3 7 6 2 9 0 8 7 9 0 6 6 5 5 3 4 4 5 1 4 4 4 4 2 8 4 5 4 4 9 5 6 0 5 6 2 5 6 8 0 7 6 7
5 . 7 Column 7
Cross-Section: 305 x 305 mm
Length: 3810 mm Aggregate: Siliceous
Reinforcement: 2.533% as 6 422 mm bars
Elevation, Cross-Section and Finishing Detail: Figure 19 Locations of TIC'S on Steel Bars: Figure 4
Locations of TIC'S at Mid-Height Section: Figure 5 Measured Propertie2
Concrete Cube Strength: 32.90 MP on test date Relative Humidity: 95.1%
Actual Loading: 910 KN, Concentric; 49 KN, Eccentric Test Resul&
Test Duration: 41 minutes Axial Deformation: Table 21 Steel Bar Temperatures: Table 22 Concrete Tempera-: Table 23
0:30
Small
cracks developed on the north face.0:38 Two cracks about 5 cm in length and 0.3 cm in width were visible on the north fa.=-
48 mm COVER TO MAIN REINFORCING BARS
4 $22 BARS
I
305 mmC 7 1 1 m m
I
8 6 4 x 6 3 5 x 38 rnm THICK STEEL PLATE
152 x 7 6 x 6 mm L WELDED TO TIES 4 222 BARS EXTEND TO TOP OF COLUMN E E AT 3 0 5 mm 0 m D
\38 THICK mm PUTE
v"'
BARDETAIL C
Figure
19.
Elevation. Cross-Section and
Finishing
Detail:
52
Table
21. Deformation. Column 7Time (min) Expansion (mm) Rotation of TOP ( ' ) Rotation of Bottom ( ' )
Table
22.Steel Bar Temperatures, Column
7 Time (min) 0 4 8 1 0 1 4 1 8 2 0 2 4 2 8 3 0 3 4 3 8 4 0 Temperatures ( ' C ) Measured at Thermocouples # : 1 2 3 4 1 9 1 9 1 9 1 9 2 1 2 1 2 1 2 0 3 6 3 7 3 4 3 2 5 0 52 - 4 8 44 1 0 4 1 0 4 8 4 7 9 111 111 9 9 9 6 111 1 1 0 1 0 4 1 0 1 111 1 1 2 1 0 5 1 0 5 1 2 0 1 2 3 1 0 8 1 0 6 1 2 8.
1 3 0 1 1 2 1 0 9 1 4 4 1 4 6 1 2 4 1 1 9 1 6 0 1 6 3 1 3 9 1 3 3 1 6 8 1 7 1 1 4 7 1 4 1 Furnace Temperature ( ' C ) 2 0 6 1 1 6 9 0 7 1 7 7 6 0 7 9 7 8 0 8 8 4 0 8 7 0 8 8 1 8 9 1 9 0 1 9 0 8Table 23. Concrete Temperatures, Column
7 Furnace Temperature ( ' C ) 2 0 611 690 717 7 60 797 808 840 870 881 891 901 908 Time (min) - 0 4 8 10 14 18 2 0 2 4 2 8 3 0 3 4 3 8 4 0 -Temperatures ( ' C ) Measured at Thermocouple # :
5 6 7 8 9 10 11 12 13 14 15 2 1 19 19 19 19 19 19 19 19 19 19 115 42 2 8 2 0 19 19 19 19 2 3 42 84 196 8 7 57 2 7 19 19 19 2 5 43 90 113 236 102 7 3 3 3 2 0 19 20 3 0 57 101 142 309 123 97 47 2 4 19 2 3 4 8 87 123 199 367 157 115 65 3 0 2 1 2 9 65 101 153 248 390 172 118 7 6 3 5 2 3 3 3 70 101 169 267 431 202 131 89 4 6 2 9 4 1 78 104 189 291 468 233 155 9 4 58 3 7 50 84 102 210 316 487 249 169 98 6 2 42 54 87 102 222 331 519 278 193 99 7 0 50 62 91 108 246 359 547 305 215 101 7 6 59 7 0 98 127 271 386 559 318 227 101 7 9 63 73 100 137 283 399
REFERENCES
1. Reinforced Concrete Structures Design Code (TJlO-74), The China Construction Industry - Publishing House, 1974.
2. Reinforced Concrete Structures, Tianjin University, Tongji University, The China
Construction Industry Publishing House, 1987.
3. Building Materials, Hunan University, The China Construction Indusay Publishing House,
19x7
-<-,.
4. Lie, T. T. and Woollerton, J. L., Fire Resistance of Reinforced Concrete Columns-Test Results, National Research Council Canada, Institute for Research in Construction, Internal Report No.569, Ottawa, Ontario, 1988.
5. Lie, T. T. and Irwin, R. J., Evaluation of the Fire Resistance of Reinforced Concrete Columns with Rectangular Cross-Section, National Research Council Canada, Institute for Research in Construction, Internal Report No.601, Ottawa, Ontario, 1990.
6 . Lie, T. T., New Facility to Determine Fire Resistance of Columns, Canadian Journal of Civil
Engineering, Vol. 7, i980.
7. Fire Resistance Tests-Elements of Building Construction, ISO-834, International Organization for Standardization, 1975.