HAL Id: hal-01622041
https://hal-amu.archives-ouvertes.fr/hal-01622041
Submitted on 3 Jul 2018HAL is a multi-disciplinary open access archive for the deposit and dissemination of sci-entific research documents, whether they are pub-lished or not. The documents may come from teaching and research institutions in France or abroad, or from public or private research centers.
L’archive ouverte pluridisciplinaire HAL, est destinée au dépôt et à la diffusion de documents scientifiques de niveau recherche, publiés ou non, émanant des établissements d’enseignement et de recherche français ou étrangers, des laboratoires publics ou privés.
Glider and satellite monitoring of the variability of the
suspended particle distribution and size in the Rhône
ROFI
Gael Many, François Bourrin, Xavier Durrieu de Madron, Anouck Ody, David
Doxaran, Pierre Cauchy
To cite this version:
Gael Many, François Bourrin, Xavier Durrieu de Madron, Anouck Ody, David Doxaran, et al.. Glider and satellite monitoring of the variability of the suspended particle distribution and size in the Rhône ROFI. Progress in Oceanography, Elsevier, 2017, 163, pp.123 - 135. �10.1016/j.pocean.2017.05.006�. �hal-01622041�
Accepted Manuscript
Glider and satellite monitoring of the variability of the suspended particle dis-tribution and size in the Rhône ROFI
Gaël Many, François Bourrin, Xavier Durrieu de Madron, Anouck Ody, David Doxaran, Pierre Cauchy
PII: S0079-6611(17)30050-2
DOI: http://dx.doi.org/10.1016/j.pocean.2017.05.006
Reference: PROOCE 1804
To appear in: Progress in Oceanography Received Date: 11 February 2017
Revised Date: 12 May 2017 Accepted Date: 13 May 2017
Please cite this article as: Many, G., Bourrin, F., Durrieu de Madron, X., Ody, A., Doxaran, D., Cauchy, P., Glider and satellite monitoring of the variability of the suspended particle distribution and size in the Rhône ROFI, Progress in Oceanography (2017), doi: http://dx.doi.org/10.1016/j.pocean.2017.05.006
This is a PDF file of an unedited manuscript that has been accepted for publication. As a service to our customers we are providing this early version of the manuscript. The manuscript will undergo copyediting, typesetting, and review of the resulting proof before it is published in its final form. Please note that during the production process errors may be discovered which could affect the content, and all legal disclaimers that apply to the journal pertain.
Glider and satellite monitoring of the variability of the suspended particle
distribution and size in the Rhône ROFI
Gaël Many1, 2*, François Bourrin1, Xavier Durrieu de Madron1, Anouck Ody3, David Doxaran4, Pierre Cauchy5.
1
CEFREM, UMR 5110 CNRS, UPVD, 52 Avenue Paul Alduy, 66860 Perpignan, France.
2
SHOM, 13 Rue de Châtellier, CS92803, 29228 Brest, France.
3
MIO, UMR 7294 CNRS, IRD, Aix Marseille University, Campus de Luminy, 13288 Marseille Cedex 9, France.
4
LOV, UMR 7093 CNRS, UPMC, 181 Chemin du Lazaret, 06230 Villefranche-sur-mer, France.
5
COAS, School of Environmental Sciences, University of East Anglia, Norwich NR4 7TJ, UK.
*Corresponding author: Gaël MANY (gael.many@univ-perp.fr)
Highlights:
- High-resolution description of the variability of nepheloid layers in the Rhône ROFI
- Evidence of the Rhône River as a major supplier of the bottom nepheloid layer
- Evidence of a storm-induced nearshore break of the plume stratification
Abstract
An experiment was carried out in the Gulf of Lions (NW Mediterranean) in February 2014 to assess the temporal and spatial variability of the distribution and size of suspended particulate matter (SPM) in the Rhône Region of Freshwater Influence (ROFI). A set of observations from an autonomous underwater glider, satellite ocean color data, and meteorological and hydrological time-series data highlighted the high variability of the Rhône River surface turbid plume and presence of a bottom nepheloid layer (BNL) that depended on wind and river discharge conditions. While continental winds pushed the surface plume offshore, marine winds pressed the plume at the coast and favored the sedimentation of as well as nourishment of the BNL. Moderate storm events favored breakage of the plume stratification and along-shelf transport of Rhône River particles. The spectral slopes of glider and satellite-derived light backscattering coefficients, γ, were used as a proxies of the SPM size distribution. The results clearly showed that the change of the SPM size in the nepheloid layers was induced by the flocculation of fine sediments, which became finer seaward throughout the ROFI, as well as the effect of rough weather in the breakup of flocs.
Keywords:
1. Introduction
River plumes, which are the primary signature of continental inputs of freshwater as well as dissolved and particulate materials, can influence stratification and circulation patterns, sediment and nutrient budgets, biogeochemistry processes and pollution in coastal waters (Dagg et al., 2004; Nittrouer et al., 2009; Simpson and Sharples, 2012). They remain poorly documented regarding in-situ monitoring of their spatio-temporal variability, which is strongly affected by the intensity of river discharge and wind conditions (Garvine, 1995). These forcings also strongly affect the transport of suspended particulate matter (SPM) from the continent to the shelf sea, the specific particle dynamics (aggregation/disaggregation, settling velocity) of which primarily depend on their concentration, size, and density (Curran et al, 2007; Manning and Schoellamer, 2013).
Over the past decade, different works on river plume dynamics have been conducted with ocean color imagery of surface SPM (Thomas and Weatherbee, 2006; Lihan et al., 2008; Saldías et al., 2012; Fernández-Nóvoa et al., 2015; Ody et al., 2016). These authors described the benefits of such observations in the description of the large-scale spatial and temporal variability of river plumes. Nevertheless, satellite data provide information about neither the vertical structure of river plumes (as water stratification, plume thickness, SPM vertical gradient) nor the characteristics of bottom nepheloid layers (BNL). In-situ monitoring throughout the water column is thus essential to assess the link between surface plumes and BNL that plays a major role in sedimentary transport and deposition (Bourrin et al., 2015). The recent use of coastal gliders has made it possible to reduce this lack of knowledge in the water column. Castelao et al. (2008a, 2008b) first used a coastal glider to describe the dynamic of a river plume in response to upwelling winds. More recently, Saldías et al. (2016) used glider and satellite observations of salinity to characterize the seasonal variability of the Columbia River plume. To our knowledge, however, there are no studies that have characterized the structure and variability of nepheloid layers in ROFI using SPM measurements from both gliders and satellites. A need exists in the high frequency observations of the 3-D temporal variability of SPM concentrations and size in ROFIs during flood events (Nittrouer et al., 2009; Simpson and Sharples, 2012).
This work brings together a comprehensive set of hydrological, hydrodynamical, and optical measurements collected from a coastal buoy, a satellite and a glider in the Rhône River ROFI. It aims at: 1) assessing the temporal variability of the Rhône River ROFI nepheloid layers
during a flood event and different wind conditions, and 2) determining the temporal variability of the SPM size.
2. Regional setting
In the semi-enclosed Mediterranean Sea, the inputs of freshwater and sediment are of paramount importance for the sedimentary budgets at both the local and Mediterranean scales. The Po and Rhône rivers alone account for approximately 30% of the freshwater discharge to the Mediterranean (Ludwig et al., 2009; Sadaoui et al., this issue). Because of the importance of their freshwater inputs and the large extent of their ROFIs, these rivers are key control factors of the particle dynamics for the Gulf of Lions and the Adriatic shelves, respectively.
The Gulf of Lions (NW Mediterranean) is a wide continental shelf mostly influenced by the inputs of particulate matter from the Rhône River, which represents on average between 80 and 95% of the total inputs to the gulf (Bourrin et al., 2006; Sadaoui et al., 2016). The Rhône River has a mean annual discharge of 1700 m3 s-1 and typical annual floods with discharge higher than 5000 m3 s-1 (Maillet et al., 2006). According to Pont (1996), floods deliver 70% of the annual sediment load, highlighting the pivotal role of these events in the delivery of SPM to the coastal area. During floods, freshwater and sediment delivered by the Rhône River form a surface plume and a BNL that can spread over the shelf (Aloisi et al., 1982). Previous works focused on the remote sensing of the plume extent (Arnau et al., 2004; Lorthois et al., 2012; Ody et al., 2016) or used shipborne in situ measurements to characterize the suspended particles in the water column (Naudin et al., 1997; Thill et al., 2001; Many et al., 2016). The plume is generally advected seaward across the shelf by surface currents driven by continental (i.e., northerly) wind or restricted to the coast during marine (i.e., southeasterly) wind events (Broche et al., 1998; see also modelling works of Marsaleix et al., 1998; Estournel et al., 2001; Ulses et al., 2008). The coastal area generally presents a strong seaward decrease of surface SPM concentrations due to the dilution of the plume and the settling of large particles (such as sand and silt) on the prodelta off the river mouth. This settling is enhanced by the flocculation of fine sediments that enables the settling of “flocs” closer to the coast (Naudin et al., 1997; Many et al., 2016). Near the seabed, the BNL extends over the inner shelf off the river mouth and presents a seaward decrease of the SPM concentration and size (Durrieu de Madron and Panouse, 1996; Many et al., 2016). On the Rhône prodelta, the BNL is fueled by the settling of large particles from the river plume (Many et al., 2016). Resuspension induced
by waves, especially during storm events, also contributes to the supply of the BNL (Durrieu de Madron et al., 2008; Dufois et al., 2014).
3. Material & Methods
3.1 Presentation of the experiment
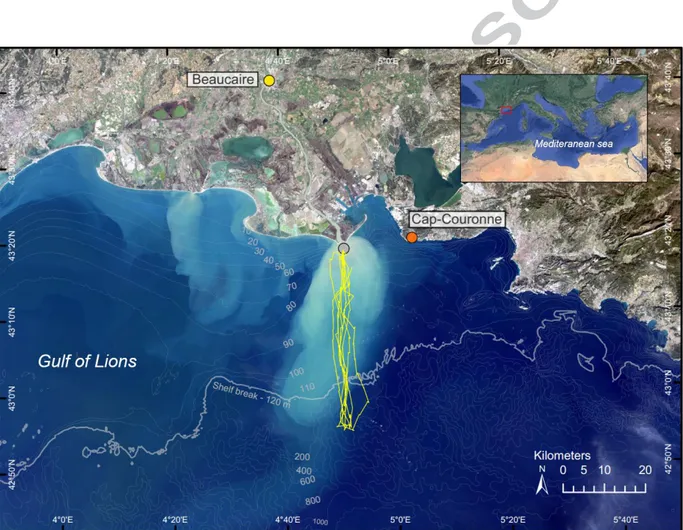
Time-series measurements of the coastal MESURHO buoy (43°19.130’N; 4°51.980’E, 20 m depth, 2.6 km off the Rhône River mouth) were used to describe the meteorological and oceanic conditions in front of the Rhône River mouth. Additionally, a SLOCUM glider was deployed within the Rhône ROFI during a 14-day period (January, 30 to February, 12 2014). Seven complete cross-shelf sections (Fig. 1) were carried out from the coast to the shelf edge (40 km offshore – 120 m depth).
Figure 1 – RGB geo-referenced OLI image (Landsat-8) of the Rhone River plume (23 February 2014). Glider cross-shelf deployment (30 January – 12 February, 2014 – 7 sections) is shown in yellow. The position of the coastal MESURHO buoy is shown by a gray dot, 2.6 km off the Rhône river mouth. The Beaucaire gauging station and Cap-Couronne wind station are shown by yellow and orange dots, respectively. Depth contour lines are shown in gray.
3.2 Nearshore hydrological, hydrodynamical and meteorological observations
Meteorological time-series - Hourly (10 minute burst average) wind speed and direction were
measured at the Cap-Couronne Météo-France Station (43°20'.230’N; 5°01.380’E). We derived the wind stress at the sea surface, τ, expressed in N m-2
, following Equation 1:
τ = Wf2 × ρair × CD Eq. 1
where Wf is the wind speed (m s-1), ρair the air density (assumed to be 1.22 kg m-3) and CD the
drag coefficient of 1.3 × 10⁻³ (Large and Pond, 1981).
Rhône river time-series – The daily Rhône River discharge was measured at the Beaucaire
gauging station, 50 km upstream from the river mouth (Compagnie Nationale du Rhône - code V7200015).
MESURHO buoy time-series - Currents and waves were measured using a 600 kHz
upward-looking RDI ADCP fixed at the bottom (27 m) of the MESURHO buoy off the Rhône River mouth (Pairaud et al., 2016). Hourly mean horizontal currents (1 m bin) were estimated from the high frequency horizontal current profiles. Wave directions were estimated by computing near-surface waves orbital, pressure and surface track (Teledyne RD Instruments, 2007). High-frequency wave measurements were then averaged over 20 min period every 3 h.
ADCP’s backscatter index (BI in dB) was derived from the sonar equation (Eq. 2). Because of the sensitivity of acoustic sensors to large particles (as aggregate and zooplankton), BI was only used as relative information concerning the SPM concentration, complementary to optical sensors more sensitive to fine sediments. It can be calculated by adding the echo intensity (EI) received by the instrument, the transmission loss by the sound absorption in seawater (Tlw), the beam spherical spreading (Tlg) and the constant A, which incorporates the
emitted intensity and the time- and distance-independent coefficients (Gartner, 2004; Gostiaux and Van Haren, 2010).
BI = EI + Tlw + Tlg + A Eq. 2
Tlw and Tlg depend on the temperature (13°C) and salinity (38) of seawater, the beam angle
(20°), the distance to the ensonified SPM volume and the absorption coefficient. We assumed these parameters to be constant in space and time.
3.3 Glider CTD and optical observations
The autonomous underwater glider (30 – 200 m) used for this work is a Teledyne Webb Research Slocum G1 (Davis et al., 2002). Conductivity, temperature and pressure measurements were made by an un-pumped SeaBird 41cp CTD. Conductivity and temperature measurements were corrected for thermal lag effect to avoid salinity bias (Garau et al., 2011). Salinity and density were derived following the equation of EOS-80 (UNESCO, 1983). A Wetlabs FLNTU provided turbidity (expressed in nephelometric turbidity units – NTU) based on light backscattering measurements at 700 nm. We used the calibration of Many et al. (2016), established during the same deployment and based on in situ SPM gravimetric measurements, to convert NTU in mg L-1. A Wetlabs BB2FLS provided light backscattering measurements (m-1 sr-1) at 532 and 660 nm.
The glider moved in a sawtooth-shaped trajectory (generally with a pitch angle of 25°) between the surface (1 m depth) and the seabed (2 meters above bottom (mab)). We generally observed an average horizontal speed of 0.4 m s-1 with an average vertical speed of 0.2 m s-1. Each section was generally performed in 1.5-2 days. It is thus important to note that a glider section cannot be considered as a snapshot of the coastal sea and can present different processes along the glider track depending on wind and river discharge conditions. When surfacing every 6 dives, the glider took GPS fixes and corrected its navigation toward the next waypoint. Data were first projected along a N-S transect and then interpolated within a 1 m vertical and 100 m horizontal resolution grid.
3.4 Optical, hydrodynamical and hydrological derived parameters
Spectral slope estimate – We computed the spectral slope (
γ
Glider) of glider particulate lightbackscattering coefficients (bbp(λ)) at 532, 660 and 700 nm to describe the spatial and
temporal variability of the particulate assemblage within the Rhône ROFI (Boss et al., 2001). FLNTU (λ = 700 nm) and BB2FLS (λ = 532 and 660 nm) sensors provided light scattering measurements (β(θ,λ)) at specific angles θ = 142° and θ =124° in the backward direction
(Sullivan et al., 2010). The BB2FLS sensor directly gives output in m-1 sr-1, while measurements of the FLNTU (factory calibrated in NTU) were converted to extract the volume scattering function thanks to the Beta Scale Factor provided by the manufacturer (i.e., the NTU Scale Factor multiplied by a coefficient of 2.5 × 10⁻³). We did not correct values of (β(θ,λ)) for loss by absorption due to negligible effects (a few % of the total signal measured). For each sensor, we estimated the volume scattering function of particles (βp(θ, λ)), by
subtracting the molecular scattering of pure water (Morel, 1974). The particulate backscattering coefficients (bbp(λ)) (m-1) were finally derived following (bbp(λ)) =
2π.X.(βp(θ,λ)), where X is an adjustment factor provided by the manufacturer according to
particle type (1.077 for the BB2FLS and 1.132 for the FLNTU).
From Morel (1973) and Babin et al. (2003), the light scattered by suspended marine particles depends on the particle size distribution and is wavelength-dependent. The above authors described this variation as a power law approximation in the case of spherical, homogeneous and non-absorbing particles: bbp(λ)=bbp(λ0).( λ/ λ0)- γGlider,where λ0is the reference wavelength
and
γ
Glider the spectral slope.γ
Glider was thus calculated as the slope of the linear relationshipbetween loge(bbp(λ)) and loge(λ), using λ = 532, 660 and 700 nm (i.e., the lower the
γ
Glider, thehigher the proportion of large particles to the total particle assemblage, and reciprocally).
Coastal along-shelf current estimate – The glider “drift”, i.e., the difference between the
glider’s expected surfacing location and the actual new GPS position, was used as an estimate of horizontally depth-averaged current between two surfacings (Webb Research Slocum manual, 2005). To further characterize the current, we estimated geostrophic velocities to determine how much the flow perpendicular to the section was affected by the density field. The glider’s interpolated density field was used to estimate the baroclinic component of the geostrophic velocities. Then, we derived the E-W velocity field (i.e., normal to the gliders’ section) by adjusting the depth-averaged geostrophic velocities to the corresponding glider’s drift. This fitting was made by estimating the difference between both depth-averaged velocities. The difference was then added to each geostrophic velocity profile to find a final depth-averaged velocity equal to the depth-averaged velocity derived from the glider drift. This correction includes the barotropic geostrophic and ageostrophic terms, such as currents induced by surface wind stress and bottom friction.
Hydrological derived parameters - The Brunt-Väisälä frequency (N - Eq. 3) was used as an
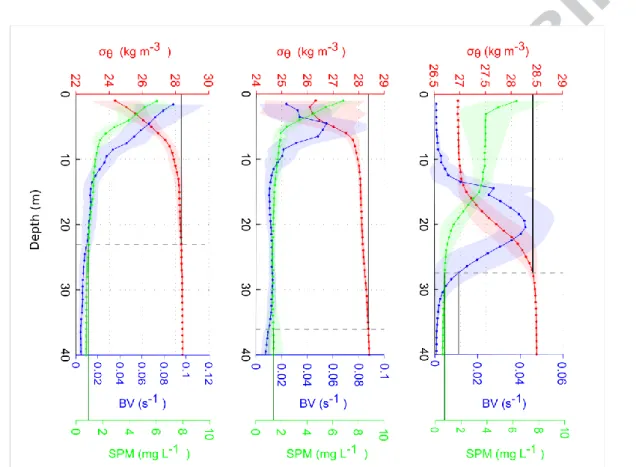
indicator of the stratification. One maximum, indicative of the pycnocline between the colder and fresher plume and the shelf water, appeared on the different sections (Fig. 2). A threshold of N = 0.01 s-1 was used to delimit the pycnocline and defined the lower limit of the plume, which corresponded to the 28.3 0.1 kg m-3 isopycnal (Fig. 2).
Figure 2 – Example of vertical profiles (average: solid line; standard deviation: shaded region) of potential density anomaly (red), Brunt-Väisälä frequency (blue) and SPM concentration (green) for different glider sections performed in the Rhône River plume in February 2014. A threshold of 0.01 s-1 is used to define the lower limit of the pycnocline (gray line). Lower limit of the plume in terms of SPM concentration and density anomaly are shown in green and black, respectively.
We used the dimensionless Richardson number (Ri – Eq. 4) to estimate the mixing intensity by comparing the Brunt-Väisälä frequency to the vertical gradient of the horizontal current velocity (Pacanowski and Philander, 1981).
N = √ (-g/ρ) δρ/δz Eq. 3
Ri = N² / (δu/δz) ² Eq. 4
where g is the acceleration of gravity (m² s-1), ρ the potential water density (kg m-3) and u the E-W (i.e., along-shelf) current velocity component (m s-1) estimated from glider measurements (i.e., geostrophic velocities adjusted to the glider drift). The stratification is stable for N > 0 and vice-versa. The Richardson number, which defines the mixing intensity, is equal to 0.25 in a stable flow and Ri < 0.25 if the turbulence overcomes the density stratification and generates vertical mixing (Turner, 1973).
3.5 Satellite data
Spatial maps of SPM concentrations (250 m resolution) were generated from Moderate Resolution Imaging Spectroradiometer (MODIS) data recorded onboard the Aqua satellite platform. Intermediate Level 1-A (L1A) products were downloaded from the NASA Ocean Color website (http://oceancolor.gsfc.nasa.gov/cms/). Processing was completed using SeaDAS (version 7.0) software to generate geo-referenced and radiometrically calibrated Level 1-B (L1B) files. L2 remote sensing reflectance products at 645 nm (Rrs(645)) were generated using the l2gen function. The MUMM atmospheric correction (Ruddick et al., 2000) was used because it is the most appropriate to correct MODIS data from aerosol effects in the moderately turbid waters of the Rhône River plume (Ody et al., 2016). Rrs(645) was converted to SPMmg L-1 applying the regional equation established by Ody et al. (2016). The
same authors studied the surface plume dynamics and fixed a threshold of 10 mg L-1 to characterize the plume boundary when using this regional equation. Thus, we used a similar value to determine the extent of the surface plume. We derived the particulate backscattering coefficient bbp(λ) at 10 MODIS wavebands between 412 and 678 nm applying the QAA (Quasi-Analytical Algorithm) (Lee et al., 2002, 2013). QAA derives the absorption and backscattering coefficients by analytically inverting the spectral remote-sensing reflectance. The spectral bbp(λ) is modeled assuming that both pure water and particles contribute to the total backscattering coefficient, and assuming that the spectral variations of bbp(λ) follow a power-law function. The spectral slope of the particulate backscattering coefficient, γMODIS,
A filter was applied on γMODIS to exclude slope values obtained from power-law functions
fitted with a R² coefficient lower than 0.9. Excluded values generally corresponded to SPMMODIS > 35 mg L-1 and were located close to the river mouth during peak discharges.
γMODIS is further used as relative information of the surface spatial variability of the
particulate assemblage (i.e., the lower the spectral slope, the higher the abundance of large particles, see 3.4).
Concomitant MODIS and surface glider data of SPM concentrations and backscattering spectral slope estimates were determined using a 6-hour window (3-hours before and after the satellite image was taken, see Saldías et al., 2016). This window is commonly used. While it increases uncertainty due to the different sampling time, it increases the amount of data used to compare satellite and in situ data.
4. Results
4.1 Meteorological and oceanic conditions
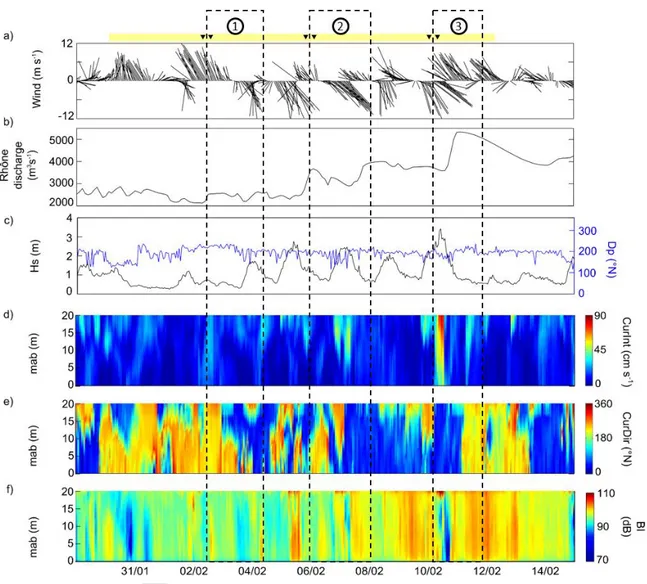
During the experiment, different wind conditions were observed. North-westerly (i.e., continental) winds were measured on January 30, February 2 (Situation 1) and 11 (Situation 3), 2014, with a maximum wind speed of 12 m s-1. Several south-easterly (i.e., marine) wind events of ~10 m s-1 occurred on February, 5-7 (Situation 2), 8 and 10, 2014, which led to precipitation over the Rhône water catchment (Fig. 3a) and resulted in a rapid increase of the Rhône discharge from 3500 m3 s-1 (February 5) to 5500 m3 s-1 (February 11) (Fig. 3b). During these SE wind events, waves mainly came from the south with significant height ranging from 2 to 3.5 m (Fig. 3c). Currents were stronger and generally oriented toward the north (maximum current speed was observed during such an event on February 10). Conversely, currents were weaker and oriented toward the south for NW winds.
ADCP echo intensity showed that SPM concentrations in the water column followed the increase of the Rhône River discharge and wave height conditions with a maximum acoustic intensity at the peak of the flood. During episodic high waves and strong northward currents (February, 10), a drastic decrease of SPM concentrations was observed throughout the water column (Fig. 3f). Dash-line boxes on Figure 3 represent the three situations describe hereafter. Meteorological and hydrodynamical conditions during these situations are summarized in Table 1. The third situation (February, 10-11) is further qualified as a “back-to-back” storm and flood event due to the marine storm occurring on February, 10 (i.e., marine winds > 10 m s-1 and waves > 3 m) and the subsequent flood event on February, 11.
Figure 3 – Time-series from January 30 to February 15, 2014 of: (a) the hourly mean wind speed and direction, (b) the Rhône River daily-mean discharge, (c) the significant wave height and direction, (d) the hourly mean current speed and (e) direction, and (f) the backscatter index. The duration of the glider deployment is shown in yellow above (a). Black triangles show when the glider was close to the MESURHO buoy. The dash-line boxes show the 3 situations discussed. Wind and wave directions indicate the direction from which the wind and waves are coming.
Table 1 – Meteorological and hydrodynamical conditions at the MESURHO buoy station for the 3 situations discussed.
Situation 1 Situation 2 Situation 3* Date 2-3 Feb 2014 6-7 Feb 2014 10-11 Feb 2014
Rhône River discharge (m3 s-1) 2440 3500 3600 - 5340
Prevalent wind speed (m s-1) 10.1 6.7 8.1 - 11.9
Prevalent wind direction (°N) 165 352 170 - 340 Maximum wave significant height (m) < 1 2 <1 – 3.5 Maximum current speed (m s-1) 0.1 0.4 0.1 – 0.9
Prevalent current direction (°N) 185 0 0 - 190 *Due to the “back-to-back” storm and flood events of the third situation both marine and continental wind events are detailed.
4.2 Glider cross-shelf CTD measurements
Temperature and salinity sections measured by the glider between January 30 and February 12, 2014 are presented in Figure 4. The results showed the cross-shelf extension of the Rhône River surface plume with fresher (<37.6), colder (<13.5°C) and lighter water (< 28.3 kg m-3).
During the first two sections (Fig. 4a-b), the plume was pushed offshore by continental winds. During the following three sections, under a prevailing S-SE wind (Fig. 4c-e), the plume was pressed against the coast and its thickness increased. The sixth section (Fig. 4f) showed a larger plume, which extended offshore due to continental wind and an increase of the Rhône discharge. Due to the glider direction, we monitored the structure of the plume close to the coast twice within a small time interval (i.e., a few hours during the 10 February 2014). During this period, the plume separated from the river mouth and deepened to 50 m deep. The seventh section (Fig. 4g) showed the largest plume, which extended up to 45 km offshore, associated with the large discharge of the Rhône River. Finally a notable decrease in temperature was observed near the bottom, forming a distinct layer extending southward with a thickness of 15 m.
Figure 4 – Cross-shelf hydrological sections of temperature (left panel) and salinity (right panel) measured by the glider. Density contour lines are shown in black and white on the temperature and salinity sections, respectively. White arrows in the bottom-left corner of each
temperature section represent the direction of the glider trajectory. The position of the MESURHO buoy station is shown by a black triangle over the first section. From top to bottom, the seven sections carried out by the glider. The three situations discussed hereafter are numbered from 1 to 3. The 28.3 kg m-3 isopycnal delimits the base of the surface plume.
4.3 SPM concentrations and properties from glider and satellite
Comparison of glider and satellite surface SPM measurements – The comparison between
glider and satellite-derived γ (dimensionless) and (SPM)mg L-1 measurements is presented
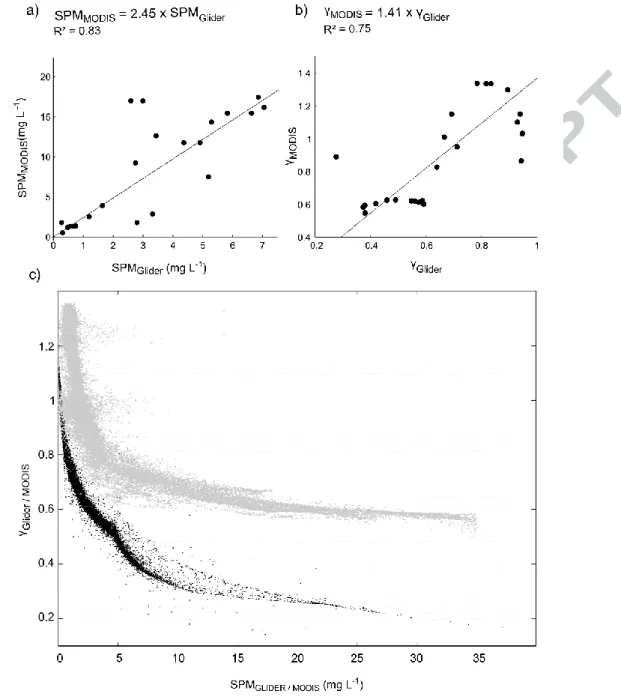
Figure 5. For both glider and satellite data, γ rapidly decreased with the increasing SPM concentration, indicating an increase of the abundance of flocs with SPM concentration. Moreover, the shift between the two populations suggested contrasting particle assemblages between thin surface layers sensed by the satellite (<1 m according to the wavelength used and the SPM concentration observed based on the work of Ouillon (2003) in the Ebro River plume) and the underlying layer (1-2 m depth) sampled by the glider.
Figure 5 – Relationship between glider and satellite-derived a) (SPM)mg L-1 and b) γ
(dimensionless). Relationship between
γ
Glider/MODIS and (SPM)Glider/MODISmg L-1 for the 0-35 mgL-1 range. Satellite (February 11, 2014) Satellite measurements are in gray. Glider measurements are in black.
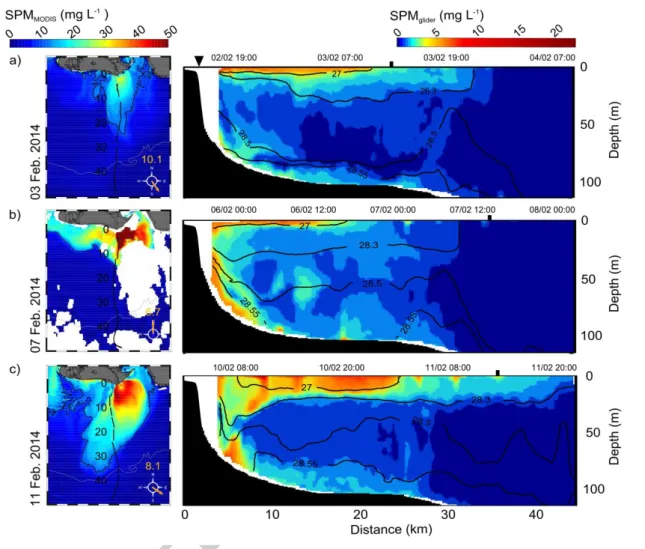
Nepheloid layers dynamics – Three situations were selected to characterize the SPM
dynamics in the ROFI for different river discharges, wind and sea conditions (Fig. 6). The dimensions of the surface plume are derived from both satellite measurements using a
threshold of 10 mg L-1 (Ody et al., 2016), and glider measurements using a density threshold of 28.3 kg m-3 (defining the base of the pycnocline).
Under a continental prevailing wind and a moderate river discharge (Situation 1 in February 4, Fig. 6a), the vertical distribution of surface SPM concentrations closely corresponded to the thermo-haline structure of the surface plume. Satellite observations showed that the plume presented a seaward gradient of SPM concentrations from 28 to 10 mg L-1 from the river mouth to 22 km offshore. Glider surface observations showed a similar decrease from 13 to 2 mg L-1 with the largest SPM concentrations (> 5 mg L-1) restricted by the 27 kg m-3 isopycnal. A thin BNL was observed over the shelf and presented SPM concentration of 1-2 mg L-1.
During a marine prevailing wind (Situation 2 on February 7, Fig. 6b), the plume remained over the shelf and thickened to 30 m depth. The entire water column showed a SPM concentration of 2 mg L-1. The most turbid part of the plume restricted by the 27 kg m-3 isopycnal was pressed against the coast. Satellite observations showed a similar trend and were completed with glider measurements that showed a more turbid BNL (2.5-5 mg L-1) 10 km off the river mouth. During the storm event (Situation 3 on February 10, Fig. 6c), glider measurements showed the thickening of the plume down to 50 m depth. At the same time, the BNL presented higher SPM concentrations close to the coast. During the subsequent flood event (Situation 3 on February 11), the plume extended up to 45 km offshore and showed the highest SPM concentrations between 10 and 25 km off the river mouth.
Figure 6 – Left panels: Surface SPM concentrations retrieved from satellite data. The distance from the coast (km) and along the glider track is shown in black. Date and wind speed and direction are specified. The threshold of 10 mg L-1 used for comparison with glider measurements is shown in black. Clouds are shown in white. Right panels: Corresponding glider sections of SPM concentrations. Density contour lines are shown in black. The MESURHO buoy is shown by a black triangle above the first section. The time the satellite image was taken is shown by a black square on each glider section. From top to bottom, the three situations discussed. Note the different color bars used for the satellite and glider observations.
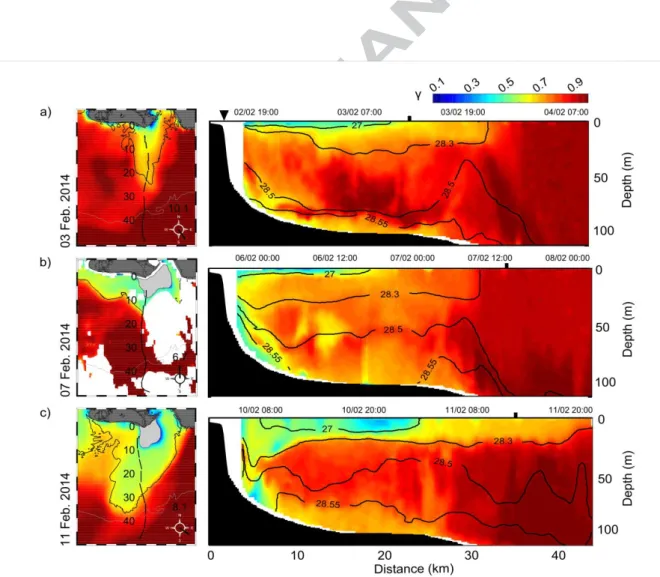
SPM properties variability – We used the spectral slopes of glider and satellite-derived
backscattering measurements, γGlider and γMODIS, as indexes of the particle assemblage
properties (Fig. 7). Both indexes ranged from 0.3 to 1.4 and highlighted variable particulate assemblages in nepheloid layers depending on meteorological and sea conditions. From our
results, both indexes were clearly linked with the SPM concentration: the higher the SPM concentration, the higher the proportion of large flocs in the particulate assemblage (i.e., low γ). The lower γ values were generally observed in the most turbid area of the plume restricted by the 27 kg m-3 isopycnal.
Under a continental prevailing wind and a moderate river discharge (Situation 1 in February 4, Fig. 7a), both γ indexes showed that the plume close to the river mouth was characterized by increasing values with distance from the river mouth. Larger γ values were also observed in the BNL. During a marine prevailing wind (Situation 2 on February 7, Fig. 7b), when the plume was pressed against the coast, γ indexes decreased in both the inner parts of the plume and the BNL. During the storm and subsequent flood event (Situation 3 on February 11, Fig. 7c), γ generally decreased in the plume that significantly thickened and widened. Close to the seabed, the BNL showed lower γ values close to the coast.
Figure 7 – Left panels: Surface estimated γMODIS from satellite data. The distance from the
specified. SPM concentration threshold of 10 mg L-1 used for river plume description is shown in black. Right panels: Corresponding sections of γglider. Density contour lines are
shown in black. The MESURHO buoy is shown by a black triangle above the first section. The time the satellite image was taken is shown by a black square on each glider section. From top to bottom, the three situations discussed.
4.4 Hydrodynamical and hydrological derived parameters
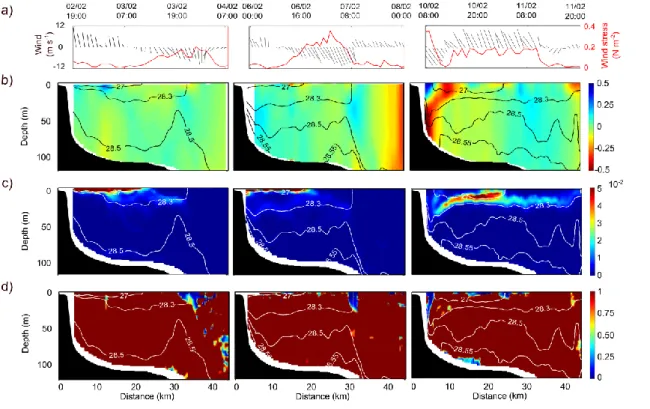
Along-shelf (E-W) current component, the Brunt-Väisälä frequency (N), and Richardson number (Ri) derived from glider measurements are presented in Figure 8. We present these observations together with wind and wind stress (τ) measurements for the three situations (Fig. 8a).
During the two first situations (left and middle panel in Fig. 8), the results showed the high subsurface (1-5 m) stratification of the plume. The Richardson number highlighted a probable mixing offshore (i.e., Ri < 0.25) between the frontal zone of the plume and outer shelf waters.
During the third situation (Fig. 8c – right panel), wind stress showed maximum value of 0.38 N m-2 under a marine prevailing wind (February 10, 2014 at 9:00 AM). At that time, the currents close to the coast were the strongest (50 cm s-1) and in opposite direction between the surface and the bottom layers. Moreover, N values were low throughout the water column and Ri values were lower than 0.25. During the subsequent flood and under a continental prevailing wind, high N between 10 and 40 km offshore highlighted the plume thickening (Fig. 8c).
Figure 8 – a) Time-series of wind speed and direction (m s-1). The wind stress is shown in red (N m-2). Cross-shelf section of b) the along-shelf current (m s-1), c) the derived Brunt-Väisälä frequency (s-1) and d) the Richardson Number (dimensionless). Density contour lines are shown in black on the upper panel and in white on middle and lower panels.
5. Discussion
Several studies emphasized the necessity of combining satellite and glider platforms and performing high spatial and temporal resolution measurements to properly characterize SPM dynamics in the coastal area, especially during energetic events (Castelao et al., 2008b; Bourrin et al., 2015; Miles et al., 2015; Saldías et al., 2016). Based on simultaneous use of satellite and glider observations, we intend here to better understand the variability of the dynamics of nepheloid layers and of particle characteristics in the Rhône River ROFI.
5.1 Nepheloid layers dynamics
The extent of the surface plume was derived both from satellite and glider data. We examine here the consistency of the estimates based on these two data sets. The estimate of the plume extent from satellite data was inferred solely from turbidity using a threshold value of 10 mg L-1 defined by Ody et al. (2016). It appears that this threshold in fact delimited the core of the plume when compared to the extent of the plume as defined by the glider data. The glider data allowed us to define the buoyant plume both in terms of turbidity and density, the latter being a more physically relevant parameter. Consequently, the plume dimension inferred from the satellite derived turbidity threshold rather matched the core of the plume delimited by the 27 kg m-3 isopycnal, as observed by the glider. This implies that a turbidity limit lower than 10 mg L-1 (typically 1 mg L-1 based on glider measurements (see. Fig. 2)) should have been considered using satellite data to define the actual size of the plume delineated by the 28.3 kg m-3 isopycnal. Hence, care must be taken when using only a turbidity criterion from satellite images to define the plume size.
Previous studies based on models (Marsaleix et al., 1998; Estournel et al., 2001) and observations from radars and drifters (Broche et al., 1998; Naudin et al., 2001) highlighted the variability of the thermo-haline structure of the surface plume under different wind and river discharge conditions. Remote sensing of the surface SPM completed these observations and showed the role of the wind-driven circulation in SPM transport, especially during flood events (Arnau et al., 2004; Lorthiois et al., 2012; Ody et al., 2016). Our observations are in line with these previous works, showing evidence of the agreement between the turbid and freshwater plumes and their rapid temporal variability.
Under continental prevailing wind and moderate river discharge (Situation 1), the plume was deflected and rapidly diluted offshore over the continental shelf, and a BNL developed
beneath it. This result suggest a persistent character of the vertical transfer of SPM in the ROFI towards the BNL during continental wind periods, probably because of the large particles sinking from the plume as shown by Many et al. (2016).
Under a marine prevailing wind (Situation 2), the plume was pressed against the coast, increasing the turbidity in both the surface plume and the BNL close to the river mouth (Fig. 6b). These observations suggest an increasing transfer of the Rhône River SPM to the BNL. Such a direct supply, which was poorly documented due to sampling difficulties (Aloisi et al., 1982; Lorthois et al., 2012), emphasizes the role of marine wind in the increase of the vertical transfer of particles from the plume toward the BNL. This transfer is believed to contribute to the sedimentation over the inner-part of the shelf where high sedimentation rates (20-40 cm y
-1
) were estimated (Maillet et al., 2006; Drexler and Nittrouer, 2008; Marion et al., 2010). Similar observations were made in other micro-tidal areas, e.g., the Po River ROFI (Palinkas et al., 2005; Milligan et al., 2007).
During the storm event (Situation 3 on February 10), the occurrence of large waves and a strong westward coastal jet probably enhanced the particle resuspension over the prodelta down to 70 m deep, and at the same time, transported river and resuspended material along the coast. We estimated a bottom shear stress induced by waves and currents of 0.2 Pa, which can resuspend non-cohesive sediment up to 25 µm in grain size according to the Sedtrans05 model (Neumeier et al., 2005). It stresses the role of storm events in the sediment redistribution from the prodelta to the shelf, and these findings are in agreement with previous studies on the stratigraphy off the Rhône prodelta by Drexler and Nittrouer (2008) and Marion et al. (2010) and on the modelling of sediment transport by Ulses et al. (2008) and Dufois et al. (2014). Additionally, the low Brunt-Väisälä frequency and Richardson number (see Fig. 8 – right panel) in this area indicated a breaking of the plume and mixing throughout the water column close to the coast. Several studies (Kirinus et al., 2012; Rogowski et al., 2014; Rong et al., 2014) described such a mixing of a buoyant plume induced by current-wave interactions.
5.2 Spatio-temporal variability of SPM properties
We compared the spectral slopes of glider (γGlider) and satellite-derived (γMODIS)
backscattering measurements as indexes of the SPM size. Both indexes ranged from 0.3 to 1.4, consistent with the estimates of Niewiadomska et al. (2008), Bourrin et al. (2015) and
Many et al. (2016) in the northwestern Mediterranean Sea, and showed similar decreasing trends with regards to SPM concentration (Fig. 5). These observations are consistent with previous studies of Boss et al. (2001) and Slade and Boss (2015), where the authors inferred a similar decreasing trend. It is noteworthy that γGlider followed the same tendency, no matter the
depth. γMODIS was significantly larger than γGlider, implying that satellite measurements
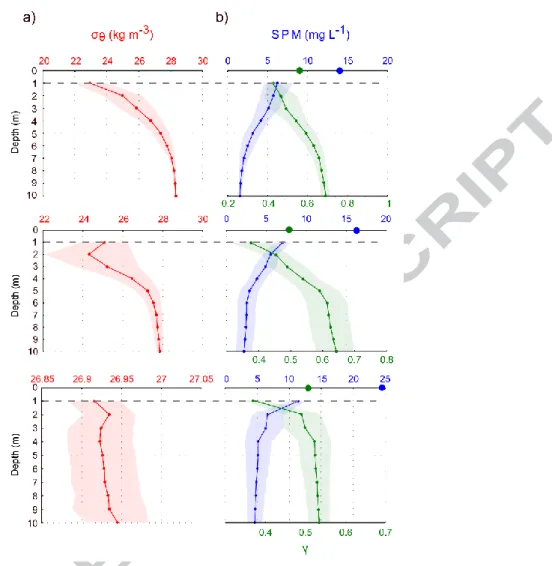
systematically saw finer particle assemblages, especially for large SPM concentrations, than glider measurements. The high stratification of the plume could be the main factor involved in differences observed between satellite, which primarily sensed the topmost meter (see 4.3), and the glider, which sampled below 1 m depth. Higher SPM concentrations might be found in the very superficial plume water due to the strong stratification within the plume (see Fig. 9). As a matter of fact, Ouillon (2003) stressed such stratification in the Ebro River plume, which presents similar characteristics to the Rhône River plume studied in this work. The density gradient in the top meters of the plume could also limit the mixing with underlying waters and thus limit the action of flocculation. The transition between both surface and subsurface layers within the plume appeared to be decisive in the variability of the SPM concentration and size and requires further investigations using an appropriate strategy. For instance, the glider could surface after each profile instead of “licking” the surface before diving, and also leave its sensors on while transmitting data and receiving mission orders during surfacing.
Figure 9 – Mean surface profiles of a) density anomaly (red) and b) SPM concentration (blue) and γ (green) estimated from glider measurements in the Rhône River ROFI. The standard deviation of each measurement is shown by shaded areas. Blue and green circles on b) show satellite-based estimates of the SPM concentration and γ. From top to bottom, the three situations discussed.
Additionally, whereas Many et al. (2016) proved in the same region under similar conditions that γGlider is representative of the SPM size spectra, γMODIS has not been calibrated against
direct measurements of the SPM size spectra. As a matter of fact, Sahay et al. (2011) showed that the derivation of the particulate backscattering coefficients (bbp(λ)), derived from remote sensing through the QAA approach (see 3.5), could present an overestimate of 20% and 43% for the 470 nm and 700 nm wavelengths, respectively. They based these estimates on in situ measurements and emphasized the variability existing between study areas and water types. This implies the need for an empirical relationship to improve the estimate of bbp through the
QAA approach in the Rhône ROFI using in-situ calibrations of the SPM size, especially close to the river mouth where the highest SPM concentrations (i.e., > 35 mg L-1) were measured and corresponded to saturated bbp and non-representative γMODIS.
Because the spatial and temporal distributions of γMODIS at the level of the surface plume
showed the same trends with that of γGlider, it can be considered that, apart from the offset, the
results are complementary. For marine wind conditions, when the Rhône River plume was pressed against the coast (Fig. 7b), γMODIS showed lower values that coincide with minimum
γGlider values in the whole water column. This likely results from a higher proportion of large
flocs that formed due to increasing SPM concentrations. Such flocs, which have a larger settling velocity, can rapidly reach the bottom layer and contribute to sustaining the BNL. This observation supports the hypothesis of Naudin et al. (1997), Thill et al. (2001) and Lorthiois et al. (2012), who identified the role of the flocculation in the rapid settling of particles close to the coast during flood events. Fox et al. (2004) and Milligan et al. (2007) also stressed the role of the flocculation in the fate and settling of SPM from the surface plume close to the Po river mouth in the Adriatic. During the storm event (Fig. 7c), γGlider
showed that the particle assemblage near the river mouth was finer throughout the water column. This diminution of the particle size is believed to result both from the breakup of flocs by turbulent motions induced by the large waves and a strong along-shore current. Moreover, wave-induced resuspension of sediment down to 70 m depth could enhance the flocculation close to the seabed and accentuate the SPM transport off the Rhône River ROFI in the BNL (see similar results in Curran et al. (2007) and Bourrin et al. (2015)).
6. Conclusion
The TUCPA experiment offered a unique set of observations on the high-frequency spatial and temporal variability of the Rhône River ROFI for different wind conditions and river discharges, including a flood event. The combination of coastal buoy monitoring, glider transects and satellite observations provided a detailed description of the hydrology, hydrodynamics and SPM characteristics in the ROFI.
The results emphasized the high variability of the Rhône River plume extent as well as the persistence of a bottom nepheloid layer. Three typical meteorological situations that are involved in the general transport and sedimentation of Rhône River particles have been detailed. Continental wind enhanced the offshore export of SPM within the surface river
plume, the thickness and concentration of which vary with the river discharge. Conversely, marine wind, which leads to wavy and flood conditions, limited the offshore dispersion of the river plume. This situation, thus, increased the surface SPM concentration and favored the formation of large particles by flocculation and their settling toward the BNL. Moreover, the BNL was also fed by the resuspension of sediment due to wave action. During a storm event, the results emphasized the role of waves and currents on the breakage of the plume stratification and resuspension of sediments down to a depth of 70, which favored the export of SPM off the ROFI.
The combination of both satellite and glider SPM measurements was determinant to monitor both surface (< 1 m depth, satellite data) and subsurface (> 1 m depth, glider data) parts of the river plume. The results from both platforms showed a similar pattern (i.e., increasing abundance of large particles – typically flocs – with increasing SPM concentrations), but different ranges, probably due to the strong stratification of the plume. The estimates of the index of the particle size distribution, γ, highlighted the larger proportion of flocs within the plume as well as the change of the particle assemblage, which became finer seaward in both the river plume and BNL due to the settling of flocculated particles. Finally, the use of this index permitted the identification of the role of rough weather on the breakup of flocculated particles during the storm event that favored the transport of finest sediments off the ROFI.
Acknowledgments
The corresponding author is funded through a PhD grant from the French ministry. This work was funded by the TUCPA project under the CNRS EC2CO DRILL Program, the MATUGLI project under the ANR ASTRID DGA Program (ANR-14-ASTR-0021-01), the AMORAD project under the ANR Program (ANR-11-RSNR-0002), and the MISTRALS-MERMEX Program. LOV work was funded by the European Community’s Seventh Framework Program under grant agreement n°606797 (HIGHROC project) and by the French Space Agency through the TTC TOSCA project. The MESURHO station deployment is part of the MESURHO Program involving IFREMER, IRSN, CNRS, CETMEF, and Phares et Balises. We thank the SOERE MOOSE for supporting and providing long-term observation data in the Gulf of Lions. We especially thank the French glider team, P. Testor and A. Boss for their help on the glider data processing. We also give a special thank you to S. Dykstra and Y. Leredde for their helpful discussion.
Bibliography
Aloisi, J.C., J.P. Cambon, J. Carbonne, G. Cauwet, C. Millot, A. Monaco and H. Pauc. 1982. « Origine et rôle du néphéloïde profond dans le transfert des particules au milieu marin. Application au Golfe du Lion. » Oceanologica Acta 5 (4): 481‑ 91.
Arnau, P., C. Liquete and M. Canals. 2004. « River mouth plume events and their dispersal in the Northwestern Mediterranean Sea ». Oceanography 17: 22‑31.
Babin, M., A. Morel, V. Fournier-Sicre, F. Fell and D. Stramski. 2003. « Light scattering properties of marine particles in coastal and open ocean waters as related to the particle mass concentration. » Limnology and Oceanography, 843‑59.
Boss, E., M.S. Twardowski and S. Herring. 2001. « Shape of the particulate beam attenuation spectrum and its inversion to obtain the shape of the particulate size distribution ». Applied
Optics 40 (27): 4885‑93.
Bourrin, F., X. Durrieu de Madron and W. Ludwig. 2006. « Contribution to the study of coastal rivers and associated prodeltas to sediment supply in the Gulf of Lions (NW Mediterranean Sea) ». Vie et Milieu 56 (4): 307‑14.
Bourrin, F., G. Many, X. Durrieu de Madron, J. Martín, P. Puig, L. Houpert, P. Testor, S. Kunesch, K. Mahiouz and L. Béguery. 2015. « Glider monitoring of shelf suspended particle dynamics and transport during storm and flooding conditions ». Continental Shelf Research 109 (10): 135‑49. doi:10.1016/j.csr.2015.08.031.
Broche, P., J.L. Devenon, P. Forget, J.C. de Maistre, J.J. Naudin and G. Cauwet. 1998. « Experimental study of the Rhone plume. Part I: physics and dynamics ». Oceanologica Acta 21 (6): 725‑38.
Castelao, R., S. Glenn, O. Schofield, R. Chant, J. Wilkin and J. Kohut. 2008a. « Seasonal evolution of hydrographic fields in the central Middle Atlantic Bight from glider observations ». Geophysical Research Letters 35 (3). doi:10.1029/2007GL032335.
Castelao, R., O. Schofield, S. Glenn, R. Chant and J. Kohut. 2008b. « Cross-shelf transport of freshwater on the New Jersey shelf ». Journal of Geophysical Research 113 (C7). doi:10.1029/2007JC004241.
Curran, K., P. Hill, T. Milligan, O. Mikkelsen, B. Law, X. Durrieu de Madron, F. Bourrin, 2007. « Settling velocity, effective density, and mass composition of suspended sediment in a
coastal bottom boundary layer, Gulf of Lions, France ». Continental Shelf Research 27, 1408– 1421
Dagg, M., R. Benner, S. Lohrenz and D. Lawrence. 2004. « Transformation of dissolved and particulate materials on continental shelves influenced by large rivers: plume processes. »
Continental Shelf Research 24 (7-8): 833‑58. doi:10.1016/j.csr.2004.02.003.
Davis, R.E., C.C. Eriksen and C.P. Jones. 2002. « Autonomous buoyancy-driven underwater gliders ». The technology and applications of autonomous underwater vehicles, 37‑58.
Drexler, T. M., and C. A. Nittrouer. 2008. « Stratigraphic signatures due to flood deposition near the Rhône River: Gulf of Lions, northwest Mediterranean Sea ». Continental Shelf
Research 28 (15): 1877‑94. doi:10.1016/j.csr.2007.11.012.
Dufois, F., R. Verney, P. Le Hir, F. Dumas and S. Charmasson. 2014. « Impact of winter storms on sediment erosion in the Rhone River prodelta and fate of sediment in the Gulf of Lions (North Western Mediterranean Sea) ». Continental Shelf Research 72: 57‑72. doi:10.1016/j.csr.2013.11.004.
Durrieu de Madron, X., and M. Panouse. 1996. « Transport de matière particulaire en suspension sur le plateau continental du Golfe du Lion. Situation estivale et hivernale ».
Comptes rendus de l’Académie des sciences. Série 2. Sciences de la terre et des planètes 322
(12): 1061‑70.
Durrieu de Madron, X., P.L. Wiberg and P. Puig. 2008. « Sediment dynamics in the Gulf of Lions: The impact of extreme events ». Continental Shelf Research 28 (15): 1867‑76. doi:10.1016/j.csr.2008.08.001.
Estournel, C., P. Broche, P. Marsaleix, J.L. Devenon, F. Auclair and R. Vehil. 2001. « The Rhone River plume in unsteady conditions: numerical and experimental results ». Estuarine,
Coastal and Shelf Science 53 (1): 25‑38. doi:10.1006/ecss.2000.0685.
Fernández-Nóvoa, D., R. Mendes, J.M. Dias, A. Sánchez-Arcilla and M. Gómez-Gesteira. 2015. « Analysis of the influence of river discharge and wind on the Ebro turbid plume using MODIS-Aqua and MODIS-Terra data ». Journal of Marine Systems 142: 40‑46.
Fox, J. M., P. S. Hill, T. G. Milligan and A. Boldrin. 2004. « Flocculation and sedimentation on the Po River Delta ». Marine Geology 203 (1–2): 95-107. doi:10.1016/S0025-3227(03)00332-3.
Garau, B., S. Ruiz, W.G. Zhang, A. Pascual, E. Heslop, J. Kerfoot and J. Tintoré. 2011. « Thermal Lag Correction on Slocum CTD Glider Data. » Journal of Atmospheric and Ocean Technology 28, 1065–1071.http://dx.doi.org/10.1175/JTECH-d-10-05030.1
Gartner, J. W. 2004. « Estimating suspended solids concentrations from backscatter intensity measured by acoustic Doppler current profiler in San Francisco Bay, California ». Marine
Geology 211 (3): 169‑87.
Garvine, R.W. 1995. « A dynamical system for classifying buoyant coastal discharges ».
Continental Shelf Research 15 (13): 1585‑96.
Gostiaux, L., and H. Van Haren. 2010. « Extracting meaningful information from uncalibrated backscattered echo intensity data ». Journal of Atmospheric and Oceanic
Technology 27 (5): 943‑49.
Kirinus P., E. Marques, J. Correa da Costa and E. Fernandes. 2012. « The contribution of waves in mixing processes of the Patos Lagoon plume ». International Journal of
Geosciences 3: 1019.
Large, W.G., and S Pond. 1981. « Open ocean momentum flux measurements in moderate to strong winds ». Journal of physical oceanography 11 (3): 324‑36.
Lee, Z., K.L. Carder., and R.A. Arnone. 2002. « Deriving inherent optical properties from water color: a multiband quasi-analytical algorithm for optically deep waters. » Applied
Optics, 41(27), 5755-5772.
Lee, Z., B. Lubac, J. Werdell, and R.A. Arnone. 2013. http://www.ioccg.org/groups/Software_OCA/QAA_v5.pdf.
Lihan, T., S. Saitoh, T. Iida, T. Hirawake and K. Iida. 2008. « Satellite-measured temporal and spatial variability of the Tokachi River plume ». Estuarine, Coastal and Shelf Science 78 (2): 237‑49. doi:10.1016/j.ecss.2007.12.001.
Lorthiois, T., D. Doxaran and M. Chami. 2012. « Daily and seasonal dynamics of suspended particles in the Rhône River plume based on remote sensing and field optical measurements. »
Geo-Marine Letters 32 (2): 89‑101. doi:10.1007/s00367-012-0274-2.
Ludwig, W., E. Dumont, M. Meybeck and Heussner, S. 2009. « River discharges of water and nutrients to the Mediterranean and Black Sea: Major drivers for ecosystem changes during past and future decades? » Progress in Oceanography, 80, 199-217.
Maillet, G., C. Vella, S. Berné, P.L. Friend, C.L. Amos, T.J. Fleury and A. Normand. 2006. « Morphological changes and sedimentary processes induced by the December 2003 flood event at the present mouth of the Grand Rhône River (southern France) ». Marine Geology 234 (1-4): 159‑77. doi:10.1016/j.margeo.2006.09.025.
Manning, A.J, and D.H. Schoellhamer. 2013. « Factors controlling floc settling velocity along a longitudinal estuarine transect ». Marine Geology 345 (11): 266-80.
Many, G., F. Bourrin, X. Durrieu de Madron, I. Pairaud, A. Gangloff, D. Doxaran, A. Ody, R. Verney, C., Menniti, D. Le Berre and M. Jacquet. 2016. « Particle assemblage characterization in the Rhone River ROFI. » Journal of Marine systems 157. 39-51. doi:10.1016/j.jmarsys.2015.12.010.
Marion, C., F. Dufois, M. Arnaud, and C. Vella. 2010. « In situ record of sedimentary processes near the Rhône River mouth during winter events (Gulf of Lions, Mediterranean Sea). » Continental Shelf Research 30 (9): 1095‑1107. doi:10.1016/j.csr.2010.02.015.
Marsaleix, P., C. Estournel, V. Kondrachoff and R. Vehil. 1998. « A numerical study of the formation of the Rhône River plume ». Journal of Marine Systems 14 (1–2): 99‑115. doi:10.1016/S0924-7963(97)00011-0.
Miles, T, S. Glenn and O. Schofield. 2013. « Temporal and spatial variability in fall storm induced sediment resuspension on the Mid-Atlantic Bight ». Continental Shelf Research 63 (7): S36‑49. doi:10.1016/j.csr.2012.08.006.
Miles, T., G. Seroka, J. Kohut, O. Schofield and S. Glenn. 2015. « Glider observations and modeling of sediment transport in Hurricane Sandy ». Journal of Geophysical Research:
Oceans 120 (3): 1771‑91. doi:10.1002/2014JC010474.
Milligan, T. G., P. S. Hill and B. A. Law. 2007. « Flocculation and the loss of sediment from the Po River plume ». Continental Shelf Research, Sediment Dynamics in the Western Adriatic Sea, 27 (3–4): 309-21. doi:10.1016/j.csr.2006.11.008.
Morel, A. 1973. « The scattering of light by sea water: Experimental results and theoretical approach. » Optics of the sea, interface and in-water transmission and imaging AGARD Lecture Series (61): 3.1.1‑3.1.76.
Morel, A. 1974. « Optical properties of pure water and pure sea water. » Optical aspects of
Naudin, J.J., G. Cauwet, M.J. Chrétiennot-Dinet, B. Deniaux, J.L. Devenon and H. Pauc. 1997. « River discharge and wind influence upon particulate transfer at the land–ocean interaction: case study of the Rhone River plume ». Estuarine, Coastal and Shelf Science 45 (3): 303‑16. doi:10.1006/ecss.1996.0190.
Naudin, J.J., G. Cauwet, C. Fajon, L. Oriol, S. Terzić, J.L. Devenon, et P. Broche. 2001. « Effect of mixing on microbial communities in the Rhone River plume ». Journal of Marine
Systems 28 (3–4): 203‑27. doi:10.1016/S0924-7963(01)00004-5.
Neumeier, U., C. Ferrain, C.L. Amos, G. Umgiesser and M. Z. Li. 2008. « SedTrans05: An improved sediment-transport model for continental shelves and coastal waters with a new algorithm for cohesive sediments. » Computer and Geosciences.
doi:10.1016/j.cageo.2008.02.007.
Niewiadomska, K., H. Claustre, L. Prieur and F. d’Ortenzio. 2008. « Submesoscale physical-biogeochemical coupling across the Ligurian current (northwestern Mediterranean) using a bio-optical glider. » Limnology and Oceanography 53 (5): 2210.
Nittrouer, C. A, J. A Austin, M. E. Field, J. H Kravitz, J. Syvitski and P.L Wiberg. 2009. « Continental margin sedimentation: From sediment transport to sequence stratigraphy. » Special publication 37 of the IAS Vol. 25. John Wiley & Sons.
Ody, A., D. Doxaran, Q. Vanhellemont, B. Nechad, S. Novoa, G. Many, F. Bourrin, R. Verney and I. Pairaud. 2016. « Potential of high spatial and temporal ocean color satellite data to study the dynamics of suspended particles in a non-tidal river plume. » Remote Sensing 8 (3): 245.
Ouillon, S. 2003. « An inversion method for reflectance in stratified turbid waters. »
International Journal of Remote Sensing 24 (3), 535-558.
Pacanowski, R.C., and S.G.H. Philander. 1981. « Parameterization of vertical mixing in numerical models of tropical oceans ». Journal of Physical Oceanography 11 (11): 1443‑51.
Palinkas, C.M., C.A. Nittrouer, R.A. Wheatcroft and L. Langone. 2005. « The use of 7Be to identify event and seasonal sedimentation near the Po River delta, Adriatic Sea ». Marine
Geology 222-223 (11): 95-112. doi:10.1016/j.margeo.2005.06.011.
Pairaud, I., Repecaud M., Ravel C., Fuchs R., Arnaud M., Champelovier A., Rabouille C., Bombled B., Toussaint F., Garcia F., Raimbault P., Verney R., Meule S., Gaufres P., Bonnat A., Cadiou J-F. 2016. « MesuRho. Plateforme instrumentée de suivi des paramètres environnementaux à l’embouchure du Rhône. » In Mesures à haute résolution dans
l'environnement marin côtier. 2016. Schmitt, F.G. et Lefebvre A. (Eds.). CNRS Alpha. ISBN
: 978-2-271-08592-4. pp.73- 87.
Pont, D. 1996. « Evaluation of water fluxes and sediment supply. » Oral Communication,
MEDDELT, Final Meeting, Venezia, October 2–5.
Rogowski, P., E. Terrill and J. Chen. 2014. « Observations of the Frontal Region of a Buoyant River Plume Using an Autonomous Underwater Vehicle ». Journal of Geophysical Research:
Oceans 119 (11): 7549‑67. doi:10.1002/2014JC010392.
Rong, Z., R. Hetland, W. Zhang and X. Zhang. 2014. « Current–wave interaction in the Mississippi–Atchafalaya river plume on the Texas–Louisiana shelf ». Ocean Modelling 84 (12): 67‑83. doi:10.1016/j.ocemod.2014.09.008.
Ruddick, K., F. Ovidio and M. Rijkeboer. 2000. « Atmospheric correction of SeaWiFS imagery for turbid coastal and inland waters ». Applied optics 39 (6): 897‑912.
Sadaoui, M., W. Ludwig, F. Bourrin and P. Raimbault. 2016. « Controls, budgets and variability of riverine sediment fluxes to the Gulf of Lions (NW Mediterranean Sea) ».
Journal of Hydrology 540: 1002-15.
Sadaoui M, W. Ludwig, F. Bourrin, E. Romeroc. « The impact of reservoir construction on riverine sediment and carbon fluxes to the Mediterranean Sea». Progress in Oceanography (this issue).
Sahay, A., P. Chauhan, P. Nagamani, N. Sanwalani and R. Dwivedi. 2011. « Backscattering of light by coastal waters using hyperspectral in-situ measurements: A case study off Veraval, Gujarat, India ». Indian Journal of Geo-Marine Sciences 40 (6): 762-769.
Saldías, G.S., M. Sobarzo, J. Largier, C. Moffat and R. Letelier. 2012. « Seasonal variability of turbid River plumes off central Chile based on high-resolution MODIS imagery ». Remote
Sensing of Environment 123 (08): 220‑33. doi:10.1016/j.rse.2012.03.010.
Saldías, G.S., R.K. Shearman, J.A. Barth and N. Tufillaro. 2016. « Optics of the offshore Columbia River plume from glider observations and satellite imagery ». Journal of
geophysical research, Oceans 121. doi:10.1002/2015JC0011431.
Simpson, J. H., and J. Sharples. 2012. « Introduction to the physical and biological oceanography of shelf seas ». Cambridge University Press.
Slade, W.H., and E. Boss. 2015. « Spectral attenuation and backscattering as indicators of average particle size. » Applied Optics 54, 7264-7277.
Sullivan, J.M., P.L Donaghay and J.E.B Rines, 2010. Coastal thin layer dynamics: consequences to biology and optics. Continental Shelf Research 30, 50–65. http://dx.doi.org/10.1016/j.csr.2009.07.009.
Teledyne RD Instruments. 2007. « Waves primer: Wave measurements and the RDI ADCP waves array technique. Available from RDInstruments.com. » http://www.rdinstruments.com/pdfs/waves_primer.pdf.
Thill, A., S. Moustier, J.M. Garnier, C. Estournel, J.J. Naudin and J.Y. Bottero. 2001. « Evolution of particle size and concentration in the Rhône river mixing zone: influence of salt flocculation ». Continental Shelf Research 21 (18): 2127‑40.
Thomas, A., and R. Weatherbee. 2006. « Satellite-measured temporal variability of the Columbia River plume ». Remote Sensing of Environment 100 (2): 167‑78. doi:10.1016/j.rse.2005.10.018.
Turner, J.S. 1973. « Buoyancy effects in fluids ». Cambridge University.
Ulses, C., C. Estournel, X. Durrieu de Madron and A. Palanques. 2008. « Suspended sediment transport in the Gulf of Lions (NW Mediterranean): Impact of extreme storms and floods ».
Continental Shelf Research 28 (15): 2048‑70. doi:10.1016/j.csr.2008.01.015.
UNESCO. 1983. « Algorithms for computation of fundamental properties of seawater ».
Technical papers in marine science 44: 53.
Webb Research Slocum Manual. 2005. « Operations manual Slocum shallow battery glider ». Ver. 1.6