HAL Id: tel-02058725
https://tel.archives-ouvertes.fr/tel-02058725
Submitted on 6 Mar 2019HAL is a multi-disciplinary open access archive for the deposit and dissemination of sci-entific research documents, whether they are pub-lished or not. The documents may come from teaching and research institutions in France or abroad, or from public or private research centers.
L’archive ouverte pluridisciplinaire HAL, est destinée au dépôt et à la diffusion de documents scientifiques de niveau recherche, publiés ou non, émanant des établissements d’enseignement et de recherche français ou étrangers, des laboratoires publics ou privés.
latex and of the rheological properties of resulting gels
Guilherme de Oliveira Reis
To cite this version:
Guilherme de Oliveira Reis. Study of the mechanism of acid coagulation of Hevea latex and of the rheological properties of resulting gels. Other. Université Montpellier, 2015. English. �NNT : 2015MONTS227�. �tel-02058725�
!
Délivré par l’Université de Montpellier
Préparée au sein de l’école doctorale SPSA
Et de l’unité de recherche UMR IATE
Spécialité: Biochimie, chimie et technologie des aliments
Présentée par Guilherme DE OLIVEIRA REIS
Soutenue le 10/12/2015 devant le jury composé de
Mr. Christophe CHASSENIEUX, Professeur, Université du Maine Rapporteur Mr. Fréderic PIGNON, Directeur de recherche, CNRS Grenoble Rapporteur Mr. Giuseppe FOFFI, Professeur, Université Paris-Sud Examinateur Mr. Frédéric BONFILS, Chercheur, CIRAD Directeur de thèse Mr. Christian SANCHEZ, Professeur, Université de Montpellier Directeur de thèse Mr. Paul MENUT, Maître de conférence, Montpellier Supagro Encadrant de thèse
! !
! !
Study of the mechanism of acid coagulation of
Hevea latex and of the rheological properties of
Study of the mechanism of acid
coagulation of Hevea latex and of the
rheological properties of resulting gels
by
Guilherme DE OLIVEIRA REIS
2015, December 10
Mr. Christophe CHASSENIEUX, Professor, Université du Maine Reporter Mr. Fréderic PIGNON, Research director, CNRS Grenoble Reporter
Mr. Giuseppe FOFFI, Professor, Université Paris-Sud Examiner
Mr. Frédéric BONFILS, Researcher, CIRAD Thesis director
Mr. Christian SANCHEZ, Professor, Université de Montpellier Thesis director
Je tiens à remercier tout d’abord mes quatre encadrants de thèse: Fréderic Bonfils, Christian Sanchez, Paul Menut et Laurent Vaysse. Nous avons, pendant ces trois années, pu échanger régulièrement de façon très constructive pour mon travail ainsi que pour ma vie personnel. Nos réunions scientifiques, avec un retard classique du aux retrouvailles au café, mon permis d’avancer avec enthousiasme et courage. Malgré les différentes spécialités de chacun, vous avez pu contribuer à mon développement scientifique. Nos échanges hors cadre de la thèse ont également permis de rendre le cadre de travail vraiment agréable. Je vous respecte beaucoup par vos caractère, professionnalisme et par votre amitié.
J’aimerais également remercier les personnes qui ont de près ou de loin participés à ma thèse. Tout d’abord, Karim Chelbi et Christine Char qui m’ont aidé tout au long de ma thèse sur le caoutchouc naturel en général. Merci encore a Karim pour tout, c’était vraiment un plaisir tous ces années à travailler ensemble, a sortir en ville et même à la salle de musculation. Je remercie également Denis Cassan qui m’a apporté un grand appui technique. Je remercie aussi Michael Nigen pour leurs conseils et ces discussions au laboratoire. Je remercie également à Michel Cloitre, Emanuella Zaccarelli et Luca Cipelletti avec qui nous avons eu des discussions très enrichissantes pendant mes comités de pilotage.
Je souhaiterais remercier également les membres du jury de ma thèse pour les échanges enrichissants que nous avons eu lors de ma soutenance. Je remercie les deux rapporteurs de ma thèse Christophe Chassenieux et Fréderic Pignon pour leur lecture attentive de mon manuscrit et leurs questions très pertinentes qui peuvent faire avancer le projet. Merci également à Giussepi Foffi, présidente du jury, pour avoir apporté leur point de vue sur notre travail.
Je remercie Sébastian Manneville très sincèrement pour m’avoir accueilli dans son laboratoire et par notre coopération. J’ai beaucoup appris techniquement et conceptuellement grâce à son ouverture d’esprit. Mes séjours à Lyon a été très enrichissant grâce à lui, mais également à tous les membres du groupe : Thomas Gibaud, Mathieu Leocmach et Brice Saint-Michel. Un grand merci à tous les membres de l’UMR IATE avec qui j’ai passé des grands moments aux laboratoires, entre deux couloirs et aux pauses café dans les différents bâtiments. Merci a Nath, Nono, Coco, Michel, George « le moustachou », Valérie, Céline et à tous ceux avec qui j’ai pu avoir plein des discussions enrichissantes. Merci à toutes les thésards et stagiaires de l’UMR spécialement aux anciens des bâtiments 31-37: Adeline « ma fidèle pote de bureau, congrès, sorties et un exemple de thésard », la maman « bordelaise » Mathilde, Brais, Santi, Vincent, B « the tex-mex » et la « chica » Liseth puis ceux du bâtiment 33: mon « poto » Erwann et les filles Claudinha, Erikinha et Christelle. Je n’oublie pas les nouveaux thésards: Nico le nouveau chef de bureau et Untappd, ma pote Be ☺, Chacha, Amélie, maman AH, Marianne, « la profe » Vero et Dani « el lobo ». Merci aussi à Tatiane Bazan pour son travail de stage rigoureux et par sa bonne humeur tous les jours.
sportifs et d’amitiés merveilleux. Chaque match ou apéro m’ont permis d’être relax pendant ma thèse même quand l’apéro durée plus que prévu. Merci encore a Erwann, également collègue du foot, apéros et de « healthy food » avant match.
Enfin, mais pas moins important je voudrais remercier mes parents Ricardo et Lucia, mon frère Dudu et ma sœur Mari par leur support même de loin pendant ma thèse et pendant mes 9 ans en France. Sans vous, rien aurait été possible. Je voudrais remercier Nati, qui était très important pour la fin de ma thèse. Tu m’as donné beaucoup des forces pour réussir mon manuscrit et ma soutenance de thèse.
Natural rubber latex is mainly composed by rubber particles whose core is made of cis-1,4-polyisoprene and the shell of non-isoprene compounds. It stability in the tree is provided by the negative charge of the shell due to the presence of proteins and lipids. Natural rubber latex coagulates after acidification to form a colloidal gel that is the first step of its transformation into natural rubber.
In this PhD thesis, we studied this acid-induced aggregation and gelation and the properties of the resulting gels. For this, a commercial natural rubber latex composed by rubber particles (1 µm in diameter), was used. Aggregation was induced by hydrolysis of a compound called glucono-delta-lactone (GDL). The aggregation was followed by different techniques based on light scattering (turbidimetry, DWS, SLS). Gelation was followed in situ by rheology. Then, the rheological properties of colloidal gels formed at pH 4 were characterized in the linear and non-linear regimes.
Dependence to the volume fraction and the pH of the onset of aggregation was observed. The non-redispersion of aggregates proves the strong interactions between rubber particles. Three different state behaviors (stable solution, phase separation and gel) can be predicted from a state diagram pH-volume fraction that was established over 5 weeks. The gel state exhibited a fractal structure, characterized by a power law relationship between the elastic modulus G’ and the volume fraction. At high deformations, an irreversible reorganization under stress resulted in an irreversible strain hardening of the material. We observed by rheo-ultrasound that above 50 % deformation, a homogenous destructuration occurred in the gel.
Le latex d’Hevea brasiliensis est composé principalement de particules de caoutchouc dont le noyau est constitué de cis-1,4-polyisoprène et la membrane de composés dit non-isoprène. Sa stabilité dans l'arbre est assurée par les charges négatives de la membrane en raison de la présence de protéines et de lipides. Le latex d’Hevea brasiliensis coagule après acidification pour former un gel colloïdal qui est la première étape de sa transformation en caoutchouc naturel.
Dans cette thèse, nous avons étudié l’agrégation et la gélification induite par ajout d’un acide et les propriétés des gels obtenus. Pour cela, un latex de caoutchouc naturel commercial constitué par des particules de caoutchouc (1 µm de diamètre), a été utilisé. L'agrégation a été induite par l'hydrolyse d'un composé appelé glucono-delta-lactone (GDL). Cette agrégation a été suivie par différentes techniques basées sur la diffusion de la lumière (turbidimétrie, DWS, SLS). La gélification a été suivie in situ par rhéologie. Ensuite, les propriétés rhéologiques de gels colloïdaux formés à pH 4 ont été caractérisées dans les régimes linéaires et non-linéaires.
La dépendance à la fraction volumique et le pH d'apparition de l'agrégation ont été observé. La non-redispersion des agrégats montre les interactions fortes entre les particules de caoutchouc. Trois état différents (solution stable, séparation de phase et gel) peuvent être prédits à partir d'un diagramme d’état fraction volumique-pH qui a été établi sur une durée de 5 semaines. L'état de gel présente une structure fractale, caractérisée par une relation de loi de puissance entre le module élastique G' et la fraction volumique. Pour des fortes déformations, une réorganisation irréversible sous contrainte a abouti à un durcissement irréversible du matériau. Nous avons observé par rheo-ultrasons qu'au-dessus de 50 % de déformation, une déstructuration homogène se produit dans le gel.
List of figures ... 13!
Introduction ... 19!
Chapter 1
!
State of the art ... 23
!
1.1
!Natural rubber latex and natural rubber ... 23
!1.1.1! Natural rubber latex (NRL) ... 25!
1.1.2! Rubber particles ... 26!
1.1.3! Natural rubber (NR) ... 28!
1.2
!Colloidal suspensions ... 29
!1.2.1! Interactions in colloidal suspensions ... 30!
1.2.2! Aggregation ... 33!
1.2.2.1!!Cluster aggregation ... 33!
1.2.2.2!!Effect of external forces on aggregation ... 35!
1.3
!Colloidal gels ... 35
!1.4
!Rheological properties of colloidal suspensions and gels ... 37
!1.4.1! Flow behavior of suspensions ... 38!
1.4.2! Viscoelastic behavior of colloidal gels ... 40!
1.4.2.1!!Scaling laws and fractality ... 43!
1.4.2.2!!Non-linear regime ... 45!
1.4.2.2.1!!Strain hardening behavior ... 45!
1.4.2.2.2!!Advances on techniques ... 47!
Chapter 2!
Materials & Methods ... 55!
2.1
!Natural rubber latex ... 55
!2.1.1!!!!!Sample preparation ... 55!
2.1.4! Dialysis of natural rubber latex ... 56!
2.2
!Characterization of natural rubber latex ... 56
!2.2.1! Density and volume fraction determination ... 56!
2.2.2! Size distribution ... 56!
2.2.3! Electrophoretic mobility ... 57!
2.3
!Acidification ... 59
!2.4
!Aggregation monitoring ... 61
!2.4.1! Static light scattering (SLS) ... 62!
2.4.2! Turbidity ... 62!
2.5
!Rheology experiments ... 63
!2.5.1! Introduction ... 63!
2.5.2! Theoretical background ... 63!
2.5.3! Equipments used ... 65!
2.5.4! Oscillatory measurements procedure ... 66!
2.5.4.1!!Time sweep measurements ... 67!
2.5.4.2!!Frequency sweep measurements ... 67!
2.5.4.3!!Stress sweep measurements ... 67!
2.5.5! Influence of the strain on the gelation ... 68!
2.5.6! Rheo-ultrasound ... 68!
2.6
!Viscosity determination ... 70
!2.7
!Confocal laser scanning microscopy ... 70
!Chapter 3
!
Acid-induced aggregation and gelation of natural rubber latex
particles ... 73
!
3.1
!Introduction ... 74
!3.2
!Materials & Methods ... 75
!3.2.1! Materials and Sample Preparation ... 75!
3.2.4! Acidification procedure ... 76!
3.2.5! Aggregation monitoring ... 77!
3.2.6! Diffusive wave spectroscopy (DWS) ... 77!
3.2.7! Static light scattering (SLS) ... 78!
3.2.8! Turbidity ... 78!
3.2.9! Rheological characterization ... 78!
3.3
!Results and Discussion ... 79
!3.3.1! Particle characterization ... 79!
3.3.1.1!!Particle density, electrophoretic mobility and size distribution ... 79!
3.3.1.2!!Particle surface membrane characterization ... 80!
3.3.2! State diagram of natural rubber latex ... 82!
3.3.3! Structure formation during continuous acidification ... 84!
3.3.3.1!!Onset of aggregation ... 84!
3.3.3.1.1!!Diffusing wave spectroscopy (DWS) ... 84!
3.3.3.1.2!!Static light scattering (SLS) ... 86!
3.3.3.1.3!!Turbidity measurements ... 87!
3.3.3.2!!Gelation ... 88!
3.3.4! Rheological properties of the gels at pH 4 ... 91!
3.4
!Conclusions ... 92
!Chapter 4!
Irreversible restructuration of natural rubber latex gels during
hardening under stress ... 97!
4.1
!Introduction ... 98
!4.2
!Material and Methods ... 99
!4.2.1! Samples ... 99!
4.2.2! Gelation procedure ... 100!
4.2.3! Rheological characterization ... 100!
4.2.4! Rheo-Ultrasound characterization ... 101
4.3.1! Gel characterization in the linear regime: scaling behavior ... 102!
4.3.2! Gel characterization in the non-linear regime: strain hardening behavior102! 4.3.3! Strain hardening in NRL gels is irreversible ... 108!
4.3.4! Gel hardening or degradation under strain is homogenously distributed in the sample 112!
4.4
!Conclusions ... 114
!Supplementary Material ... 119
Chapter 5!
Gelation under an oscillatory shear: influence of the
strain amplitude on the structural properties ... 121!
5.1
!Introduction ... 122
!5.2
!Material & Methods ... 123
!5.2.1! Samples ... 123!
5.2.2! Gelation procedure ... 123!
5.2.3! Rheological characterization ... 123!
5.3
!Results ... 124
!5.3.1! Regime I: absence of effects of the oscillating strain ... 124!
5.3.2! Regime II: hardening under shear ... 125!
5.3.3! Regime III: hardening and over-shoot ... 127!
5.3.4! Regime IV: heterogeneous gels ... 128!
5.4
!General discussion ... 129
!5.5
!Conclusions ... 131
!Chapter 6!
Discussion & Conclusions ... 135!
"#!
List of figures
!
Chapter 1 State of the art
Figure 1.1: Illustration of the processing to obtain concentrated latex and the main natural rubber
commercial forms. Pictures made by the rubber team of CIRAD. ... 25
Figure 1.2: Three different propositions of organization of the membrane on the rubber particles in
natural rubber latex proposed by (a) Blackley et al., (b) Nawamawat et al. and (c) adapted from Rochette et al. ... 27
Figure 1.3: Illustration of the models of small (left) and large particle (right) proposed by (Berthelot et al. 2014). In light blue: SRPP and in dark blue: REF. In orange: the lipids. ... 28 Figure 1.4: Illustration of the electric double layer around a colloidal particle charged negatively. .... 30 Figure 1.5: Illustration of the colloidal stabilizer electrostatic and steric. The repulsion increase when
particles approach to each other (left to the right) due to the ions and branch. ... 31
Figure 1.6: Illustration of energy of interaction in function of the distance r between particles. The
total energy (red curve) is the resultant of the attractive and repulsive forces (dashed curves). ... 32
Figure 1.7: Illustration of the colloidal destabilization due to the depletion. The attraction can occur
when particles approach to each other (left to the right) due to the expulsion of depletants between particles. ... 32
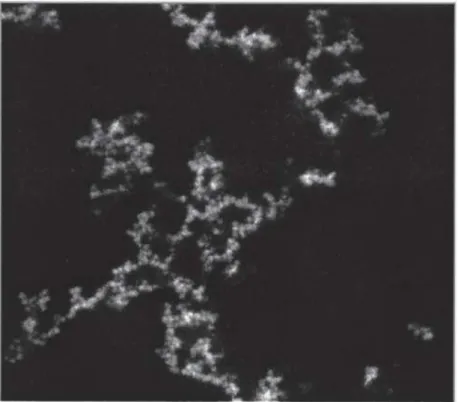
Figure 1.8: Illustration of aggregation of particles: from the stable suspension to a colloidal gel. ... 33 Figure 1.9: Images of structure of aggregates of latex particles formed on DLCA (left) and RLCA
(right) from Tang et al. (Tang et al. 2000). ... 34
Figure 1.10: State diagram energy of the system function of volume fraction (from Trappe and
Sandkühler (Trappe and Sandkühler 2004)). ... 36
Figure 1.11: Example of a confocal image for a colloidal gel of PMMA from Dinsmore et al.
(Dinsmore et al. 2001). ... 37
Figure 1.12: Relative viscosity function of volume fraction with the different models: black solid line:
Einstein model, blue dashed line: Krieger-Dougherty (Φmax =0.58 and [η] =2.5) and red dashed line:
MPQ model (Φrcp =0.64). ... 40
Figure 1.13: Input/output sinusoidal signals for different kinds of materials. ... 41 Figure 1.14: Example of frequency spectrum for different kinds of materials. ... 42 Figure 1.15: Illustration of evolution of G’ as a function of strain: in the linear and non-linear regimes
with corresponding output signals during the strain sweep. ... 43
"$!
Figure 1.17: Strain hardening behavior observed with polystyrene gels by (a) Gisler et al. (Gisler et al. 1999) and protein gels by (b) Pouzot et al. (Pouzot et al. 2006). ... 46
Chapter 2 Materials & Methods
!Figure 2.1: GDL hydrolysis into gluconic acid. ... 59 Figure 2.2: pH as function of time for different kinetics of acidification in buffer solution using
different amounts of GDL. Inset: final pH as function of amount of GDL. ... 59
Figure 2.3: pH as function of time for several kinetics of acidification in buffer solution using
between 0.25 and 2 %v/v of GDL for Φv =0.0025 (left) and Φv =0.1 (right). The amount of GDL used
increases from top to bottom in both curves. ... 60
Figure 2.4: pH as function of time during the acidification of natural rubber latex in a large range of
volume fraction. Inset: GDL amount as function of volume fraction for the dialyzed (blue) and non-dialyzed (red) samples. ... 61
Figure 2.5: Rheological measurement devices for different kinds of materials and viscosity levels.
From left to the right: Couette for very low viscosity, cone-plate for very low to high viscosity,
parallel plates for low viscosity to soft solid and rectangular torsion for solid. ... 64
Figure 2.6: Illustration of a Couette cup and mobile with their respective dimensions. ... 64 Figure 2.7: Illustration of a sanded (left) and serrated (right) Couette mobiles. ... 65 Figure 2.8: Illustration of G’ and G” in function of time (a), and then successively in function of
frequency (b) and in function of stress (c) for a natural rubber latex gels Φv =0.1. ... 66
Figure 2.9: Illustration of Rheo-ultrasound equipment. ... 69 Figure 2.10: Illustration of flow curves, viscosity =f (shear rate), with three different regimes. ... 70
Chapter 3 Acid-induced aggregation and gelation of natural
rubber particles
Figure 3.1: (a) Volume particle size distribution of the dialyzed NRL suspension. (b) The
electrophoretic mobility of the dialyzed NRL particles as a function of the pH (ionic strength =7m). 80
Figure 3.2: Electrophoretic mobility at pH 8.5 as a function of the ionic strength. The black dashed
curve and continuous red curves represent fits using Oshima and Duval formalism, see text for more
details. 81
Figure 3.3: State diagram of natural rubber latex in pH- Φv space: (a) after 4 hours, (b) after 1 week,
(c) after 2 weeks and (d) after 5 weeks. Square: GDL acidification and diamonds: buffer acidification. Stable suspension: empty symbols, macroscopic phase separation: half-filled symbols and gel: filled symbols. Dashed and dotted lines which represent the limits between two states are only guides for the
"%!
Figure 3.4: Aggregation kinetics of NRL particles upon acidification (Φv =1.1x10⁻²), as measured by
DWS. (a) Particle size as a function of the acidification time for different amounts of added GDL concentrations: 0.5 wt% (yellow), 1 wt% (green) and 2 wt%.(purple). Repeat experiments are presented for each GDL concentration with different symbols. Inset in (a) show measured correlations functions (symbols) and theoretical fits (solid lines) after 1 minute (square) or 18 minutes (circles) of acidification by addition of 1 wt% GDL. (b) Same particle size evolution, but plotted this time as a
function of pH. 85
Figure 3.5: (a) Particle size distribution measured by static light scattering for an NRL suspension (Φv
=2.2x10⁻²) upon acidification with 1 % GDL.(b) Normalized size evolution with pH for NRL dispersions with Φv ranging from 0.01 to 0.15. 86
Figure 3.6: pH at the onset of aggregation as measured during acidification, plotted as a function of
particle volume fraction. Measure obtained in situ by turbidity (cross) and DWS (circles) and after quenching by SLS (triangles). The solid line is a guide for the eyes, the state diagram presented in Figure 3.3a is reproduced in grey for comparison. 87
Figure 3.7: (a) Evolution of the elastic (G’, full symbols), and viscous modulus (G”, open symbols)
during acidification, for (from top to bottom) Φv = 4.3x10
-1
, 2x10⁻¹, 1.1x10⁻¹, 5x10⁻² and 2.5x10⁻². (b) Evolution of the experimental gelation time (tgel-exp) as a function of volume fraction: Red: standard
kinetics. Yellow: 0.4 % GDL, Purples: 2 % GDL. Dashed line: theoretical gelation time (tgel) (Allain et al. 1995) for DLCA where the particle radius, a =0.5 µm, the viscosity, η =1x10⁻³ Pa.s and Df =1.8. 89
Figure 3.8: pH at gelation as determined by rheology. Red squares: standard kinetics. Yellow: 0.4 %
GDL, Purples: 2 % GDL. The red curve is a guide for the eyes. The state diagram presented in Figure 3.3a and completed in Figure 3.6 is reproduced in grey for comparison. 91
Figure 3.9: (a) Frequency sweep: elastic (G’, full symbols) and viscous (G”, open symbols) moduli
dependence on the angular frequency for (from top to bottom) Φv = 4.3x10
-1
, 2.0x10⁻¹, 1.1x10⁻¹, 5x10⁻² and 2.5x10⁻². (b) Plateau value of the elastic modulus (G’0) as a function of NRL volume fraction.
Squares = standard acidification procedures with a final pH 4 (Blue: dialyzed NRL suspensions, red: non-dialyzed NRL suspensions). Circles: final pH 3. Diamonds: final pH 4.5. Triangles: final pH 5.5.
92
Chapter 4 Irreversible restructuration of natural rubber latex
gels during hardening under stress
Figure 4.1: (a) Elastic modulus G’ as a function of applied stress and in (b) as a function of strain
using a serrated Couette. In (c) σf (filled); σ0 (empty) and in (d) γf (filled); γ0 (empty) as function of
volume fraction estimated from (a) and (b) respectively. In (a) and (b) the volume fraction increases from bottom to the top: blue Φv =0.01, green Φv =0.025, light green Φv =0.05, yellow Φv =0.1, red Φv
=0.15, burgundy Φv =0.2 and purple Φv =0.4. In (c) and (d) the symbols represent the different Couette
geometries: smooth Couette in blues square, serrated Couette in green triangles and PMMA Couette in red (γ0 and σ0 cannot be determined in this geometry due to the use of a step to step procedure). The
grey vertical dashed line represents the limit of fractality. ... 103
Figure 4.2: G’max (filled symbols) and G’0 (open symbols) as function of volume fraction. Scaling
laws behavior of G’max ~Φv
1.67
and G’0 ~Φv
3.35
are represented by the dark dashed line and grey dashed line respectively. The symbols and colors represent the different Couette geometries: smooth Couette (blues square), serrated Couette (green triangles) and PMMA Couette (red circles). For dense natural rubber films, G’ estimated from DMA measurements (orange start) and G’0 using a plate-plate
geometry (purple plus) are plotted. Vertical grey dashed curve represent the limit of fractality (Φv ~
"&!
Figure 4.3: Relative G'(γ)/G'0 (filled symbols) and tan δ(γ)/ tan δ0 (empty symbols) as function of
strain for different volume fraction using a serrated Couette. Three different behaviors: weakly gels for
Φv =0.025 (green squares), constant tan δ (γ)/ tan δ0 for Φv =0.1 (yellow circles) and no strain
hardening for Φv =0.4 (purple diamonds). ... 106
Figure 4.4: Normalized elastic modulus G’(y)/G’0 as a function of strain using a serrated Couette. Fits
from Gisler et al. model using the polynomials proposed by Pouzot et al. are represented by the dark dashed line using Db =1.13 and grey solid line using Db =1.3. The volume fractions decrease from the
top to the bottom: green Φv =0.025, light green Φv =0.05, yellow Φv =0.1, burgundy Φv =0.2, dark blue Φv =0.3 and purple Φv =0.4. ... 107
Figure 4.5: G’ as a function of strain during the successive increase and decrease of strain for Φv =0.1
using a serrated Couette. (a) Increase of strain till γmax =20 %, (b) then decrease from γmax =20 % to γ
=0.01 %, (c) increase of strain from γ=0.01 % to γmax =50 % (d) then decrease from γmax =50 % to γ
=0.01 % and (e) successive increase/decrease with several plateaus of G’ until fracture at γf > 100 %.
... 109
Figure 4.6: G’(y)/G’0-γmax as a function of strain during the increases/decreases for different step using
a serrated Couette. The colors represent the maximum strain attempted applied at each step: Purple: γmax =0.25, blue: γmax=0.5, green: γmax=0.9, red: γmax=1.2 and black: γmax= 1.65. The curves are fitted
using from left to the right: Db =1.13 (purple line), 1.2 (blue line), 1.4 (green line), 1.6 (red line) and
1.8 (black line) using Gisler et al. model (Gisler et al. 1999). Inset: evolution of the backbone fractal dimension Db function of strain. The symbols represent the three different volume fractions used: Φv
=0.035 (diamonds), Φv =0.05 (circles) and Φv =0.1 (triangles). ... 110
Figure 4.7: Standard strain hardening (up to fracture) obtained from the stress sweep is represented in
black circles for Φv =0.1 using a serrated Couette. In colors the continuous strain applied at different
strain values during the strain hardening: the constant G’ for γ=0.05 in purple diamonds, γ =0.2 in blues triangles, γ =0.4 in green squares and the fracture of the gel for γ =0.6 in red circles. ... 111
Figure 4.8: Rheo-ultrasound measurements of the natural rubber latex gels for Φv =0.025. Figure 8a,
8b and 8c: displacements obtained from USV speckles gel with stator r =0 and rotor r =2. Colors represent the displacement (blue and red represent the different direction of displacements). Figures 8d, 8e and 8f: velocity obtained from the rheometer (black signal) and from USV (colors signals) inside the gel. Figure 8g, 8h and 8i: harmonics obtained after FFT of the velocity from USV (colors) and from input signal from rheometer (grey cases). Left (a, d, g): 0.1 of strain, center (b, e, h): 0.4 of strain and right (c, f, i): 0.8 of strain. ... 113
Figure 4.9: Linear velocity profiles, v (mm/s), as function of the gap between the stator (r =0 mm) and
the rotor (r =2 mm) obtained from USV data for Φv = 0.025. Strain increase from the bottom to the
top: γ =0.1 (dark blue), γ =0.2 (blue), γ =0.3 (light blue), γ =0.4 (green), γ =0.6 (yellow), γ =0.7 (orange) and γ =0.8 (red). ... 114
Figure 4.10: Relative viscosity of NRL suspension as a function of volume fraction. Measurements
are obtained with an MCR702 rheometer (diamonds) and a capillary viscometer (triangles). Dashed line (---): Krieger-Dougherty equation with two fitting parameters, Φmax =0.72 and [η] =2.86. Bleu
dashed points (…): MPQ model with Φrcp =0.715 determined independently by static light scattering.
... 120
Figure 4.11: 1/(ηr) 0.5
function of Φv/Φrcp. Measurements are obtained with an MCR702 rheometer
(diamonds) and a capillary viscometer (triangles). The MPQ model for hard sphere is represented by the red dashed line. ... 120
"'!
Chapter 5
! !Gelation under an oscillatory shear: influence of the
strain amplitude on the structural properties
Figure 5.1: (a) G’ as a function of time during gelation for different initial strain and (b) G’ as a
function of strain in the subsequent strain sweep for Φv =0.025 in regime I. ... 125
Figure 5.2: (a) G’ as a function of time during gelation for different initial strain and (b) G’ as a
function of strain in the subsequent strain sweep for Φv =0.025 in regime II. ... 126
Figure 5.3: G’0 obtained for different initial strain during the gelation superposed to the strain sweep
obtained under reference conditions for different volume fractions in the regime II: (a) Φv =0.025, (b) Φv =0.05 and (c) Φv =0.1. The colors represent the different strain applied during the gelation: 0.5 %
in purple (reference), 10 % in blue, 20 % in green and 40 % in yellow. ... 126
Figure 5.4: (a) G’ as a function of time during gelation under different strain values in the regime III
(red and orange) and to the reference (purple) and (b) G’ as a function of strain for gel formed in (a) for Φv =0.025. ... 127
Figure 5.5: G’0 (empty circles) and G’max (filled circles) obtained during the gelation under strain, in
the regime III, for three different volume fraction superposed to the strain hardening curve at reference conditions. The volume fractions are (a) Φv =0.025, (b) Φv =0.05 and (c) Φv =0.1. The colors represent
the different strain: 0.5 % in purple (reference), 50 % in brown, 60 % in orange and 80 % in red. .... 128
Figure 5.6: (a) G’ (filled symbols) and G” (empty symbols) as a function of time during gelation for
different initial strain, (b) G’ as a function of strain in the subsequent strain sweep for Φv =0.025 and
(c) G’0 (empty circles) and G’max (filled circles) obtained during the gelation under strain for two
different volume fraction superposed to the strain hardening curve at reference conditions in the regime IV for Φv =0.025. The colors represent the different strain: 0.5 % in purple (reference), 100 %
in bronze and 120 % in dark. ... 129
Figure 5.7: Pictures taken after 4 hours of gelation Φv =0.05. Left: homogenous gel in the regime I to
III (< 90 % of strain) and right: heterogeneous gel in the regime IV (> 90 % of strain). ... 130
Figure 5.8: G’0 (empty circles) and G’max (filled circles) obtained during gelation under different
strain (colors) values plotted on the strain hardening curve obtained at reference conditions (purple diamonds) for (a) Φv =0.025, (b) Φv =0.05, (c) Φv =0.1 and (d) Φv =0.35. In regime I: 0.5 % in purple,
and 2 % in dark blue. In regime II: 10 % in blue, 20 % in green and 40 % in yellow. Regime III: 60 % in orange and 80 % in red. In regime IV: 100 % in bronze, 120 % in dark and 150 % in grey. ... 131
Chapter 6 Discussion & Conclusions
Figure 6.1: State diagram of natural rubber latex in pH- Φv space. Red square: pH at gelation obtained
by rheology. Black line: onset of aggregation observed after 4 hours. Dashed and dotted blues lines represent the limits of the macroscopic phase separation between 1 and 5 weeks.!(((((((((((((((((((((((((((((!"#&!
Figure 6.2: Evolution of the experimental gelation time (tgel) as a function of volume fraction. Red
squares: obtained by rheology, green circles: obtained by Turbiscan and blues diamonds: obtained by Rheolaser® Master.!((((((((((((((((((((((((((((((((((((((((((((((((((((((((((((((((((((((((((((((((((((((((((((((((((((((((((((((((((((((((((((((!"#'!
Figure 6.3: G’0 a as a function of Φv obtained from our data (red squares) and some data estimated
from literature: purples circles (Gisler et al. 1999), light blue circles (Romer et al. 2014), dark blue circles (de Rooij et al. 1994), yellow diamond (Pouzot et al. 2006), green and light green triangles (Yanez et al. 1996) and orange triangles (Yanez et al. 1999).!((((((((((((((((((((((((((((((((((((((((((((((((((((((((((((!"#)!
")!
Figure 6.4: Schema of the structure of the NRL gel in the strain-Φv space. The limit of fractality
(dark dashed line) was observed at Φv =0.25, the onset of strain hardening (blue dashed line) at γ ~ 10
%, the critical strain (orange dashed line) at γ ~ 50 % and the fractures (red dashed lines) at γ ~ 100 % for the fractal gels and at γ < 10 % for the non fractal gels.!((((((((((((((((((((((((((((((((((((((((((((((((((((((((((((((((!"$*!
Figure 6.5: G’max (filled symbols) and G’0 (open symbols) as function of volume fraction for a fresh
ammoniac natural rubber latex from Thailand (blues diamonds). The modulis obtained for the commercial natural rubber latex, illustrated in Figure 4.2 (chapter 4), are reproduced by the dark symbols for purposes of comparison. The grey dashed line represents the limit of fractality.!((((((((((((!"$#!
Figure 6.6: Confocal microscopy images of natural rubber latex tagged with the Nile Red at Φv= 0.05.
In (a) and (b) images of particles taken before gelation and in (c) and (d) images of aggregates taken after the addition of 1 % of GDL. The square scales are 246x246 µm in (a) and (c) and 34x34 µm in (b) and (d).!((((((((((((((((((((((((((((((((((((((((((((((((((((((((((((((((((((((((((((((((((((((((((((((((((((((((((((((((((((((((((((((((((((((((((!"$$!
Figure 6.7: Confocal microscopy images for a gel at Φv =0.05 acidified with 1 % of GDL. Images of
natural rubber gel (a) and a collapsed gel obtained after compression using a finger (b). The square scale is 246.03x246.03 µm.!(((((((((((((((((((((((((((((((((((((((((((((((((((((((((((((((((((((((((((((((((((((((((((((((((((((((((((((((((!"$%!
"+!
Introduction
Natural rubber latex is extracted from Hevea brasiliensis tree, and is mainly produced in Southeast Asia, which represents 95 % of the global production (Vaysse et al. 2012; Ngo Kinh 2013). Natural rubber is an important social-economic issue in the producing countries. For example, in Thailand more than 7 million peoples depend on this culture, which represents around 10 % of the population, plantations being essentially family farms. In the recent years, the number of Hevea plantations increased, which generated an environmental risk due to the replacement of other plantations and virgin forests.
Items made from natural rubber and natural rubber latex have been used since decades. They are present in different products such as, for instance, tires, gloves and condoms. Tires are the most important market, and represent about 70 % of the natural rubber market. In recent decades, natural rubber accounts for over 41 % of global elastomer consumption despite the development of synthetic counterparts (Vaysse et al. 2012). These synthetics elastomers, obtained from petrochemical industry, cannot replace natural rubber in many applications, as in aircraft tires which still must be composed predominantly of natural rubber. Indeed, natural rubber exhibit unique properties such as high elasticity, high resistance to deformation and fracture, low heat build-up and slower crack propagation. These exceptional properties are attributed to the existence of a complex associative structure, not yet precisely determined, formed between the polyisoprene chains and the others natural compound (Tanaka 2001; Vaysse et al. 2009). These compounds, called non-isoprene, are mainly proteins, lipids, sugars and minerals (Wititsuwannakul 2001).
Natural rubber latex is composed by rubber particles and non-isoprene compounds suspended in an aqueous phase. These rubber particles are composed by a core of cis-1.4-polyisoprene and a mixed monolayer membrane composed mostly by proteins and lipids (Blackley 1996; Cornish et al. 1999; Nawamawat et al. 2011; Berthelot et al. 2014). Negatively charged at a native pH 7 in the tree, the rubber particles will aggregates when the pH of the suspension decreases. Depending on the grade of natural rubber, this could be caused by the action of bacteria, in “natural coagulation”, or by addition of a weak acid, in “acid coagulation”. The coagulation is anyway the first step of transformation of the latex into natural rubber, a dense
cis-1.4-polyisoprene network, obtained after several mechanical transformations and drying
of the coagulated latex.
Although natural rubber latex is used to make different products for over a century, dynamics of its structuration over the various processing steps involved in its transformation in rubber are still unclear. This structuration, from the tree until final products, occurring at different scales (micro, meso and macro) and will affect the properties of the final material. Since many decades, biochemical approaches were used to follow the transformation of the different compounds of the latex and their impact on the final properties of the natural rubber. However, the structure of the colloidal gel (resulting from the coagulation) and its impact on the natural rubber properties was never studied before.
,*! In the last decade, there have been several advances in the study of turbid suspensions and the formation of gels, especially in the field of soft matter physics, resulting in a better description of their rheological response and links to their structure. In this PhD work, we used such approach from the physics of colloidal systems to investigate the formation of natural rubber latex gels and their viscoelastic properties. Our aim was to identify and characterize the structuration of the network of rubber particles during an acid-induced gelation of a commercial natural rubber latex. We used mostly light scattering and rheology to characterize aggregation, gelation and the final viscoelastic properties of the network formed by particles percolation. With an initial average size of rubber particles centered at 1 µm, the system is colloidal, but the aggregation rapidly result in the formation of clusters which larger dimension suggest a granular-like behavior.
This manuscript is divided in 6 chapters:
Chapter 1 – this chapter presents a state of the art divided into three main parts. First, a
presentation of the raw material used for this study, with a focus on the origin, composition and properties of natural rubber and natural rubber latex. Second, an introduction about the behavior of colloidal systems studied in terms of interactions, aggregation and gelation. Third, we develop a focus about rheological measurements of the viscoelastic behavior.
Chapter 2 – this chapter presents the materials and methods used during this work, with a
focus on the light scattering and rheological methods. The materials and methods used in chapter 3, 4 and 5 are completed in their own section.
Chapter 3 – in this chapter, we study the early stages of the aggregation and then the gelation of natural rubber latex. For this, we used a combination of light scattering
techniques to determine the onset of aggregation in a large range of volume fraction (1.0x10⁻⁴ to 2.0x10⁻¹). A state diagram pH-volume fraction has then established and its time-dependence characterized. In this state diagram, three different states were observed: i)
stable suspension, ii) a macroscopic phase separation between a suspension and iii) a gel.
The viscoelastic properties of the gels formed at pH 4 demonstrated a typical fractal colloidal
gel behavior.
Chapter 4 – in this chapter, we focus on the rheological characterization of the gels. The viscoelastic properties were characterized in the linear and non-linear regimes. In the
latter, we evidenced an original irreversible strain hardening that we attributed to an
internal reorganization inside the gel. Moreover, a critical oscillatory strain was
determined: if submitted to higher strains, the network is progressively degrade as evidence by a continuous elastic modulus decrease, and eventually brake.
Chapter 5 – in this chapter, we evaluated the effect of an oscillatory strain imposed during the gelation on the final structure of the gel. Four different regimes were observed depending on the strain amplitude. In regime I, corresponding to the lower strains values,
the viscoelastic properties were unchanged. In regime II, for strain values superior to 10 %
,"! described in chapter 4 for similar strain values. For oscillatory strain higher than the critical
strain of 50 % identified in chapter 4, a different behavior was observed: when gelation is
conducted under an oscillatory strain, materials first harden and then progressively
degrade. In this regime, material lost their strain hardening behavior. Finally, in regime IV,
macroscopically heterogeneous gels were formed.
Chapter 6 – In this last chapter, a general discussion of the results and a comparison with
those reported in the literature with other types of colloidal gels was done. Moreover, the
,,!
References
Berthelot, K., et al. (2014). "Hevea brasiliensis REF (Hev b 1) and SRPP (Hev b 3): An overview on rubber particle proteins." Biochimie 106(0): 1-9.
Blackley, D. C. (1996). Polymer Latices: Science and Technology. London, Chapman & Hall. Cornish, K., et al. (1999). "Rubber particles from four different species, examined by transmission electron microscopy and electron-paramagnetic-resonance spin labeling, are found to consist of a homogeneous rubber core enclosed by a contiguous, monolayer biomembrane." Planta 210(1): 85-96.
Nawamawat, K., et al. (2011). "Surface nanostructure of Hevea brasiliensis natural rubber latex particles." Colloids and Surfaces A: Physicochemical and Engineering Aspects
390(1–3): 157-166.
Ngo Kinh, L. (2013). Natural rubber industry report 2013, Fpt Securities: Vietnam.
Tanaka, Y. (2001). "Structural characterization of natural polyisoprenes: Solve the mystery of natural rubber based on structural study." Rubber Chemistry and Technology 74(3): 355-375.
Vaysse, L., et al. (2012). Natural rubber in Polymer Science: A Comprehensive Reference. Amsterdam, Elsevier BV 10: 281-291.
Vaysse, L., et al. (2009). Natural Rubber in Sustainable Solutions for Modern Economies,Coord. Dr Rainer Höfer, The Royal Society of Chemistry. Cambridge, UK: 339-367.
Wititsuwannakul, D. and Wititsuwannakul, R. (2001). Biochemistry of Natural Rubber and Structure of Latex. Weiheim, Germany 2: 151-202.
,#! !
Chapter 1
State of the art
1.1 Natural rubber latex and natural rubber
Originally from Amazonian forest but mainly produced in Southeast Asia (94 % of world production), natural rubber latex (NRL) and natural rubber (NR) are widely used in many everyday products around the world. It represents more than 41 % of the elastomer market. Gloves, condoms, anti-vibration parts, vehicle (car, bus, truck) tires are made, at least partly, from natural rubber latex or natural rubber. The tires industry remains the major consumer of NR and represent more than 75 % of the total consumption (Vaysse et al. 2012). The consumption of NR increased in last year’s with a demand of 12.15 million tons in 2014. It is expected to reach 16.5 million tons in 2023 according the International Rubber Study Group (IRSGReport 2015).
Despite the fact that the natural rubber latex can be obtained from other plant sources, such as
Taraxacum brevicorniculatum (Dandelion), Parthenium argentatum (Guayule), Euphorbia lactiflua and Ficus elastica, it is mainly extracted from the Hevea brasiliensis tree
(Mooibroek and Cornish 2000). When the tree bark is tapped, it defends itself by flowing a white liquid named latex. The natural rubber is obtained after several transformation of the natural rubber latex as shown in Figure 1.1. NRL can be collected in liquid or solid states. The solid state (Intapun et al. 2010) is obtained either by controlled coagulation (acid-induced coagulation) or by natural coagulation (the latex coagulate naturally in the cup) (Figure 1.1). The controlled coagulation is made by addition of a weak acid such as acetic acid or formic acid (Blackley 1996). Instead, the natural coagulation results from the action of microorganism. A colloidal gel is then obtained from the latex by the percolation of the particle-particle aggregates.
,$! To avoid the natural aggregation of the NRL and collect it in its liquid state, an ammonia (NH3) solution is added to rise the pH of the suspensions. This liquid latex can be
concentrated, after addition of a supplemental dose of ammonia, to prepare the different types of systems used in gloves industry. The latex can be concentrated by different techniques: evaporation, creaming, electrodecantation or centrifugation (Blackley 1996). However, the centrifugation is the most widely used. The latex is stabilized by addition of ammonia and concentrated to around 60 %wt. The concentrated latex can be classified, depending on the amount of ammonia added, in high ammonia latex or low ammonia latex with NH3 > 0.6 %
and < 0.3 %, respectively.
Once the latex is coagulated, the NRL colloidal gel is subjected to a succession of mechanical stresses to prepare the dry forms of commercial dry NR (Figure 1.1). Dry NR sheets are obtained after drying sheets with hot air or smoke (Figure 1.1). Other types of commercial dry natural rubbers, especially the technically specified rubber (TSR) or crumb rubber, are obtained mostly from natural coagulation. The coagula are pressed to remove water and processed through various equipments. The TSR and the NR sheets (mainly Ribbed Smoked Sheet (RSS)) are the most important products with around 70 % and 20 % of the world production, respectively. These solid products represent about 90 % of the market while the concentrated latex represents the remaining. The latex composition, the processing and other factors (season, Hevea brasiliensis genotypes, etc.) influence the final properties of the natural rubber. A dynamic structuration occurs during the processing and the storage of the natural rubber. Indeed, the amount of non-isoprene compounds decreases during the processing but remains a key parameter in the structuring of raw NR.
,%!
Figure 1.1: Illustration of the processing to obtain concentrated latex and the main natural rubber
commercial forms. Pictures made by the rubber team of CIRAD.
1.1.1 Natural rubber latex (NRL)
The NRL is a complex suspension composed by 30-45 %wt of cis-1,4-polyisoprene particles and by 5-6 %wt of non-isoprene compounds, both suspended in an aqueous phase, called serum phase (Jacob et al. 1993; Wititsuwannakul 2001). Other intrinsic particles formed by non-isoprene compounds such as lutoids and Frey Wyssling particles and extrinsic particles like bacteria or yeast, are also present in suspensions (Southorn 1960). The non-isoprene compounds present in the latex are proteins, lipids, carbohydrates, minerals, and others. The average composition of the natural latex and dry natural rubber are shown in Table 1.1. Some non-isoprene compounds are removed during processing but some are still present in the dry rubber. The composition varies according to several natural parameters such as season, age of the tree, the genotype (clones), etc.
,&! Different clones of Hevea brasiliensis obtained from several breeding programs using controlled pollination exist. The composition and final properties of raw NR change depending on the type of clone (Wisunthorn et al. 2012). However, end-use products made from NR are obtained from raw NR from a mix of different clones.
The stability of latex is provided by the repulsion of negatives charged surrounding the particles (Ho et al. 1996; Sansatsadeekul et al. 2011). This repulsion avoids the adhesion between the particles. The native pH of field latex is around 7 with a density between 0.9 and 0.98 (Blackley 1996). If the isoelectric pH (pHi) is reached, the repulsion forces between
particles decrease. The pHi of the NRL particles is estimated to be between 4 and 4.7 (Ho et
al. 1996). However, if a chemical treatment is performed in the NRL, the pHi decreases due to
the changes in membrane composition (Ho 1989). Furthermore, the pHi decreases with the
storage of the NRL (Ho 1989).
The coagulation (destabilization) can occur for many reasons, the main one being a decrease of the pH of the latex promoting particle-particle aggregation. Other mechanisms were proposed to explain latex coagulation: i) the neutralization of anions on the particle membrane (liberated by hydrolysis of some lipid compounds) and the divalent cations Mg2+ or Ca2+ (present in the latex) or ii) formation of links between particles due to the action of hevein protein present in the latex (Gidrol et al. 1994).
Table 1.1 - NRL and NR average composition
NRL (%w/w)a Dry NRL (%w/w)b NR (%w/w)c
cis-1.4 polyisoprene ~30-45 ~87 94
Lipids ~1.5 ~3.2 ~3.4
Proteins ~1.5 ~3.7 ~2.2
Others < 2 ~4 < 1 a: (Wititsuwannakul 2001) b: calculated from a and c: (Sainte Beuve J. 2006)
1.1.2 Rubber particles
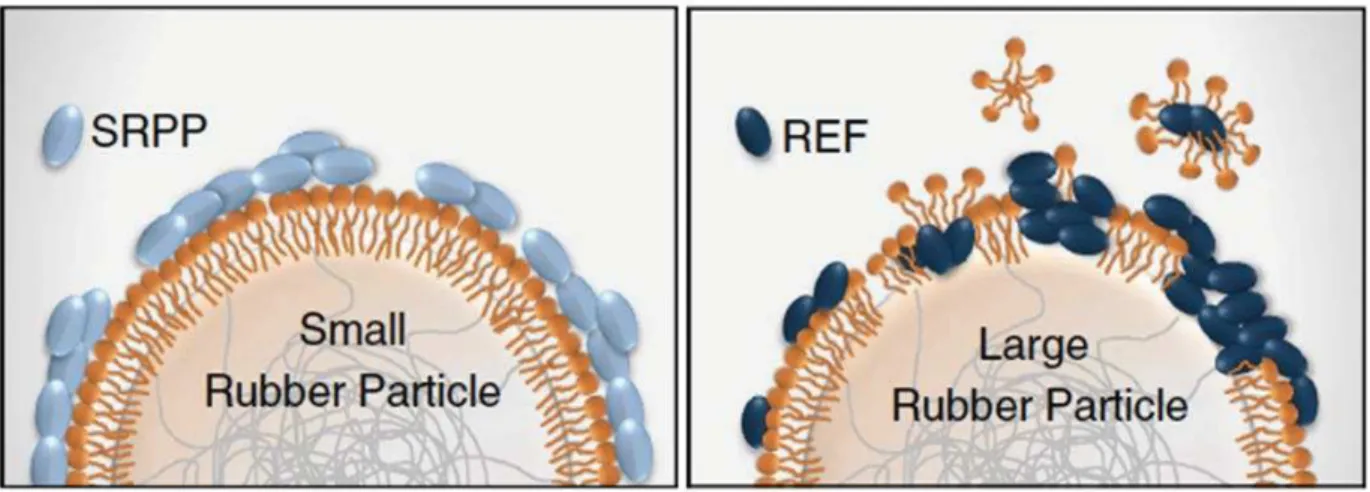
Rubber particles are of core-shell type with a core of polyisoprene and a complex membrane composed of lipids and proteins charged negatively at native pH (Ho et al. 1996). Particles display high polydispersity with diameters comprised between 0.2 and 1 µm (Wood and Cornish 2000). The thickness of the membrane was estimated between 1 – 20 nm according to the different authors (Nawamawat et al. 2011; Gaboriaud et al. 2012; Rochette et al. 2013). Around 20-30 % of proteins and most of the lipids present in the latex are localized in this complex membrane. Recently, the presence of 186 different proteins on the rubber particles was demonstrated (Dai et al. 2013). Moreover, the presence of two principal proteins present on the membrane, the small rubber particles proteins (SRPP) and the rubber elongation factor (REF) was reported. Both proteins are described as co-factors of the biosynthesis of the natural rubber latex (Berthelot et al. 2014). The lipids in the latex are neutral lipids (around 50
,'! %), glycolipids (around 25 %), and phospholipids (around 25 %) (Hasma and Subramaniam 1986; Liengprayoon et al. 2011). Today, the nature and the organization of the lipids and proteins on the membrane are still on debate. Some authors proposed a membrane organized in mixed monolayers and others in a double layer (Cornish et al. 1999; Wood and Cornish 2000; Nawamawat et al. 2011; Gaboriaud et al. 2012; Rochette et al. 2013). Blackley et al. (Blackley 1996) proposed a double layer membrane with a lipid layer around the core of rubber particle and an external layer of proteins (Figure 1.2a). This external proteins layer was also proposed for particles from the Parthenium argentatum latex (Cornish et al. 1999). Later, with the evolution of the measurement techniques, new models were proposed. Nawamawat
et al. (Nawamawat et al. 2011), using atomic force microscopy and confocal microscopy,
proposed a rubber particle surrounded by a mixed layer of lipids and proteins under the form of patches (Figure 1.2b). Rochette et al. (Rochette, Crassous et al. 2013) proposed a stratified layer of proteins and lipids around the rubber particles using electrokinetic measurements and transmission electron microscopy (Figure 1.2c).
Figure 1.2: Three different propositions of organization of the membrane on the rubber particles in
natural rubber latex proposed by (a) Blackley et al., (b) Nawamawat et al. and (c) adapted from Rochette et al.
,)! Recently, the presence of two main proteins, namely small rubber particles proteins (SRPP) and rubber elongation factor (REF), on these complex membrane was proposed using different biophysical techniques (Berthelot et al. 2014). Moreover, Hillebrand et al. (Hillebrand et al. 2012) proposed that SRPP would play a role in stability of rubber particles towards aggregation for the Taraxacum brevicorniculatum (Dandelion) latex. Concerning
Hevea brasiliensis latex, it was demonstrated a dependence of the nature and organization of
the membrane with the size of the rubber particles (Berthelot et al. 2014). Firstly, the SRPP is usually present in the small rubber particles membrane and the REF in the largest rubber particles as shown in Figure 1.3. Secondly, they proposed a double layer membrane with the SRPP adsorbed on a monolayer of lipids while the REF would be inserted in the monolayer of lipids.
Figure 1.3: Illustration of the models of small (left) and large particle (right) proposed by (Berthelot et al. 2014). In light blue: SRPP and in dark blue: REF. In orange: the lipids.
In addition, chemical modifications in the latex can change the nature of the membrane. Liberation of fatty acids when the ammonia is added to the natural rubber latex was demonstrated (Blackley 1996). Then, changes in the electrokinetic properties of natural rubber latex with chemical modifications were demonstrated (Ho, Kondo et al. 1996). In this study, they proposed that for ammonia natural rubber latex, after chemical modifications the membrane contains 86 % of free fatty acids and 14 % of proteins.
1.1.3 Natural rubber (NR)
The natural rubber is still irreplaceable in many areas due to its unique properties such as high elasticity, strain-induced crystallization, low heat build-up at high temperature, high tack and high green strength (Vaysse et al. 2009). These unique properties would be related to the specific associative structure of NR due to links between the polyisoprene chains and certain non-isoprene compounds (Vaysse et al. 2009). The presence of the bonds formed between the polyisoprene chains and these non-isoprene compounds is demonstrated by the formation of an insoluble macroscopic gel or “macrogel”, chemical and physical, when the NR is dissolved in a good solvent for polyisoprene (Tarachiwin et al. 2005; Kim et al. 2008; Tanaka and
,+! Tarachiwin 2009; Wisunthorn et al. 2012). The presence of this macroscopic gel is correlated with the physical properties of natural rubber (Bonfils et al. 2005; Ehabé et al. 2005).
In order to obtain end-use products, like tires, the NR is cured, or vulcanized, by addition of vulcanizing agent such as sulfur and other additives. Thereafter, the formation of sulfur links between the polyisoprene chains takes place and increases the mechanical properties. However, vulcanization can be done directly with the concentrated latex in liquid state (Blackley 1996). This treatment, namely pre-vulcanization, would generate sulfur-polyisoprene links inside the rubber particles. In this treatment, the latex is heated with a sulfur dispersion, one or more vulcanization accelerators and in most cases zinc oxide. The advantage is that the pre-vulcanization is carried out at lower temperatures than those for vulcanization of raw dry NR.
1.2 Colloidal suspensions
A colloidal system is a mixture consisting of at least one dispersed phase into a suspending medium, the dispersed phase being characterized by a size ranging from a few nm to a few µm. Depending on the nature of both phases, the colloids can be separated into different groups. If the dispersed phase is liquid, it is called an emulsion, and if the dispersed phase is solid it is called a suspension.
In general, colloidal systems are not monodisperse but polydisperse and exhibit a range of sizes that can be approximated by for instance a Gaussian distribution. Depending on the nature or physicochemical conditions, the shapes of colloidal particles can be spherical, ellipsoidal, rod-like, disc-like, etc. Latex and emulsions contains spherical particles while some proteins and viruses present a non-spherical shape. To measure particles size, optical techniques can be used despite the resolution limit. The electron or confocal microscopy techniques can be used to observe directly the particles (Shaw 1992). The static and dynamic light (SLS, DLS), X-ray (SAXS) or neutron scattering techniques (SANS) are also used to estimate the particle size and shape from the scattered intensity at small angles (Hamley 2013).
Colloidal particles diffuse in a liquid via Brownian motion throughout all the space. For particles larger than 100-500 nm, the gravitational force can become significant and can cause sedimentation or creaming depending on the density difference between phases. In addition, for the complete characterization of a colloidal suspension, interactions with other particles should also be considered as it can result in their aggregation.
#*!
1.2.1 Interactions in colloidal suspensions
The stability of colloids is very important in the conception of many products used every day such as foods, paints, cosmetic or pharmaceutical products. For example, the stability of beer is important to avoid changes in the sensory characteristics like flavor, foam consistency or color. The different interactions between dispersed (particles) and dispersion (medium) phases are one of the critical points determining the behavior and stability of colloids. These interactions that control the properties of the colloid depend on the number of particles and their distance. The physical and chemical properties will impact those interactions. For colloidal dispersion, several interactions exist such as the repulsion between the double layers, attractive Van der Waals interactions.
For charged particles, the electric double layer is a high ionic density zone formed around each colloidal particle immersed in a liquid, and is illustrated in Figure 1.4. An electric double layer is formed by two zones of different ion densities around the colloid: i) the Stern layer, closest to the particle, positively charged (when the surface of the colloidal particle is negatively charged) or negatively charged (when the surface of the colloidal particle has a positive charge) comprises ions adsorbed to the surface of the colloidal particle; ii) the second layer, diffuse or Gouy-Chapman layer, is formed by free ions and counterions homogeneously distributed. All ions contained in the region of the electrical double layer accompany the Brownian motion of the colloidal particle. The potential in this layer is called the zeta potential (ζ) and is of great significance in the stability behavior of colloidal particles. Thereby, the stability increases when the absolute zeta potential increases. Indeed, if the zeta potential is larger than ± 40 mV a good stability of suspensions is ensured while for values of zeta potential lower than ± 30 mV, the suspensions is less stable. The ionic strength also affects the aggregation through a strong impact in the electrostatic barrier. The repulsive forces between colloidal particles decrease by the addition of salt on the solution. The impact of the salt on the stability of negatively colloidal particles was demonstrated (Holthoff et al. 1996; Montes Ruiz-Cabello et al. 2015).
#"! Repulsion can be enhanced by adding polymers that are adsorbed on the particles surface and which generate a repulsion between the polymer chains and consequently between the particles. This phenomenon is the factor determining, for example, the action of protective polymers. Repulsions of this nature tend to stabilize a system by steric effect (or entropic). When the polymers are polyelectrolyte, repulsion becomes extremely effective, and in this case is called electrosteric. In case of the electrostatic and steric forces the repulsive forces increases when the particles approach each other due to the presence of both charges and polymer brushes on the particles surface (Figure 1.5).
Figure 1.5: Illustration of the colloidal stabilizer electrostatic and steric. The repulsion increase when
particles approach to each other (left to the right) due to the ions and branch.
The attractive van der Waals forces act at short distances and can induce the aggregation of the system when particles approach each other, even in presence of some repulsions interactions between particles. Therefore, the stability of a colloidal suspension is determined by long and short-range interactions between colloidal particles. The total energy interaction (VT) of the system depends on the contribution of the attractive van der Waals forces (Vw) and
the electrical repulsive forces (Ve) as illustrated in Figure 1.6. This is the base of the
Deryagin-Landau-Verwey-Overbeek (DLVO) theory which a quantitative description of the colloidal stability. The observation of various types of deviant from the theory DLVO led to the proposition of other important factors affecting colloidal stability. Among them, these factors such as surface hydration, depletion and hydrodynamic interactions can introduce a delay factor to the particle-particle adhesion (Shaw 1992).
#,!
Figure 1.6: Illustration of energy of interaction in function of the distance r between particles. The
total energy (red curve) is the resultant of the attractive and repulsive forces (dashed curves).!
The depletion consists of a mechanism of instability of colloidal particles caused by polyelectrolyte, other colloidal particles, or in most case by polymers. Destabilization occurs when these species are excluded from the interparticle region, resulting in an osmotic pressure promoting aggregation (Figure 1.7). The volume available for polymers increases when the depletion zone overlaps. These distances are known as thickness depletion layer and depend on the diameter of the depletants (rigid species surrounding the particles).
Figure 1.7: Illustration of the colloidal destabilization due to the depletion. The attraction can occur
when particles approach to each other (left to the right) due to the expulsion of depletants between particles.
The external forces due to the gravity or shear also influence the interactions and collisions between particles. Hydrodynamic forces can impact the interactions between particles. Therefore, different forces influence simultaneously system.
##!
1.2.2 Aggregation
If attractive interactions dominate the repulsive ones, particles aggregate. The aggregation is characterized by the adhesion between two or more particles with each other. In the early stages, the particles form small isolate aggregates and then the size of aggregates (clusters) increases. In the last stages, a gel can be formed by percolation of clusters. Figure 1.8 shows the aggregation between particles (doublet and triplet) up to gel formation.
Figure 1.8: Illustration of aggregation of particles: from the stable suspension to a colloidal gel.
1.2.2.1 Cluster aggregation
Particles aggregation will result in the formation of clusters which structure is controlled by the aggregation kinetics. Two kinetics models have been described. In the first case, aggregation occurs immediately after a collision of particles forming a large (open) structure (Figure 1.9, left). This fast aggregation is named diffusion limited cluster aggregation (DLCA) (Weitz et al. 1985). In the second case, for which the interaction potential exhibit a finite, short-range repulsive barrier, the aggregation only occurs after several collisions between particles and therefore a more dense structure is formed as shown in Figure 1.9 on the right (Lin et al. 1990; Lin et al. 1990). This slow aggregation is named reaction limited
cluster aggregation (RLCA) (Weitz et al. 1985). Tang et al. (Tang et al. 2000) demonstrated
by image analysis the distinct structures formed by latex particles from these aggregation kinetics (Figure 1.9).