HAL Id: hal-02117547
https://hal.archives-ouvertes.fr/hal-02117547
Submitted on 6 May 2019HAL is a multi-disciplinary open access archive for the deposit and dissemination of sci-entific research documents, whether they are pub-lished or not. The documents may come from teaching and research institutions in France or abroad, or from public or private research centers.
L’archive ouverte pluridisciplinaire HAL, est destinée au dépôt et à la diffusion de documents scientifiques de niveau recherche, publiés ou non, émanant des établissements d’enseignement et de recherche français ou étrangers, des laboratoires publics ou privés.
Groundwater discharge to coastal streams – A
significant pathway for nitrogen inputs to a hypertrophic
Mediterranean coastal lagoon
Marine David, Vincent Bailly-Comte, Dominique Munaron, Annie Fiandrino,
Thomas Stieglitz
To cite this version:
Marine David, Vincent Bailly-Comte, Dominique Munaron, Annie Fiandrino, Thomas Stieglitz. Groundwater discharge to coastal streams – A significant pathway for nitrogen inputs to a hyper-trophic Mediterranean coastal lagoon. Science of the Total Environment, Elsevier, 2019, 677, pp.142-155. �10.1016/j.scitotenv.2019.04.233�. �hal-02117547�
1
Groundwater discharge to coastal streams – a significant pathway for nitrogen inputs to
1
a hypertrophic Mediterranean coastal lagoon
2
Marine David1,2,3, Vincent Bailly-Comte2, Dominique Munaron1, Annie Fiandrino1, Thomas
3
C. Stieglitz3,4
4
1) Ifremer, UMR MARBEC (IRD, Ifremer, CNRS, Université de Montpellier, CNRS),
5
Sète, France
6
2) NRE, BRGM, University of Montpellier,Montpellier,France
7
3) CEREGE, Aix-Marseille Université, CNRS, IRD, Coll France, 13545
Aix-en-8
Provence, France
9
4) Centre for Tropical Water and Aquatic Ecosystem Research, James Cook University,
10
Townsville, Queensland 4811, Australia
11
Highlights
12
- Groundwater contribution to nitrogen fluxes was investigated in a major tributary to Or
13
lagoon
14
- Groundwater is a major source of dissolved inorganic nitrogen (DIN) for the Salaison
15
River
16
- DIN fluxes monitored at the Salaison gauging station are considerably underestimated
17
- Groundwater driven DIN inputs should be taken into account in coastal lagoons
18 management actions 19 20 21 22
2 Graphical abstract 23 24 Abstract 25
Near-shore and direct groundwater inputs are frequently omitted from nutrient budgets of
26
coastal lagoons. This study investigated groundwater-driven dissolved inorganic nitrogen
27
(DIN) inputs from an alluvial aquifer to the hypertrophic Or lagoon, with a focus on the
28
Salaison River. Piezometric contours revealed that the Salaison hydrogeological catchment is
29
42% bigger than the surface watershed and hydraulic gradients suggest significant groundwater
30
discharge all along the stream. Hydrograph separation of the water flow at a gauging station
31
located 3 km upstream from the Or lagoon combined with DIN historical data enabled to
32
estimate that groundwater-driven DIN inputs account for 81-87% of the annual total DIN inputs
33
to the stream upstream from the gauging station. A radon mass balance was performed for the
34
hydrological cycle 2017-2018 to estimate groundwater inflow into this downstream part of the
35
stream. Results showed that (1) DIN fluxes increased by a factor 1.1 to 2.3 between the gauging
36
station and the Salaison outlet, (2) the increase in DIN was due to two groundwater-fed canals
37
and to groundwater discharge along the stream, the latter represented 63-78% of the water flow.
38
This study thus highlights the significance of groundwater driven DIN inputs into the Salaison
39
River, which account for 90% of the annual DIN inputs. This is particularly true in the
40
downstream part of the river, which, on averages, supplies 48% of total DIN inputs to the river.
41
These DIN inputs into the Or lagoon were previously not taken into account in the management
42
of this and other Mediterranean lagoons. The inputs will probably affect restoration processes
43
for many years due to their residence time in the aquifer. This study throws light on a rarely
44
documented source of ‘very-nearshore’ groundwater discharge to coastal streams in water and
45
nutrient budgets of coastal zone ecosystems. 46
47 48
3
2. Introduction
49
Transitional water bodies like Mediterranean coastal lagoons are located at the interface
50
between the continent and the sea, they are productive areas which provide substantial
51
ecosystem services (Mooney et al., 2009; Newton et al., 2018). In these semi-enclosed water
52
bodies, the gradient from fresh to saline water creates rich biodiversity which has been
53
documented and protected for several decades now (Basset et al., 2013). As export to the open
54
sea is limited, residence time in these water bodies is sufficiently long to enable assimilation
55
of nutrients by living organisms (Kjerfve and Magill, 1989; Quintana et al., 1998). Coastal
56
lagoons are thus particularly sensitive to nutrient fluxes resulting from anthropogenic activities
57
(de Jonge et al., 2002; Newton et al., 2014). Excess nutrient inputs can lead to eutrophication
58
of the water column, and proliferation of competitive species, thereby upsetting biodiversity
59
equilibrium and reducing the quality of the water (Cloern 2001; Souchu et al. 2010). Among
60
nutrient fluxes, the significant impacts of dissolved inorganic nitrogen (DIN) on eutrophication
61
were already investigated three decades ago (Rimmelin et al., 1998; Taylor et al., 1995).
62
The main sources of DIN contamination investigated in the past are soil leaching from
63
agricultural land, discharge from wastewater treatment plants (WWTPs), and urban and
64
industrial effluents (Derolez et al., 2014). Indeed, DIN inputs from streams to coastal zones are
65
mostly supplied by surface water, which transports agricultural inputs and wastewater
66
(Meinesz et al., 2013). More recently, groundwater has also been considered as a source of
67
DIN to the coastal zone (Johannes, 1980; Moore, 2010; Rodellas et al., 2015). These studies
68
mainly focussed on direct submarine groundwater discharge (Burnett et al., 2006; Rodellas et
69
al., 2018; Stieglitz et al., 2013) and some demonstrated that inputs from aquifers can
70
significantly contribute to total coastal DIN inputs (Moore, 2010; Slomp and Van Cappellen,
71
2004). However, the contributions of groundwater inflow to streams discharging in the
72
immediate coastal environment has rarely been investigated (Martinez et al., 2015; Peterson et
73
al., 2010; Santos et al., 2010).
74
The goal of the present study was thus to assess inputs of DIN from a coastal aquifer system to
75
a stream discharging into the hypertrophic Or lagoon located in the South of France. This
76
lagoon suffers from recurrent eutrophication which led to a ‘bad’ ecological status according
77
to the European Union Water Frame Directive (Symbo, 2017). Inputs of DIN from surface
78
waters to the lagoon have been significantly reduced by management actions in the past 20
79
years, mainly thanks to improvements of wastewater treatment plants and to a lesser extent, to
80
changes in agricultural fertilisation practices. However, despite these actions, no lasting
81
improvement in the quality of the lagoon water has been observed (Derolez et al., 2017). As
82
Salaison River is a perennial stream, groundwater inputs help maintain the water flow in
83
periods with no rainfall, but the associated DIN fluxes have not previously been studied.
84
Regional groundwater has high concentrations of DIN, and, given the comparatively long
85
transit times and associated time lags before discharge, inputs from this coastal aquifer could
86
be an obstacle to restoring Or lagoon.
87
Different methods are routinely implemented at different scales to study groundwater pathways
88
to streams or to the coastline:
4
(1) At the aquifer scale, piezometric maps are used to identify drainage pathways, but this
90
method requires a good knowledge of the aquifer geometry and its hydrodynamics
91
properties (Burnett et al., 2001; Schilling and Wolter, 2007).
92
(2) At the surface watershed scale, hydrograph separation of streamflow data enables
93
surface runoff to be distinguished from groundwater discharge (Chapman, 1999;
94
Eckhardt, 2005; Schilling and Wolter, 2001). However, in coastal rivers, most gauging
95
stations collecting such data are located a few kilometers upstream from the outlet to
96
avoid the influence of the tide, which can lead to the underestimation of total inputs to
97
the coastline (Santos et al., 2010).
98
(3) At a smaller scale, natural groundwater tracers like radon and radium are widely used
99
to locate and quantify groundwater discharge into streams (Cook et al., 2003; Mullinger
100
et al., 2007). High concentrations of these radionucleides are naturally found in
101
groundwater whereas low concentrations are found in surface waters, making them
102
efficient tracers of groundwater origin (Burnett and Dulaiova, 2003; Charette et al.,
103
2001). Groundwater flow can be quantified using a mass balance along the stream
104
(Cook et al., 2006; Peterson et al., 2010).
105
Even though combining approaches to improve our knowledge of the interactions between the
106
aquifer and the coast would seems obvious (Burnett et al., 2001; Martinez et al., 2015), in the
107
past, these methods were usually applied separately (Banks et al., 2011; Burnett et al., 2006;
108
Menció et al., 2014). In the present study, the three approaches were combined to locate and
109
quantify groundwater contribution to DIN inputs in Salaison River. In particular, groundwater
110
inputs were investigated in the section of the stream close to the outlet, downstream from the
111
Salaison gauging station. The three methods were combined to (i) obtain a more holistic view
112
of the hydrogeological functioning of this coastal stream than is possible using a single method,
113
(ii) estimate the groundwater contribution to the Or lagoon via the Salaison River, and (iii)
114
assess more accurate DIN fluxes to the Or lagoon than estimated at the Salaison River gauging
115
station.
116
3. Material and methods
117
3.1. Study sites
118
3.1.1. Or lagoon
119
The Or lagoon is located southeast of the city of Montpellier on the French Mediterranean coast
120
(Fig. 1a). The surface area of the lagoon is 29.6 km² and the average depth is 1 m. In addition
121
to the presence of an east-west salinity gradient, the lagoon is subject to marked interannual
122
variations in salinity (from 2 to 35 psu). The northern bank of the lagoon is at the edge of 20
123
km² of wetlands which have been the subject of major land reclamations actions. The Or lagoon
124
watershed covers 410 km², and has a flat landform rising from 0 (sea level) to 193 m asl (Blaise
125
et al., 2008). The area is characterised by a typical Mediterranean climate. Precipitation is very
126
low in summer, but intense rainfall events in spring and autumn can cause serious flooding.
127
Annual average precipitation ranges from 600 mm in the southern part of the watershed to 750
128
mm in the northern part (Aquascop, 2013). The area is urbanized but agriculture still represents
129
a major land use with intensively managed vineyards, market gardening, orchards and cereal
130
crops. These activities have led to significant nutrient loading of the underlying aquifer, for
5
example, nitrate concentrations reach 1600 µmol.L-1 (i.e. 100 mg(NO
3)/L) in the eastern part
132
of the aquifer (ADES database http://ades.eaufrance.fr).
133
The Or lagoon lies on a Holocene clay and clayey sand formation and is bound to the north by
134
the coastal plain of Mauguio-Lunel (Fig. 1a). The adjacent Villafranchien aquifer is formed by
135
the most recent layers of alluvial and colluvial deposits from the Pliocene and the Holocene,
136
overlying a cretaceous and Jurassic limestone bedrock (Blaise et al., 2008). This aquifer
137
outcrops over 252 km², it is limited to the west by the Lez River and to the east by the Vidourle
138
River, and is partly fed by limestone (karst aquifer) along its north boundary. The aquifer is
139
unconfined, except downstream at the edge of the lagoon where it becomes confined as it
140
expands under Holocene silt. The presence of impermeable silt and clay from the Holocene
141
prevents direct exchanges of water between the aquifer and the lagoon, but to date, little is
142
known about the possible connections through the perennial streams which drain the aquifer
143
(Blaise et al., 2008).
144
3.1.2. Salaison River
145
The Or lagoon is supplied with freshwater from natural streams and artificial canals (Fig. 1a).
146
In the eastern watershed, the Lunel and Rhône to Sète canals bring water from the eastern
147
alluvial plain. The present study focusses on the northern part of the watershed, where natural
148
streams flow into the lagoon. Five main rivers and ten temporary streams flowing in a
north-149
west south-east direction discharge into the Or lagoon. The Salaison River is one of the main
150
tributaries flowing into the lagoon, which accounts for 59% (2015-2016) of the total freshwater
151
supplied by the streams in the watershed (Colin et al., 2017). The Salaison River drains a 66
152
km2 watershed which corresponds to 17% of the northern watershed of the Or lagoon. The
153
source of the river is located on the northern Cretaceous limestone and, for its last nine
154
kilometers, it flows over the Villafranchien aquifer.
155
The Salaison River used to receive effluents from four waste water treatment plants (WWTPs)
156
(St Vincent de Barbeyrargues, St Aunes, Vendargues, Mauguio, with a total of 53 800
157
population equivalent) (Aquascop, 2013). In order to reduce inputs to Salaison and Or lagoon,
158
St Vincent de Barbeyrargues WWTP (800 population equivalent) has not released any
159
discharge into the Salaison since 2010, and the three other WWTP outlets were removed from
160
the river between 2008 and 2011 (Symbo, 2014). Since then, diffuse surface and groundwater
161
flows have been the sources of nitrogen inputs into the stream. In addition, the river is fed in
162
its downstream part by two canals, one of which (Balaurie) used to receive effluent from the
163
Vendargues WWTP (6 000 population equivalent) before it was removed and the other
164
(Roubine) was used for urban and storm water drainage (Fig. 1b) .
165
3.2. Groundwater catchment of the Salaison river
166
A piezometric survey of the aquifer was carried out to identify the Salaison groundwater
167
catchment, i.e. the area of the aquifer that interacts with the stream. Water levels were measured
168
at 18 piezometers in high water table conditions on May 2nd and 3rd 2018 (Fig. 1b). Relative
169
water level data were combined with the stream elevation and a digital elevation model to
170
obtain the piezometric contours around the Salaison River by interpolation in ArcGIS.
6
Groundwater contours based on water table crests on both sides of the Salaison River were
172
used to delineate the Salaison’s groundwater catchment.
173
3.3. Salaison gauging station
174
Since 1986, stream water flow has been monitored through high-frequency limnimetric
175
measurements made by the Regional Department for Environment, Development and Housing
176
(French acronym DREAL). The gauging station is located 3 km upstream from the outlet to
177
the lagoon and upstream from the Balaurie and Roubine canals (Fig .1b), capturing 75% of its
178
total watershed (i.e. 50 km2). Since 2006, DIN concentrations have been sampled by
179
management agencies every two weeks under regular monitoring and at greater frequencies
180
during floods, to assess DIN fluxes at the gauging station.
181
3.4. Combined methods upstream and downstream from the gauging station
182
In this study, two sections of the stream were distinguished based on the location of the gauging
183
station: upstream and downstream sections. In the upstream section, the contributions of
184
groundwater to the total DIN inputs at the gauging station were investigated. In the downstream
185
section, additionnal inputs occuring between the gauging station and the Salaison outlet were
186
also investigated, including the two downstream canals, along with groundwater contribution.
187
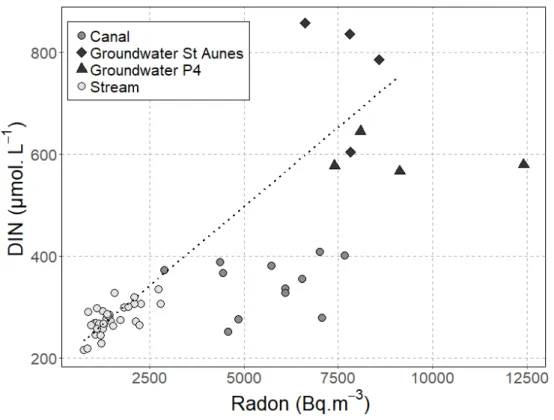
In any part of the stream, instantaneous DIN fluxes fX(t) (in µmol.s-1) were estimated as the
188
product of water flow QX(t) (in L.s-1) and DIN concentration [N]X(t) (in µmol.L-1) (eq. 1) :
189
!"($) = '(()). + "($) (-)
190
In the rest of the paper, the time increment ‘(t)’ was removed for the purpose of clarity (i.e. fX,
191
QX and [N]X).
192
First, total DIN fluxes were assessed in each section. Then, estimating groundwater driven DIN
193
fluxes enabled to obtain the groundwater contribution to the total DIN fluxes. The two sections
194
of the stream were approached differently (Table 1):
195
- the upstream part was investigated using historical data collected from 2013 to 2018 at
196
the gauging station, to estimate total DIN fluxes fstation and groundwater driven DIN flux
197
fgw (detailed in section 2.5),
198
- Supplementary field data were collected in the hydrological cycle 2017-2018 for the
199
downstream section, to estimate additional DIN fluxes Δfdownstream and additional 200
groundwater driven DIN fluxes Δfgw using a radon mass balance (detailed in section
201
2.6),
202
Instantaneous DIN fluxes fX were integrated over one hydrological year (from September 1st to
203
the following August 31st) and converted into tonnes to estimate annual DIN inputs F
X (in tN.y
-204
1). The relative groundwater contribution to the total DIN flux was estimated as the ratio of
205
groundwater driven DIN flux to total DIN flux.
7
3.5. Groundwater contribution to DIN fluxes upstream from the Salaison gauging
207
station
208
3.5.1. Water flow at the gauging station
209
Stream water flow data Qstation at the gauging station (Fig. 1b) were extracted for the past five
210
hydrological cycles from the DREAL database (hydro.eaufrance.fr, station Y3315080, 2013
-211
2018) at hourly intervals, taking into account the fact that the Salaison has a fast hydrological
212
response to rainfall (less than 6 hours between a rainfall event and an increase in flow).
213
3.5.2. DIN fluxes at the gauging station
214
Dissolved inorganic nitrogen (DIN) concentrations were extracted from the public water
215
quality database Naïades (http://naiades.eaufrance.fr/). A total of 81 DIN data were collected
216
from 2013 to 2018 and clustered according to their associated water flow to assess mean
217
nutrient concentrations for three water flow classes [N]station (Table 2). The DIN flux at the
218
gauging station fstation is obtained using eq. 1 with Qstation and the associated average DIN class
219
concentrations [N]station. Standard variations in DIN concentrations in each of the three classes
220
were used to estimate uncertainty.
221
3.5.3. Groundwater flow at the gauging station
222
Groundwater flow Qgw was obtained from hydrograph separation of the stream water flow
223
Qstation. The Chapman model (Chapman, 1999) separates fast subsurface flow from base flow,
224
the latter usually being driven by groundwater. The FlowScreen R package with the function
225
bf_oneparam was used to assess time series of groundwater flow at an hourly time step. The
226
recession constant was estimated for each hydrological cycle using the ESPERE tool (BRGM,
227
Lanini et al. 2016), (µ= 0.971, σ= 0.019, n=5).
228
3.5.4. Groundwater end-member for DIN concentrations at the gauging station
229
Three sets of data were collected to determine the groundwater end-member for DIN
230
concentration at the gauging station [N]gw_s :
231
- piezometer P4 was sampled for groundwater DIN concentrations on March 8th, April
232
27th, May 5th, June 25th and July 27th in 2018. In this study, this well was assumed to be
233
representative of the groundwater characteristics because of its location close to the
234
gauging station (Fig.1b). In addition, piezometer St Aunes, located upstream of the
235
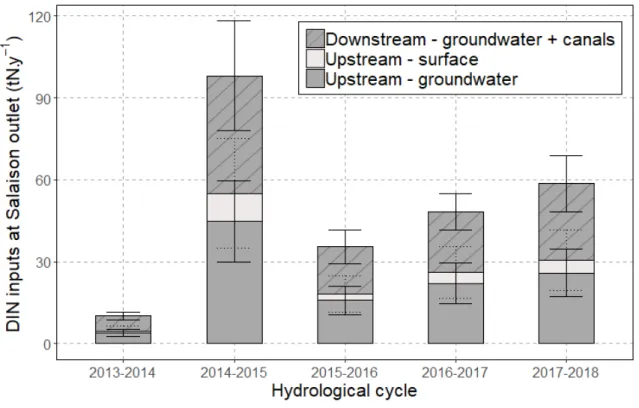
Salaison watershed, was sampled on March 8th, June 25th and July 27th in 2018. For
236
each sample, in situ salinity was measured using a multiparameter probe (WTW 3620).
237
- past DIN concentrations in groundwater at the P4 piezometer were taken from the
238
BRGM study in 2006-2007 (Blaise et al., 2008). These past data were compared with
239
new data to quamify changes in DIN concentrations over the past decade.
240
- stream data for DIN concentration and conductivity at the gauging station were also
241
used to determine the groundwater end-member.
8
3.6. Groundwater contribution to DIN fluxes downstream from the Salaison gauging
243
station
244
3.6.1. Water inflow downstream from the gauging station
245
3.6.1.1. Use of a radon and water balance to assess total and groundwater
246
flow
247
A combined water and radon mass balance was constructed in the downstream part of the
248
stream using two successive box models (Fig. 2) to estimate, for the hydrological cycle
2017-249
2018, (1) the additional groundwater discharge ΔQgw and (2) the total additional water flow
250
ΔQdownstream discharging between the gauging station and the outlet.
251
The first box for the radon mass balance includes the first 700 m downstream from the gauging
252
station with the discharge from the Balaurie canal, and the second box, the section from 700 m
253
to 2000 m, taking the discharge from the Roubine canal into account (Fig. 1c). The final section
254
(2000 m-3000 m downstream from the gauging station) is affected by changes in lagoon water
255
surface level caused by variations in wind and atmospheric pressure, as indicated by variable
256
salinity. The last section can consequently not be considered as being in a steady state.
257
Geological data showed that this section receives a negligible inflow of groundwater due to the
258
impermeability of the underlying silt (Fig. 1c), it was not included in the model.
259
Data were collected when no rain had fallen in the two preceding days. In these dry
260
hydrological conditions, surface runoff was assumed to be negligible in the mass balance and
261
other than the two canals discharging into the boxes, no surface water inputs were taken into
262
consideration. Since all field measurement were completed within a few hours, evaporation of
263
stream water and precipitation were assumed to be negligible in the mass balance. In this case,
264
only groundwater (ΔQgw) and canals (Qcan) composed the total water inflow downstream
265
ΔQdownstream (eq. 2) :
266
ΔQdownstream = ΔQgw + Qcan (2)
267
In these conditions, the stream was assumed to be in a steady state with respect to radon.
268
Hyporheic fluxes were also included in the groundwater flow. The estimated groundwater
269
discharge ΔQgw includes groundwater sensu stricto and hyporheic flux (Avery et al., 2018).
270
The concentration of radon in a box was assumed to be the average concentration of radon in
271
the inflow and the outflow (Fig. 2).
272
3.6.1.2. Radon sampling and analysis
273
Radon source and sinks used in the mass balance are summarised in Table 3. Next, we describe
274
in detail the methods applied to measure radon concentrations in water, diffuse radon inputs
275
from sediments, and atmospheric evasion.
276
Water was sampled once a month from January to July 2018 at five stations in the stream at 0,
277
50, 700, 750, 1 850 and 2 000 m downstream from the gauging station and in the two canals
278
(Fig. 1c). Groundwater was sampled during the same period at piezometers P4 and St Aunes
279
(same sampling as section 2.5.4). Water was sampled 20 cm below the surface using an
280
immersed pump and primed directly into 2L bottles, thereby ensuring that the water sampled
9
did not exchange any gas with the atmosphere. Conductivity of the sampled water was
282
measured with a WTW 3620 multiparameter probe.
283
Radon in the samples was analysed using an electronic Radon-in-air monitor (Rad7, Durridge
284
Co.). 222Rn was extracted from the water by continuous recirculation of air in a closed loop
285
until it reached equilibrium. Equilibrium values in air were corrected to in-water values using
286
standard methods (Burnett and Dulaiova, 2003; Stieglitz et al., 2013) (Table 3).
287
In order to determine diffuse inputs of radon, sediments were sampled from the bed of the
288
Salaison River and incubated in a 2 L bottle filled with water (average dry weight: 11.92 g,
289
σ=0.98, n=4) (Stieglitz et al., 2013). Samples were analysed with a Rad7 one month after being
290
collected, when the sediments were assumed to be in equilibrium with the water, i.e. radon
291
production equals radon loss by decay (Cook et al., 2008). The radon production rate can be
292
estimated as follows (eq. 3):
293
./011 = 234. 5.6:7;<=6789 (3)
294
where Ceq is the concentration of radon at equilibrium (Bq.m-3), Rinc and Rfield are the ratios of
295
the volume of water to that of the sediment in the incubated sample and in the field,
296
respectively. Average sediment depth was estimated at 0.4 m based on field observations.
297
Average radon diffusion (Fdiff) was calculated to be 600 ± 150 Bq.m-².d-1 (n = 6).
298
Khadka et al. 2017 developed a method to assess atmospheric evasion at a known water
299
temperature, density and velocity. Using this method in our study, atmospheric evasion (k)
300
ranged between 1.6 10-5 to 2.5 10-5 m.s-1 across the campaigns and was assumed to be constant
301
in the stream for each campaign.
302
In each sampling campaign, water flow was gauged manually at the gauging station Qstation and
303
in the two canals Qcan as water flow inputs to the mass balance (Table 3). In addition, water
304
flow at the Salaison outlet was gauged manually to validate the model outputs ΔQdownstream with
305
differential gauging.
306
To understand the link between groundwater inflow and groundwater dynamics and
307
hydrological conditions, daily time series of water table fluctuation were obtained from the
308
Saint Aunes piezometer on the ADES database (http://ades.eaufrance.fr / ID number BSS
309
09915X0181/AUNES), and annual rainfall data from the Meteo France database (Fréjorgues
310
weather station).
311
3.6.2. DIN sampling and analysis downstream from the gauging station
312
At the same time as water was sampled for radon analysis, water was sampled to measure the
313
concentration of DIN in the stream, the two canals and at piezometers P4 and St Aunes as
314
described above in section 2.6.1.2 (Fig 1c).
315
Water samples were taken in HDPE 100 mL bottles, previously washed with analytical grade
316
HCl 1.2N and rinsed with ultrapure water (UW) at the laboratory. All the sampling equipment
317
and filters were rinsed with native water before sampling. Samples were filtered through a 100
318
µm filter for nitrate (NO3), nitrite (NO2), ammonium (NH4), to prevent particles from
319
interfering with the analysis of dissolved nutrients. Samples were immediately stored at -25°C
10
until analysis. The concentrations of the 3 forms of dissolved inorganic nitrogen were measured
321
using SEAL AA3 Analytical Autoanalyzers using the method described in Aminot and Kerouel
322
(2007) with colorimetric detection (from SEAL Analytical, Germany) and fluorimetric
323
detection (from JASCO, FP-2020plus, France) respectively for, NO2/NO3 and NH4. NID
324
concentration was the sum of nitrites, nitrates and ammonium concentrations for each sample.
325
Analytical grade standards KNO3, NaNO2, (NH4)2SO4 were obtained from Sigma-Aldrich (St.
326
Quentin Fallavier, France). Stock standard solutions were prepared in UW and stored in
327
waterproof HDPE bottles at room temperature in the dark at the laboratory. Fresh working
328
standards and calibration solutions were prepared daily by appropriate dilution of the stock
329
solutions using gravimetric procedures. Laboratory quality controls (QC) were performed daily
330
using gravimetric procedures and CertiPUR® NIST solutions (Merck,
St-Quentin-en-331
Yvelines,France), to validate each analysis. The linearity of the calibration curves was always
332
greater than R² = 0.9996. The limits of detection (LOD) were 0.05, 0.25 and 0.05 µmol.L-1 for
333
respectively, NO2, NO3 and NH4.
334
3.6.3. Estimation of annual DIN inputs downstream from the gauging station
335
The DIN flux at Salaison outlet was estimated as the sum of the DIN flux upstream and
336
downstream, assuming negliglible in-stream nitrogen consumption (i.e. fstation + Δfdownstream).
337
The increase factor ɸN between the DIN flux at the Salaison gauging station fstation and the DIN
338
flux at the outlet was estimated as follows (eq. 4):
339
ɸ? =:@ABACDEFG:HDIE@AJKBL
:@ABACDE (4)
340
Annual increase factor IN was estimated for each hydrological year from 2013-2014 to
2017-341
2018 using the frequency of each water flow class in each hydrological year.
342
3.6.4. Groundwater driven DIN fluxes downstream from the gauging station
343
In the downstream part of the river, assuming negligible additional surface fluxes (2.3.1), DIN
344
fluxes Δfdownstream were assumed to be the sum of groundwater-driven DIN fluxes Δfgw and
345
canal DIN fluxes fcan (eq. 5):
346
M1=NO8PQR;ST= M1UO+ 19S8 5
347
The relation between DIN and radon concentrations in the stream was used to determine the
348
groundwater end-member downstream [N]gw_d.
11
4. Results
350
4.1. Groundwater catchment of the Salaison River
351
The groundwater catchment i.e. the part of the aquifer connected to the Salaison River
352
delineated by the piezometric crest on both sides of the river covers 32.9 km², which is 42%
353
bigger than the Salaison watershed (i.e. surface water catchment) (Fig. 3). Piezometric contours
354
show a main channel flowing from the north west to the south east of the aquifer underlying
355
the stream, suggesting significant interactions between surface and groundwater. The contours
356
suggest that on the most upstream part, water inflows from the stream to the aquifer, and
357
downstream, the aquifer discharges into the stream. Along the last 4 km of the stream (i.e.
358
where groundwater feeds the Salaison River), the hydraulic gradient decreases from 0.46 %
359
upstream from the gauging station to 0.15 % downstream. Groundwater discharge may
360
consequently be significant all along the downstream part of the Salaison River. Combined
361
with the geological data, which revealed impermeable sediment units close to the lagoon, the
362
decreasing hydraulic gradient showed that submarine discharge to the lagoon must be
363
negligible, confirming previous conclusions.
364
4.2. Groundwater contribution to DIN fluxes upstream from the Salaison gauging
365
station
366
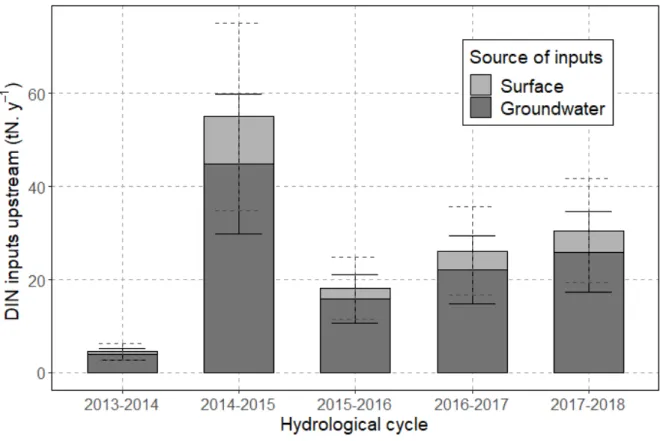
Annual DIN inputs at the gauging station (Fstation) ranged from 4.5 ± 1.8 tN.y-1 for the dry
367
hydrological cycle 2013-2014 to 55.2 ± 20.1 tN.y-1 for the wet hydrological cycle 2014-2015
368
(Fig. 4), with 30.5 ± 11.1 tN.y-1 for the hydrological cycle 2017-2018. DIN inputs were linked
369
to annual precipitation (360 mm in 2013-2014; 1176 mm in 2014-2015). Nitrate (NO3) was the
370
main nitrogen form in the stream, with 74% to 99% of the total DIN concentrations.
371
In 2018, concentrations of DIN in the P4 well ranged around 600 µmol.L-1 and reached higher
372
values in the St Aunes piezometer (around 800 µmol.L-1) (Fig. 5). Concentrations in the
373
piezometer P4 remained in the same range in the three sampled years, suggesting that
374
groundwater concentrations can be considered constant in the piezometer close to the Salaison
375
River for the last five hydrological cycles. A correlation found between DIN concentrations at
376
the station and specific conductivity (from DREAL) from 2013 to 2018, suggests that the DIN
377
in the Salaison River originated from a high conductivity end-member (likely to be the
378
‘theorical’ groundwater end-member), diluted by mixing with a low DIN/ low conductivity
379
end-member (Fig. 5). The latter end-member is likely to be surface runoff water since other
380
DIN sources are negligible (section 2.1.2). Moreover, nitrate composed 95% to 100% of the
381
total DIN forms in P4 and St Aunes and these proportions were similar in the stream. These
382
results suggests that the highly enriched Villafranchien aquifer constitutes the main DIN source
383
in the river.
384
In the upstream part of the Salaison River, the non-linear correlation between DIN
385
concentrations and conductivity suggests that DIN in the stream cannot be the result of a
386
conservative mixing between two end-members (Fig. 5). Based on high DIN concentrations /
387
high conductivity measurements in the stream, the ‘effective’ groundwater end-member DIN
388
concentrations are twice lower than DIN concentrations measured in the groundwater. The
389
‘theoretical’ groundwater end-member for DIN concentration is then reduced to the ‘effective’
390
groundwater end-member, suggesting nitrogen assimilation in the stream (i.e. from 600
12
µmol.L-1 to 300 µmol.L-1). To estimate groundwater driven DIN inputs at the gauging station,
392
this ‘effective groundwater’ end-member was used, i.e. a DIN concentration of 300 ± 100
393
µmol.L-1 was assigned to [N]gw_s.
394
The annual DIN flux from groundwater at the gauging station Fgw derived from hydrograph
395
separation Qgw and ‘effective’ groundwater concentration [N]gw_s (in eq. 1) ranged from 3.9 ±
396
1.3 tN.y-1 (2013-2014) to 44.8 ± 14.9 tN.y-1 (2014-2015) (Fig. 4), with 25.9 ± 8.6 tN.y-1 for
397
2017-2018.
398
Annual groundwater contributions to instream DIN inputs ranged from 81% (2014-2015) to
399
87% (2013-2014), and 85% in 2017-2018. Contributions were lower for wet hydrological
400
cycles when surface runoff was more important, but annual groundwater contributions were
401
important as groundwater is a major DIN source in the stream. Thus, significant
groundwater-402
driven DIN fluxes are discharged upstream from the gauging station in this perennial stream.
403
4.3. Interannual DIN fluxes downstream from the Salaison gauging station
404
4.3.1. Interannual water inflow derived from the radon mass balance
405
Radon concentrations at piezometer P4 and St Aunes were sampled at maximum and minimum
406
table levels (from 14.5 to 16 masl at St Aunes), and ranged from 8 087 ± 178 to 12 412 ± 232
407
Bq.m-3for P4 and 6 617 ± 327 Bq.m-3 to 8 580 ± 215 Bq.m-3 for St Aunes. Radon concentrations
408
were in the same range for the two piezometers, and radon concentrations at the P4 piezometers
409
were used as the end-member concentration in the radon mass balance for each campaign
410
(Table 3).
411
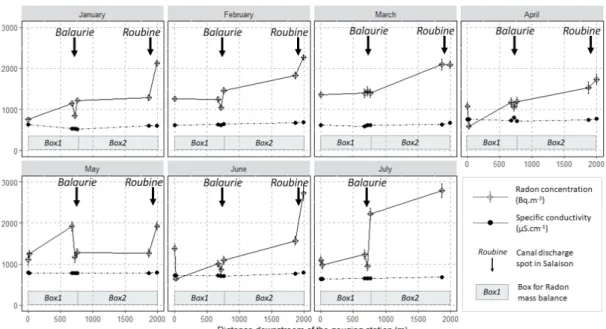
Radon concentrations in the stream at the gauging station ranged from 751 Bq.m-3 in January
412
to 1 378 Bq.m-3 in June, suggesting a considerable inflow of groundwater already occurring
413
upstream from the gauging station (Fig. 6). Importantly, radon concentrations increased
414
downstream from the gauging station, indicating significant groundwater influx. The increase
415
in radon concentration is evidence for direct groundwater discharge along the stream,
416
consistent with the geology in this section (Fig. 3).
417
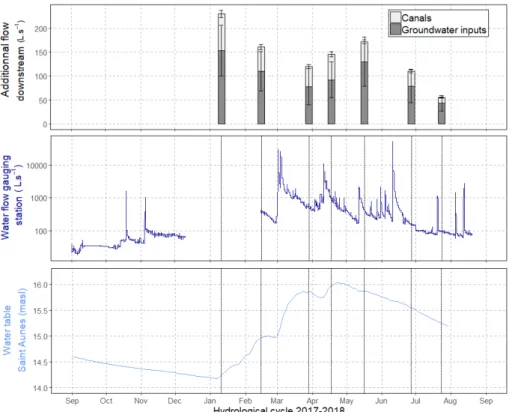
Downstream water flow ΔQdownstream estimated from the radon mass balance ranged from 55 ±
418
17 L.s-1 in July to 230 ± 73 L.s-1 in January (Fig. 7). At the Salaison outlet, confidence intervals
419
for water flow estimated with the radon mass balance overlapped those of manual gauging,
420
which enabled to validate the model outputs. Groundwater discharge estimated from the radon
421
mass balance downstream from the gauging station ΔQgw ranged from 43 ± 16 L.s-1 in July to
422
153 ± 53 L.s-1 in January, and contributed between 63% in April (high flows) and 78% in July
423
(low flows) to the total additional discharge ΔQdownstream. The radon mass balances were carried
424
out in different hydrological conditions (from 58 L.s-1 to 825 L.s-1 at the gauging station) but
425
the confidence interval remained in the same order of magnitude in most of the campaigns. The
426
absolute water flow discharging downstream, with significant uncertainties, did not seem to be
427
correlated (in a simple way) with the water table or with water flow at the gauging station
428
Qstation. Nevertheless, discharge downstream from the gauging station can have a significantly
429
impact on the water flow reaching the Salaison outlet, especially in dry conditions. For example
430
in July, downstream water discharge ΔQdownstream increased water flow at the gauging station
431
Qstation from 58 L.s-1 to 113 L.s-1 at the outlet.
13
4.3.1. Annual DIN inputs downstream
433
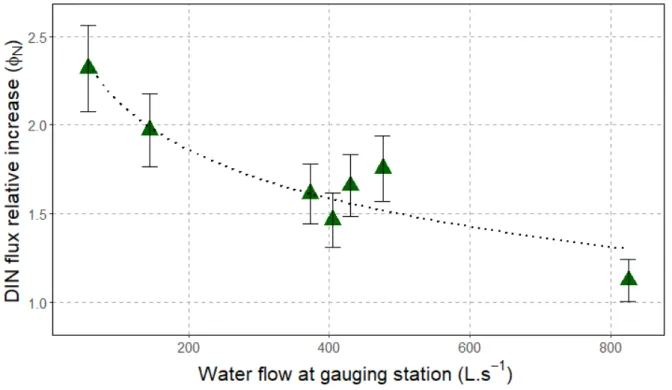
The relative increase in the DIN flux between the gauging station and the outlet ɸN was
434
inversely correlated with the hydrological conditions (Fig. 8). When the water flow was low at
435
the gauging station (dry conditions in July), the groundwater driven DIN flux downstream from
436
the gauging station significantly increased the DIN flux at the Salaison outlet to a factor 2.3 ±
437
0.2. Conversely, in wet hydrological conditions (April), water flow at the outlet increased by a
438
factor 1.1 ± 0.1. Absolute downstream DIN inputs remained in the same order of magnitude
439
but, depending on the hydrological conditions, these inputs may have a significant influence
440
on DIN flow at the outlet.
441
The annual increase factor IN extrapolated from frequency-weighted water flow classes ranged
442
from 1.8 ± 0.4 in 2014-2015 (in wet conditions) to 2.3 ± 0.6 in 2013-2014 (in dry conditions),
443
and 1.9 ± 0.5 in 2017-2018. Annual DIN fluxes discharged directly into the downstream part
444
of the Salaison River ΔFdownstream estimated with the annual increase factor IN ranged from 5.6
445
± 1.4 tN.y-1 (2013-2014) and 43.1 ± 20.1 tN.y-1 (2014-2015), and 28.1 ± 10.3 tN.y-1 in
2017-446
2018.
447
4.3.2. Contribution of groundwater to the interannual DIN flux downstream
448
On the downstream part of Salaison River, the positive correlation between DIN and radon
449
concentrations suggests that the DIN in the stream originated from the groundwater (Fig. 9).
450
Maximum DIN values in the stream ranged between 300 and 400 µmol.L-1, which was similar
451
to the value used for the ‘effective groundwater end-member’ upstream ([N]gw_s). With the
452
similar end-member characteristics downstream (i.e. [N]gw_d = 300 ± 100 µmol.L-1), the
453
contribution of groundwater to the DIN flux downstream from the gauging station ranged from
454
56% in April (high flow) to 73% in July (low flows).
455
The concentration of radon in the Balaurie and Roubine canals (Ccan) ranged from 2 298 to 7
456
664 Bq.m-3,and their high radon and DIN concentrations were close to the values measured at
457
the piezometers (Fig. 9). In addition, conductivity in the downstream part and the canals was
458
high for all campaigns and reached the groundwater characteristics (Fig. 6). Since the field
459
campaigns were conducted in dry periods, water discharging from these short canals probably
460
only originate from groundwater and drain the lower aquifer units. Average flow in the Balaurie
461
and Roubine canals remained between 20 L.s-1 in dry hydrological conditions and 50 L.s-1 in
462
wet hydrological conditions. Consequently, canal discharge was counted as groundwater
463
inflow, to be added to direct inflow to the main Salaison channel, meaning that groundwater
464
contribution to total DIN flux in the downstream part was 100%.
465
4.4. Overall groundwater contribution to the inputs at Salaison outlet
466
At the Salaison outlet, the downstream inputs from groundwater and canals significantly
467
increased the total DIN inputs reaching Or lagoon (i.e. Fstation+ΔFdownstream), which ranged from
468
10 tN.y-1 (2013-2014) to 98 tN.y-1 (2014-2015), with 59 tN.y-1 in 2017-2018 (Fig. 10). The last
469
part of the stream located in the immediate coastal environment was responsible for 44%
470
(2014-2015) to 56% (2013-2014) of the DIN inputs to the Or lagoon, and 48% in 2017-2018.
471
The contribution of groundwater to annual DIN inputs at the Salaison outlet estimated with the
472
annual groundwater-driven DIN inputs at the Salaison outlet (i.e. Fgw + ΔFgw)and DIN inputs
14
at the Salaison outlet (i.e. Fstation+ΔFdownstream) ranged from 89% (2014-2015) to 94%
(2013-474
2014). Hence, adding the results obtained from the downstream part of the Salaison to the
475
annual DIN inputs increased the overall contribution of groundwater to this perennial stream,
476
making it the main source of DIN in the stream.
15
5. Discussion
478
5.1. Uncertainties on the combined methods
479
5.1.1. Uncertainties on the piezometric contours
480
Piezometric contours were determined from measurements of the level of well water for one
481
campaign in high flows (Fig. 3). The lack of information about aquifer geometry
(cross-482
section) and hydrodynamic parameters (hydraulic transmissivity) did not allow to estimate
483
groundwater flows using Darcy’s law (Schilling and Wolter, 2007), but the method
484
nevertheless provides a first qualitative overview of surface water / groundwater interactions
485
around the Salaison River. Indeed, the hydraulic gradients estimated from the piezometric
486
contours confirm the importance of the downstream part of the stream. Groundwater
487
contributions to DIN inputs in the stream were estimated without using the groundwater
488
catchment data, and adding a qualitative overview from a broader scale supports the
489
conclusions of the study on the hydrogeological functioning of the area.
490
5.1.2. Uncertainties on DIN inputs upstream from the gauging station
491
Hydrograph separation of high frequency water flow data combined with previous stream data
492
analysis made it possible to assess the contribution of groundwater, and the baseflow results in
493
this study are in agreement with those of a perennial stream (Eckhardt, 2008). Our results
494
highlight the fact that, as the main source of DIN in the stream, groundwater was diluted by a
495
low DIN / low conductivity surface water end-member (Fig. 5). Nevertheless, surface driven
496
DIN fluxes can be significant even with low DIN concentrations, especially during flood events
497
where water flow increases significantly. Thus, considering that groundwater contribution at
498
the gauging station was 100% would have led to an overestimation of groundwater loads.
499
The non-conservative relation of DIN with conductivity upstream from the gauging station
500
suggested that using DIN concentrations in groundwater from ‘theoretical’ groundwater
end-501
member would have overestimated the DIN flux upstream from the gauging station (Fig. 5).
502
The concentrations of DIN measured in the stream at the gauging station represent the
503
combination of DIN inputs and DIN consumption upstream, either during the transit between
504
the aquifer and the stream or during transit along the stream, for example due to uptake by
505
plants or consumption by microorganisms (Cooper, 1990). Indeed, not taking the consumption
506
processes along the stream into account would have led to a 50% overestimation (i.e. from the
507
‘theoretical’ end-member 600 µmol.L-1 to the ‘effective’ end-members 300 µmol.L-1). Still,
508
estimating the groundwater driven DIN flux with a constant ‘effective’ end-member
509
concentration deduced from groundwater samples relies on the assumption that mixing with
510
surface water is conservative. Figure 5 shows that, in practice, this is not the case, but the
511
‘effective’ groundwater end-member provides a more realistic estimation of the contribution
512
of groundwater upstream. Additional data for DIN for conductivity between 800 and 1200
513
µS.cm-1 in the stream would enable to reduce the uncertainty of the groundwater end-member
514
(i.e. conductivity associated with the ‘effective groundwater end-member’) (Fig. 5).
515
5.1.3. Uncertainties on DIN inputs downstream from the gauging station
516
The absolute uncertainty of groundwater inflow estimated from the radon mass balance ΔQgw
517
is related to all mass balance parameters, with higher uncertainty for the April and May
518
campaigns (Fig. 7). The main parameters which influence uncertainty are the choice of radon
16
end-member concentrations and disscharge measurements (as initial inputs to the model).
520
Despite their high uncertainties, the model outputs (water flow at the Salaison outlet) are within
521
the same confidence intervals as manual gauging at the outlet. Importantly, the results of this
522
study suggest that all the water that discharged into the downstream part of the river was
523
groundwater driven (direct inflow + canal inputs) (Fig. 9). In future studies, differential water
524
flow gauging between the gauging station and the outlet would be sufficient to estimate the
525
additional groundwater flow (for periods with no significant surface flow).
526
Groundwater inputs downstream from the gauging station estimated in this study were
527
extrapolated to obtain an overall DIN flux at the scale of a hydrological cycle, based on the
528
assumption that the 7-month campaigns were representative of the whole hydrological year.
529
Indeed, the first months of the hydrological cycle 2017-2018 were particularly dry (Fig. 7),
530
with 56 mm of rainfall from September to December 2017. Furthermore, the seven campaigns
531
were able to capture different water flows (from 55 L.s-1 to 825 L.s-1) which are representative
532
of 92% of the hydrological conditions in the stream. Thus, studying water flow and changes in
533
DIN flux in seven campaigns conducted from January to July enabled us to estimate the general
534
interaction processes between the groundwater and the surface water for the whole
535
hydrological cycle (from September to the following August), even though it is difficult to
536
capture the correlation with the behaviour of the aquifer. Sampling campaigns did not capture
537
flood events, but the results of this study show that the relative increase in high flows was not
538
significant (Fig. 8). Indeed, water flow and DIN flux were already high at the gauging station
539
and remained stable until the outlet.
540
5.1.4. Combining methods to understand surface water / groundwater
541
interaction in the Salaison River
542
In this study, complementary methods were used to improve our understanding of surface water
543
/ groundwater interactions along the Salaison River. High frequency water flow and DIN data
544
were available for the upstream part of the Salaison, enabling the use of hydrograph baseflow
545
separation and flow interval classification methods to estimate DIN fluxes. Downstream from
546
the gauging station, a radon mass balance highlighted the predominance of groundwater driven
547
DIN inputs in this part of the stream. Combining the results of the downstream radon mass
548
balance with results of the upstream hydrograph separation results enabled estimation of
549
groundwater-driven DIN fluxes at the Salaison outlet. Combining the methods did not reduce
550
uncertainties, but validated the robustness of the results by approaching the study from different
551
angles (Baudron et al., 2015; Martinez et al., 2015).
552
5.2. Importance of the downstream part of the Salaison River
553
This study demonstrated that the majority of DIN fluxes at the Salaison River outlet are
554
groundwater driven (Fig. 10). As a perennial stream, groundwater is a major contributor to
555
stream flow and an even more important contributor to DIN as a result of the high DIN
556
concentrations in the aquifer (Adyasari et al., 2018; Exner-Kittridge et al., 2016; Schilling et
557
al., 2018). The downstream part of the Salaison River in particular delivers 44% to 56% of the
558
DIN inputs to the Or lagoon, even though it only covers 25% of the surface watershed.
559
Moreover, inputs of groundwater downstream are less likely to be consumed before arriving at
17
the Salaison outlet compared with inputs to the upstream part of the stream, since their transit
561
time before reaching the outlet is shorter (Seitzinger, 1988).
562
In addition, the water in the two canals located downstream from the gauging station originates
563
from groundwater (Fig. 9). The original purpose of the two canals was to receive waste water
564
and storm water in high flow conditions (Aquascop, 2013), but they also acted as pathways
565
which enabled groundwater to reach the main channel by improving its drainage contact with
566
the aquifer (Rozemeijer and Broers, 2007). Groundwater is carried to the Salaison river through
567
these outlets, adding flow to the direct groundwater discharge which occurs all along the river.
568
The Roubine canal delivers a significant proportion of the groundwater flow (from 10 to 40
569
L.s-1) to the last part of the Salaison River and the short transit time before reaching Or lagoon
570
limits the consumption of associated DIN fluxes.
571
Inflows of groundwater to the downstream part of the Salaison River are a major source of DIN
572
and these inputs are not monitored by the gauging station, suggesting that the position of the
573
gauging station may have a significant impact on the estimation of DIN fluxes at the Salaison
574
outlet (Fig. 10). Locating the Salaison gauging station 2 000 m downstream, at the limit
575
between alluvial bedrock and lagoon silt would make it possible to monitor water flow and
576
DIN concentrations more accurately while still avoiding the intrusion of lagoon water (Fig. 3).
577
The results of this study emphasize the need to understand surface water /groundwater
578
interactions on the continent to satisfactorily monitor nutrient fluxes to the coastal zone
579
(Delconte et al., 2014; Jin et al., 2016). Nevertheless, for the five hydrological cylces studied,
580
annual DIN inputs at the Salaison outlet were found to be correlated with annual rainfall
581
(R²=0.92; X = 0.106\ − 26, data not shown). Thus, available rainfall data could provide a
582
preliminary estimation of the annual load reaching the Or lagoon, as long as groundwater and
583
surface runoff constitute the main DIN sources in the stream.
584
5.3. Groundwater is a significant source of DIN in the Or lagoon
585
The final aim of this study was to estimate total DIN inputs from the alluvial aquifer to the Or
586
lagoon. Previous studies had concluded that no direct submarine groundwater discharge in the
587
lagoon or from other groundwater pathways from the Villafranchien aquifer to the Or lagoon
588
needed to be identified. Since geological characteristics on the northern border of the lagoon
589
at the limit with the aquifer are similar for all the northern streams, our work focused on the
590
Salaison River as a representative area for surface water / groundwater interactions. First, the
591
hydraulic gradients from the piezometric contour of the aquifer around the Salaison river
592
indicated that in high flow conditions, most of the groundwater discharges upstream from the
593
silt layer (Fig. 3). A change in permeability must cause groundwater outflow upstream from
594
the alluvium/silt interface (Santamaria, 1995), not only in the Salaison groundwater catchment
595
but also in the surrounding wetlands on the northern part of the lagoon (Fig. 1a). In these areas,
596
evaporation and plant uptake are high and man-made embankments often divide up the natural
597
areas, so the real quantity of water that arrives in the lagoon in this way may be negligible. The
598
streams thus represent the only outlets for the water table, with the Salaison River as one of the
599
main streams. Although the Salaison only accounts for 17% of the Or surface watershed, it
600
delivers 59% of total freshwater originating from the northern streams (Colin et al., 2017) and,
601
according to our results, including significant groundwater-driven inputs of DIN (> 90%) (Fig.
18
10). This study demonstrates that the Salaison River is a major conveyor of groundwater-driven
603
DIN to the Or lagoon, and is probably representative of groundwater inputs to the Or lagoon
604
from other natural streams nearby, owing to similar hydrology and hydrogeology. Moreover,
605
the important aquifer interaction with the stream could explain the important contribution of
606
the Salaison to the freshwater inputs in comparison with its small watershed.
607
To estimate groundwater driven DIN inputs from all these northern streams, two extreme
608
hydrological behaviours can be assumed. First, the Salaison can be considered as the only
609
stream fed by groundwater in the northern part of the watershed. Hence, depending on
610
hydrological conditions, this study suggests that 10 (dry hydrological cycle) to 98 tN.y-1 (wet
611
hydrological cycle) originating from the Villafranchien aquifer reach the Or lagoon every year
612
(Fig. 10). It can also be assumed that all the northern streams are characterised by similar
613
surface water/groundwater interactions and DIN end-members as those of the Salaison River.
614
Since these stream supply 40% of freshwater to the Or lagoon (Colin et al., 2017), assuming
615
that 90% of this freshwater originates from groundwater, DIN inputs can be estimated. In this
616
case, 17 (dry hydrological cycle) to 163 tN.y-1 (wet hydrological cycle) of groundwater driven
617
DIN reach the Or lagoon. Extrapolations to other northern streams involve considerable
618
uncertainties because (1) the surface water in other parts of the aquifer might constitute a
619
significant DIN source depending on land occupation, (2) the groundwater catchment of the
620
Salaison River is larger than the surface watershed, thereby reducing the aquifer system of
621
other streams including their groundwater discharge (Fig. 3). Despite these uncertainties, these
622
simple estimations provide an order of magnitude for total groundwater driven DIN inputs to
623
the Or lagoon, with minimum (results for the Salaison only) and maximum values.
624
5.4. Implications for managements actions in the Or lagoon
625
This study has shown that, even though groundwater does not discharge directly into the
626
lagoon, groundwater-driven inputs to the inflowing stream are a significant source of DIN to
627
the Or lagoon and are only partially taken into account in current observations made at the
628
gauging stations. Our investigation focussed on DIN, at the origin of eutrophication - with the
629
predominance of nitrate from the Salaison (74% to 99% of total DIN). Similar considerations
630
apply to phosphorus or crop protection products (pesticides), for example, and, depending on
631
concentration in the groundwater and the half-life of the molecule concerned, inputs to the
632
coast may also be significant. This study has shown that the aquifer and its subsurface
633
catchment have to be taken into account in territorial strategies (Adyasari et al., 2018; Stieglitz
634
et al., 2013). This implies that the area targeted by management actions aimed at reducing
635
inputs of the nutrient to the coastal zone has to extend from the watershed to the groundwater
636
catchment. The residence time of water in the aquifer is another important parameter to take
637
into account in management planning and monitoring: if the travel time is long, results of
638
management actions will only be observed with a significant lag time (Fenton et al., 2011; van
639
Lanen and Dijksma, 1999; Vervloet et al., 2018). Concentrations of DIN in the aquifer have
640
remained relatively constant in the past decade, evidence that management actions in the
641
watershed have not improved the quality of the groundwater so far. Groundwater dating should
642
give an indication of time needed to see improvement in the nutrient concentration at the
643
aquifer outlet (Aquilina et al., 2012).
19
Conclusions
645
The complementary methods used in this study enabled us to investigate surface water /
646
groundwater interactions in the upstream and downstream sections of the Salaison River.
647
Groundwater was shown to be the main source of DIN (mainly NO3) contamination of the
648
Salaison River, thereby revealing streams to be indirect pathways for groundwater to reach the
649
Or lagoon. Inputs are naturally governed by hydrogeological conditions and are usually
650
considerably underestimated when they are only measured at the gauging station. The high
651
level of groundwater driven DIN inputs estimated in this study could inhibit restoration of the
652
Or lagoon for many years. The results of the study improve our understanding of indirect
653
groundwater-driven nutrient inputs from an alluvial aquifer to the coastal zone and of the
654
land/sea continuum.
655
Acknowledgements
656
This research was funded by the French National Research Agency (ANR) through the ANR
657
@RAction chair of excellence (ANR-14-ACHN-0007-01 - T Stieglitz). This research is part
658
of a PhD projet funded by IFREMER, BRGM and CEREGE. The authors acknowledge A
659
Nefzi, E Bousquet and S Pistre for their support with data collection and analysis. We are
660
grateful to F Maldan (BRGM Montpellier) for all his help in the field, and also to C Saguet and
661
L Dijoux (IFREMER Sète). DIN samples were analysed at IFREMER Sète laboratory
662
(COFRAC - accredited) with the help of M Fortune, E Foucault and G Messiaen. We thank F
663
Colin (SupAgro Montpellier), R De Wit (CNRS Montpellier), E Roque (IFREMER Sète), P
664
Souchu (IFREMER Nantes) and JB Martin (University of Florida) for constructive comments
665
on our paper. We are grateful of the two reviewers that provided useful comments to improve
666
the manuscript.
20
References
668
Adyasari, D., Oehler, T., Afiati, N., Moosdorf, N., 2018. Groundwater nutrient inputs into an
669
urbanized tropical estuary system in Indonesia. Sci. Total Environ. 627, 1066–1079.
670
https://doi.org/10.1016/J.SCITOTENV.2018.01.281
671
Aminot, A., Kerouel, R., 2007. Dosage automatique des nutriments dans les eaux marines :
672
méthodes en flux continu. Editions Ifremer, 188 p.
673
Aquascop, 2013. Suivi 2012 de la qualité des eaux des bassins versants de l’étang de Thau, de
674
l’étang de l’Or, du Lez et de la Mosson. Aquascop/7197 - 307 p.
675
Aquilina, L., Vergnaud-Ayraud, V., Labasque, T., Bour, O., Molénat, J., Ruiz, L., de Montety,
676
V., De Ridder, J., Roques, C., Longuevergne, L., 2012. Nitrate dynamics in agricultural
677
catchments deduced from groundwater dating and long-term nitrate monitoring in
678
surface- and groundwaters. Sci. Total Environ. 435–436, 167–178.
679
https://doi.org/10.1016/J.SCITOTENV.2012.06.028
680
Avery, E., Bibby, R., Visser, A., Esser, B., Moran, J., 2018. Quantification of Groundwater
681
Discharge in a Subalpine Stream Using Radon-222. Water 10, 100 p.
682
https://doi.org/10.3390/w10020100
683
Banks, E.W., Simmons, C.T., Love, A.J., Shand, P., 2011. Assessing spatial and temporal
684
connectivity between surface water and groundwater in a regional catchment:
685
Implications for regional scale water quantity and quality. J. Hydrol. 404, 30–49.
686
https://doi.org/10.1016/J.JHYDROL.2011.04.017
687
Basset, A., Elliott, M., West, R.J., Wilson, J.G., 2013. Estuarine and lagoon biodiversity and
688
their natural goods and services. Estuar. Coast. Shelf Sci. 132, 1–4.
689
https://doi.org/10.1016/J.ECSS.2013.05.018
690
Baudron, P., Cockenpot, S., Lopez-Castejon, F., Radakovitch, O., Gilabert, J., Mayer, A.,
691
Garcia-Arostegui, J.L., Martinez-Vicente, D., Leduc, C., Claude, C., 2015. Combining
692
radon, short-lived radium isotopes and hydrodynamic modeling to assess submarine
693
groundwater discharge from an anthropized semiarid watershed to a Mediterranean
694
lagoon (Mar Menor, SE Spain). J. Hydrol. 525, 55–71.
695
https://doi.org/10.1016/j.jhydrol.2015.03.015
696
Blaise, M., Dorfliger, N., Le Strat, P., Ladouche, B., 2008. Etang de l’Or : relations entre les
697
eaux souterraines de l’aquifère de sub-surface et l’étang de l’Or en liaison avec
698
l’occupation du sol. BRGM/RP-55367-FR - 275 p.
699
Burnett, W.C., Aggarwal, P.K.K., Aureli, A., Bokuniewicz, H., Cable, J.E.E., Charette,
700
M.A.A., Kontar, E., Krupa, S., Kulkarni, K.M.M., Loveless, A., Moore, W.S.S.,
701
Oberdorfer, J.A.A., Oliveira, J., Ozyurt, N., Povinec, P., Privitera, A.M.G.M.G., Rajar,
702
R., Ramessur, R.T.T., Scholten, J., Stieglitz, T., Taniguchi, M., Turner, J.V. V., 2006.
703
Quantifying submarine groundwater discharge in the coastal zone via multiple methods.
704
Sci. Total Environ. 367, 498–543. https://doi.org/10.1016/j.scitotenv.2006.05.009